. 2015 Apr 21;7(1):48.
doi: 10.1186/s13148-015-0081-5. eCollection 2015.

A statistical method for single sample analysis of HumanMethylation450 array data: genome-wide methylation analysis of patients with imprinting disorders

Affiliations

A statistical method for single sample analysis of HumanMethylation450 array data: genome-wide methylation analysis of patients with imprinting disorders

Faisal I Rezwan et al. Clin Epigenetics. .

Abstract

Background: The Illumina Infinium HumanMethylation450 BeadChip is an array-based technology for analysing DNA methylation at approximately 475,000 differentially methylated cytosines across the human genome. Hitherto, the array has been used for case-control studies, where sample numbers can be sufficient to yield statistically robust data on a genome-wide basis. We recently reported an informatic pipeline capable of yielding statistically and biologically significant results using only five cases, which expanded the use of this technology to rare disease studies. However, the clinical application of these technologies requires the ability to perform robust analysis of individual patients.

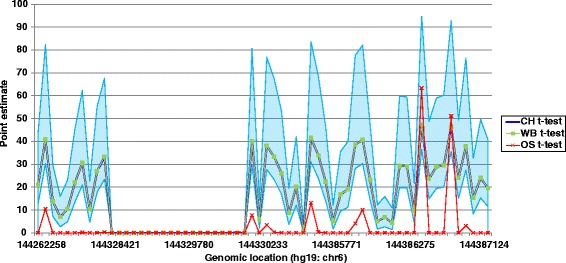
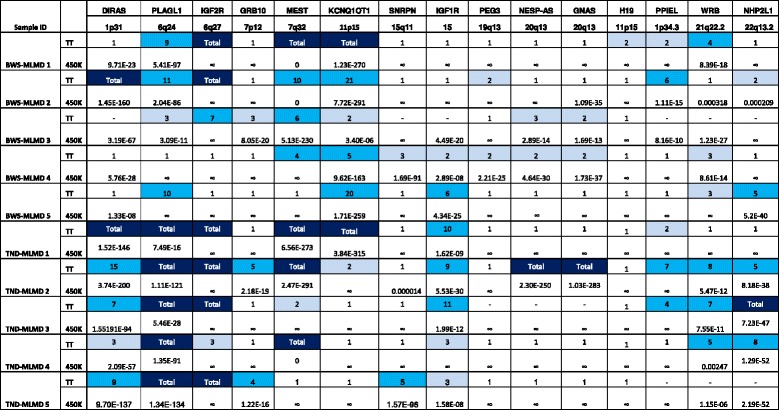
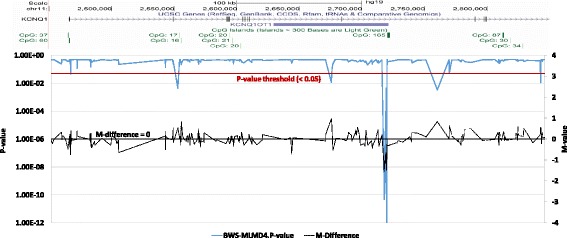
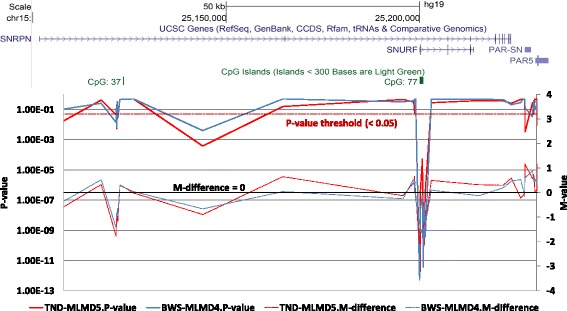
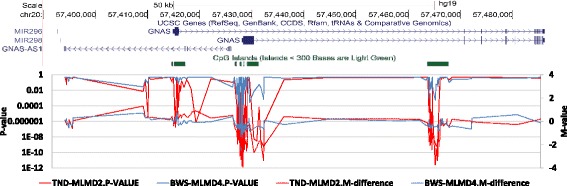
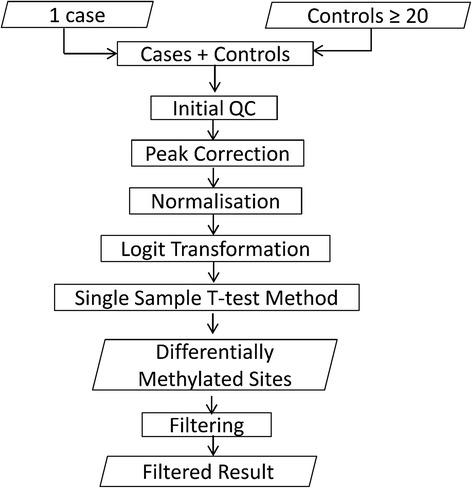
Results: Here we report a novel informatic approach for methylation array analysis of single samples, using the Crawford-Howell t-test. We tested our approach on patients with ultra-rare imprinting disorders with aberrant DNA methylation at multiple locations across the genome, which was previously detected by targeted testing. However, array analysis outperformed targeted assays in three ways: it detected loci not normally analysed by targeted testing, detected methylation changes too subtle to detect by the targeted testing and reported broad and consistent methylation changes across genetic loci not captured by point testing.

Conclusions: This method has potential clinical utility for human disorders where DNA methylation change may be a biomarker of disease.

Keywords: Crawford-Howell t-test; Illumina HumanMethylation450 array; Methylation; Single case-control analysis.


Figures

Figure 1
Figure 1
The performance of three t-tests (one-sample, Weisberg and Crawford-Howell t-tests) around the PLAGL1 region in TND-MLMD 1. The x-axis denotes the genomic location of PLAGL1 on chromosome 6. The y-axis represents the estimated percentage of the control population that would be expected to obtain lower score than the case (point estimate), which is calculated according to the one-sample (OS, red crossed line), Weisberg (WB, green line with green square markers) and Crawford-Howell (CH, blue line) methods. The blue shade represents 95% confidence interval of the point estimates from the noncentrality parameter from a noncentral t-distribution.
Figure 2
Figure 2
Comparison of detection of methylation changes between targeted DNA methylation testing and single sample analysis. Column headers indicate the loci tested and their genomic locations. Rows denote targeted testing (TT) and single sample analysis (450 k) results of individual patients, grouped by their presenting disorder. The DNA methylation at differentially methylated loci was estimated by methylation-specific PCR (msPCR) in TT. A methylation ratio of 1 is equivalent to hemizygous methylation, as seen in normal controls; a ratio of 2 indicates two-fold excess of unmethylated over methylated template; ‘Total’ indicates no detectable methylated sequences. The intensity of blue shading reflects the severity of hypomethylation. A dash indicates no data, normally because insufficient DNA prevented completion of all testing. For 450 k, the P values have been determined by Fisher’s combined P value method for independent tests. The ∞ symbol means no significant methylation changes were detected at that region and 0 is yielded while the P value is too small (<10−350). BWS-MLMD, Beckwith-Wiedemann syndrome-multi-locus methylation disorders; TND-MLMD, transient neonatal diabetes-multi-locus methylation disorders.
Figure 3
Figure 3
Identification of hypomethylation at the cardinal loci in an MLMD sample. Upper panel: Genomic location from the UCSC genome browser, illustrating the KCNQ1 gene and the imprinting control region. Lower panel: graphical presentation of 450 k DNA methylation data across the KCNQ1 gene in BWS-MLMD 4. The x-axis corresponds to the genomic location as illustrated in the upper panel. The primary y-axis (left) represents the CH P value (solid blue line); the secondary y-axis (right) represents the difference in M value between BWS-MLMD 4 and controls (dashed black line). BWS-MLMD, Beckwith-Wiedemann syndrome-multi-locus methylation disorders.
Figure 4
Figure 4
Identification of hypomethylation at the SNRPN locus in MLMD samples. Upper panel: Genomic location from the UCSC genome browser, illustrating the SNRPN gene and the imprinting control region. Lower panel: graphical presentation of 450 k DNA methylation data across the SNRPN gene in BWS-MLMD 4 (red) and TND-MLMD 5 (blue). The x-axis corresponds to the genomic location as illustrated in the upper panel. The primary y-axis (left) represents the CH P value (solid lines); the secondary y-axis (right) represents the difference in M value between the cases and controls (dashed lines). BWS-MLMD, Beckwith-Wiedemann syndrome-multi-locus methylation disorders; TND-MLMD, transient neonatal diabetes-multi-locus methylation disorders.
Figure 5
Figure 5
Identification of hypomethylation at the GNAS locus in MLMD samples. Upper panel: Genomic location from the UCSC genome browser, illustrating the GNAS locus and three regions of high CpG density harbouring differentially methylated regions. Lower panel: graphical presentation of 450 k DNA methylation data across the GNAS locus TND-MLMD 2 (red) and BWS-MLMD 4 (blue). The x-axis corresponds to the genomic location as illustrated in the upper panel. The primary y-axis (left) represents the CH P value (solid lines); the secondary y-axis (right) represents the difference in M values between cases and controls (dashed lines). Note the hypomethylation clearly visible at three locations in TND-MLMD 2, coinciding with the more subtle hypomethylation detectable in BWS-MLMD 4 primarily through significance of P value. BWS-MLMD, Beckwith-Wiedemann syndrome-multi-locus methylation disorders; TND-MLMD, transient neonatal diabetes-multi-locus methylation disorders.
Figure 6
Figure 6
Workflow of the single case-control pipeline. Each single case was pre-processed with the controls using IMA package, and then the Crawford-Howell t-test method was implemented to identify differentially methylated sites. To reduce the rate of false positives, filtration criteria were set to obtain filtered results.

References

    1. Feinberg AP. Phenotypic plasticity and the epigenetics of human disease. Nature. 2007;447:433–40. doi: 10.1038/nature05919. - DOI - PubMed
    1. Yang BZ, Zhang H, Ge W, Weder N, Douglas-Palumberi H, Perepletchikova F, et al. Child abuse and epigenetic mechanisms of disease risk. Am J Prev Med. 2013;44:101–7. doi: 10.1016/j.amepre.2012.10.012. - DOI - PMC - PubMed
    1. Shenker NS, Polidoro S, van Veldhoven K, Sacerdote C, Ricceri F, Birrell MA, et al. Epigenome-wide association study in the European Prospective Investigation into Cancer and Nutrition (EPIC-Turin) identifies novel genetic loci associated with smoking. Hum Mol Genet. 2013;22:843–51. doi: 10.1093/hmg/dds488. - DOI - PubMed
    1. Moore K, McKnight AJ, Craig D, O’Neill F. Epigenome-wide association study for Parkinson’s disease. Neuromolecular Med. 2014;16:845–55. doi: 10.1007/s12017-014-8332-8. - DOI - PubMed
    1. Seow WJ, Kile ML, Baccarelli AA, Pan WC, Byun HM, Mostofa G, et al. Epigenome-wide DNA methylation changes with development of arsenic-induced skin lesions in Bangladesh: a case-control follow-up study. Environ Mol Mutagen. 2014;55:449–56. doi: 10.1002/em.21860. - DOI - PMC - PubMed

LinkOut - more resources