

Solvent and Temperature Probes of the Long-Range Electron-Transfer Step in Tyramine β-Monooxygenase: Demonstration of a Long-Range Proton-Coupled Electron-Transfer Mechanism
- PMID: 25919134
- PMCID: PMC4970857
- DOI: 10.1021/ja512388n
Solvent and Temperature Probes of the Long-Range Electron-Transfer Step in Tyramine β-Monooxygenase: Demonstration of a Long-Range Proton-Coupled Electron-Transfer Mechanism
Abstract
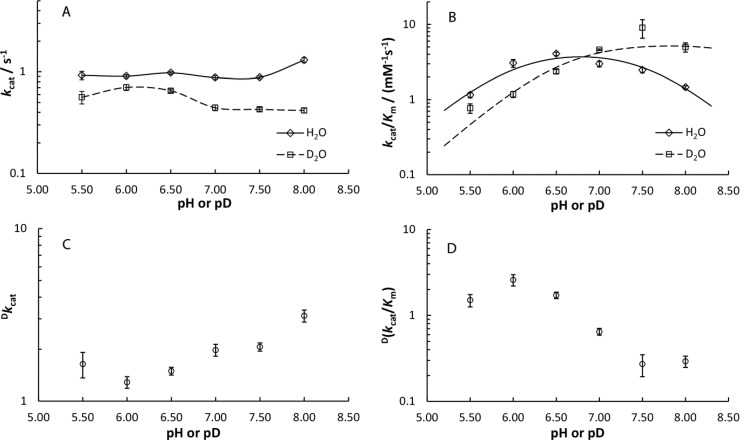
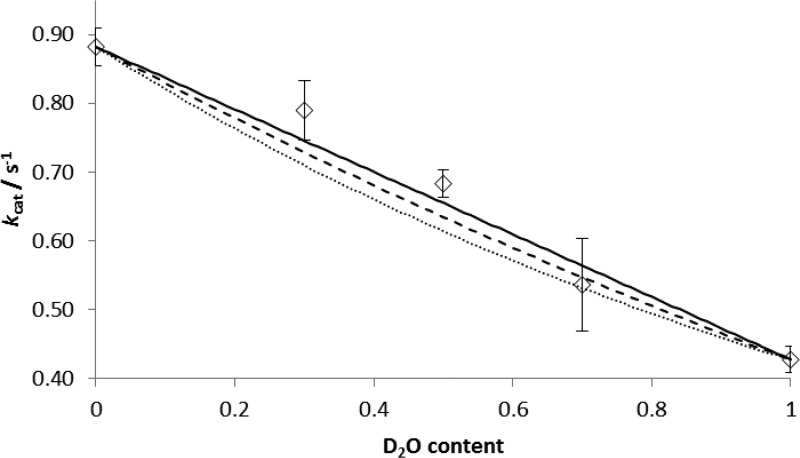
Tyramine β-monooxygenase (TβM) belongs to a family of physiologically important dinuclear copper monooxygenases that function with a solvent-exposed active site. To accomplish each enzymatic turnover, an electron transfer (ET) must occur between two solvent-separated copper centers. In wild-type TβM, this event is too fast to be rate limiting. However, we have recently shown [Osborne, R. L.; et al. Biochemistry 2013, 52, 1179] that the Tyr216Ala variant of TβM leads to rate-limiting ET. In this study, we present a pH-rate profile study of Tyr216Ala, together with deuterium oxide solvent kinetic isotope effects (KIEs). A solvent KIE of 2 on kcat is found in a region where kcat is pH/pD independent. As a control, the variant Tyr216Trp, for which ET is not rate determining, displays a solvent KIE of unity. We conclude, therefore, that the observed solvent KIE arises from the rate-limiting ET step in the Tyr216Ala variant, and show how small solvent KIEs (ca. 2) can be fully accommodated from equilibrium effects within the Marcus equation. To gain insight into the role of the enzyme in the long-range ET step, a temperature dependence study was also pursued. The small enthalpic barrier of ET (Ea = 3.6 kcal/mol) implicates a significant entropic barrier, which is attributed to the requirement for extensive rearrangement of the inter-copper environment during PCET catalyzed by the Tyr216Ala variant. The data lead to the proposal of a distinct inter-domain pathway for PCET in the dinuclear copper monooxygenases.
Conflict of interest statement
The authors declare no competing financial interest.
Figures


References
-
- Weinberg D. R.; Gagliardi C. J.; Hull J. F.; Murphy C. F.; Kent C. A.; Westlake B. C.; Paul A.; Ess D. H.; McCafferty D. G.; Meyer T. J. Chem. Rev. 2012, 112, 4016. - PubMed
Publication types
MeSH terms
Substances
Grants and funding
LinkOut - more resources
Full Text Sources
Other Literature Sources
Research Materials
