. 2015 Apr 28:6:6342.
doi: 10.1038/ncomms7342.

Fat, fibre and cancer risk in African Americans and rural Africans

Affiliations

Fat, fibre and cancer risk in African Americans and rural Africans

Stephen J D O'Keefe et al. Nat Commun. .

Abstract

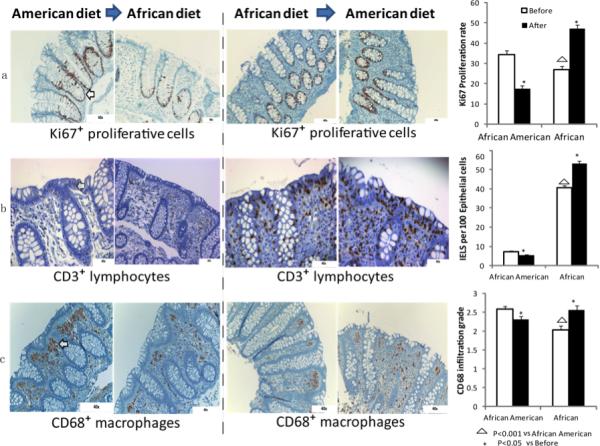
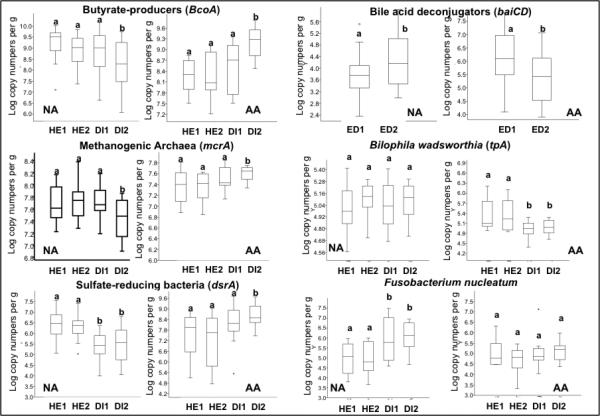
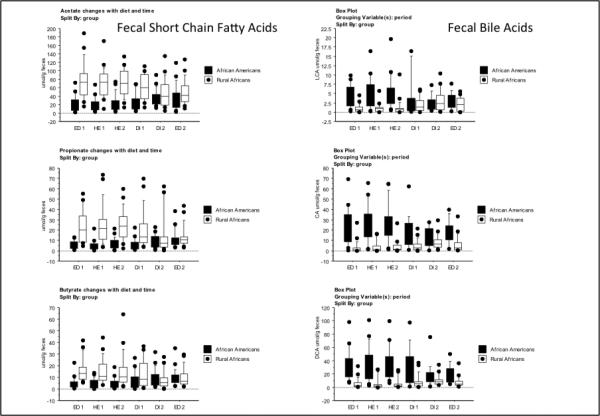
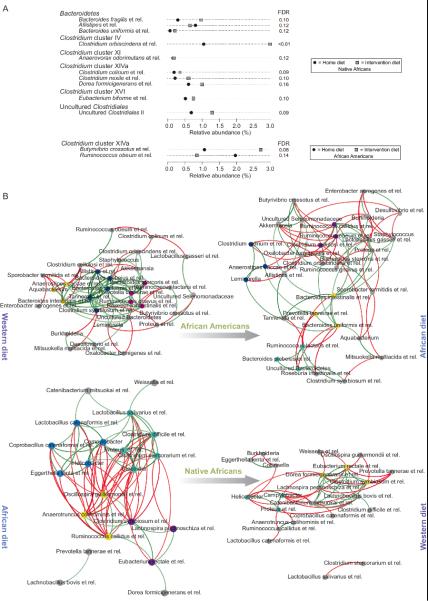
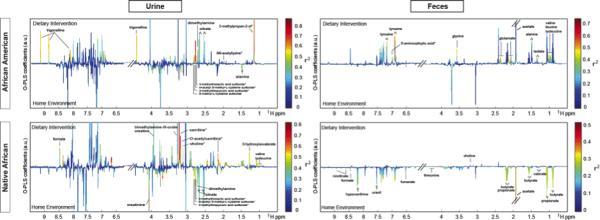
Rates of colon cancer are much higher in African Americans (65:100,000) than in rural South Africans (<5:100,000). The higher rates are associated with higher animal protein and fat, and lower fibre consumption, higher colonic secondary bile acids, lower colonic short-chain fatty acid quantities and higher mucosal proliferative biomarkers of cancer risk in otherwise healthy middle-aged volunteers. Here we investigate further the role of fat and fibre in this association. We performed 2-week food exchanges in subjects from the same populations, where African Americans were fed a high-fibre, low-fat African-style diet and rural Africans a high-fat, low-fibre western-style diet, under close supervision. In comparison with their usual diets, the food changes resulted in remarkable reciprocal changes in mucosal biomarkers of cancer risk and in aspects of the microbiota and metabolome known to affect cancer risk, best illustrated by increased saccharolytic fermentation and butyrogenesis, and suppressed secondary bile acid synthesis in the African Americans.


Figures

Figure 1
Figure 1. Colonic Mucosal Immunohistochemistry of Proliferative and Inflammatory Biomarkers
Immunohistochemical analysis of colonic mucosal biopsies taken at colonoscopy with their associated quantitative analysis on right panel. Panel ‘a’ provides an illustration of the paired changes in Ki67 staining of epithelial crypt cells in one African American and one rural African before and after dietary switch, panel ‘b’ shows in the same way paired changes in CD3+ staining, and panel ‘c’ the paired changes in CD68+ macrophages in the lamina propria. The bar graphs on the far right summarize the group mean ±SE results in 20 African Americans and 12 rural Africans. The two-tailed Mann-Whitney U-test was used for comparisons for non-paired samples and the Wilcoxon Rank Sum test for paired samples, with Bonferroni correction for multivariate comparisons. Triangles indicate significant (p<0.05) baseline differences, stars significant changes induced by diet switch
Figure 2
Figure 2. Targeted Analysis of Microbial Functional Genes of Specific Interest and Their Metabolites
Box plots with whiskers and outliers summarizing the results for the targeted functional qPCR analysis of microbial genes of interest (upper panel), and measurements of their metabolic products in fecal samples (lower panel) in 20 African American (AA) and 20 rural Africans (NA) at sequential time points during the study. Group median and variability outside the upper and lower quartiles are shown. Measurements were taken before (Table 1: ED1, HE1, HE2), during (DI1, DI2) and after (ED2) 2 weeks of dietary change. With regard to the functional gene analysis, bcoA encodes for the enzyme butyryl-CoA:acetate CoA-transferase which is responsible for the last step in butyrate synthesis, mcrA for the enzyme responsible for methanogenesis, and baiCD for the 7-alpha-dehydroxylating enzyme responsible for secondary bile acid production. LCA represent lithocholic acid, CA cholic acid, DCA deoxycholic acid. As data was not normally distributed, the Kruskal-Wallis test was used to evaluate the significance of the group median differences across the different time points shown on the box plots. In the upper panel, comparison to baseline ED1, ‘a’ signifies no significant change, and ‘b’ a significant change. In the lower panel for the short chain fatty acids acetate, propionate and butyrate, and the secondary bile acids lithocholic acid (LCA) and deoxycholic acid (DCA) and primary bile acid cholic acid (CA), there were no significant differences between time points ED1, HE1 and HE2, while ED2 was consistently different (p<0.05, for details see Supplementary Table 6). This, together with Supplementary Figure 6, illustrates no significant effect from colonoscopy, and a profound effect from the dietary change.
Figure 3
Figure 3. The impact of diet switch on microbiota composition and co-occurrence networks
Panel A provides an overview of significantly altered genus-like bacterial groups (FDR<0.2; linear model) following the 14-day diet change. Average fraction of total HITChip signal (proxy for relative abundance) over the samples for each comparison. Black and grey squares indicate the average abundances at home- and intervention diet, respectively. Panel B illustrates the microbiota genus-like group co-occurrence networks of Africans and African Americans under both dietary regimens for genus-like groups. Groups with correlation differences >1 before and after the diet and at least |r| >0.5 are shown. Positive correlations are indicated with green lines; negative correlations with red lines. Identically colored nodes indicate network modules with three or more co-occurring groups. Grey nodes represent modules of less than three co-occurring groups or those not represented by a module. The sample sizes are 20 African Americans and 17 rural (Native) Africans.
Figure 4
Figure 4. The impact of diet switch on fecal and urinary metabolites and their correlation with faecal microbiota
a) 1H NMR fecal and urinary spectra obtained from African Americans (AA) and native Africans (NA) during the home environment period (HE) and post dietary intervention (DI). Metabolites distinguishing the two groups are labelled either above the line (higher after dietary intervention) or below (higher in home environment) and the color represents the correlation coefficient (r2) of the metabolite with the groups. b) Two-way clustered heatmap of partial correlation between phylotypes assigned to genus-level taxa whose representation in the fecal microbiota (x axis) of African American (AA) and rural Africans (NA) and relative metabolite concentrations in urine and feces (y axis). P-values from correlation were adjusted for multiple testing using the Benjamini-Hochberg False Discovery Rate. Given a large number of tests performed, a cut-off of 0.3 was used to define the significance denoted by ‘+’. This level follows FDA guidelines for bioanalytical biomarkers and was chosen because of the relatively low number of samples it allows for less false negatives. Fecal metabolites (upper compartment) demonstrated a higher number of significant correlations with fecal microbiota compared with urinary metabolites (lower compartment). Eubacterium rectale, Lachnospira pectinoschiza, Roseburia intestinalis and Lactobacillus bovis correlate strongly with butyrate, acetate and formate. Adjustments were made for country (binary vector with 0=AA and 1=NA) and diet/stage (0=HE-2 and 1=DI-2) in calculating the partial correlations).
Figure 5
Figure 5. The impact of diet switch on faecal and urinary metabolic reaction networks
a-c) Metabolic reaction networks of metabolites found differentially expressed between different dietary comparisons, created using the MetaboNetworks software using information from KEGG on the reactions and enzymes within the biological system. The network shows links between metabolites if the reaction entry in KEGG indicates a main reactant pair and the reaction is either mediated by 1) an enzyme linked to human genes, 2) an enzyme linked to genes from identified bacterial groups using the HITChip or 3) it is part of a spontaneous process. The color of the metabolites indicate whether the metabolite is found in higher concentrations in the urine/feces of individuals consuming an African diet (orange), higher in individuals consuming an African-American diet (blue), higher in the African-American home environment (light red), higher in the African home environment (green) or whether the metabolites is not significantly associated with any comparison but is part of the metabolic network (white). Two metabolites (alanine and formate) are found with opposite associations in feces and urine (Table 2), these are therefore represented with a grey background color. A table with full names for each of the abbreviated metabolite names can be found in Supplemental Table 11. The background shading indicates different interconnected pathways. In the top part of the legend the color for each pathway, as represented in the figure, is shown. The bottom part of the legend, with black boxes around text box, indicates the association of each metabolite. a) Global network of changes (“All”) observed in fecal water and urine and in any comparison of the different groups. b) Network of fecal metabolites found differentially expressed in African-Americans before and after the dietary switch (“AA”). c) Network of fecal metabolites found differentially expressed in Africans before and after the dietary switch (“NA”).

Comment in

References

    1. Ferlay J, Shin HR, Bray F, Forman D, Mathers C, Parkin DM. Estimates of worldwide burden of cancer in 2008: GLOBOCAN 2008. Int J Cancer. 2010 Dec 15;127(12):2893–2917. - PubMed
    1. Le Marchand LKL. Cancer among Japanese migrants to Hawaii: Gene-environment interactions. Rev Epidemiol Santé Publique. 1992;40:425–430. - PubMed
    1. Norat T, Aune D, Chan D, Romaguera D. Fruits and Vegetables: Updating the Epidemiologic Evidence for the WCRF/AICR Lifestyle Recommendations for Cancer Prevention. Cancer treatment and research. 2014;159:35–50. - PubMed
    1. O'Keefe SJ, Chung D, Mahmoud N, et al. Why do African Americans get more colon cancer than Native Africans? J Nutr. 2007 Jan;137(1 Suppl):175S–182S. - PubMed
    1. Ou J, Carbonero F, Zoetendal EG, et al. Diet, microbiota, and microbial metabolites in colon cancer risk in rural Africans and African Americans. Am J Clin Nutr. 2013 Jul;98(1):111–120. - PMC - PubMed

Publication types

MeSH terms