. 2015 Apr 28:6:6857.
doi: 10.1038/ncomms7857.

Hyperdominance in Amazonian forest carbon cycling

Sophie Fauset  1 Michelle O Johnson  1 Manuel Gloor  1 Timothy R Baker  1 Abel Monteagudo M  2 Roel J W Brienen  1 Ted R Feldpausch  3 Gabriela Lopez-Gonzalez  1 Yadvinder Malhi  4 Hans ter Steege  5 Nigel C A Pitman  6 Christopher Baraloto  7 Julien Engel  8 Pascal Pétronelli  9 Ana Andrade  10 José Luís C Camargo  10 Susan G W Laurance  11 William F Laurance  11 Jerôme Chave  12 Elodie Allie  13 Percy Núñez Vargas  14 John W Terborgh  15 Kalle Ruokolainen  16 Marcos Silveira  17 Gerardo A Aymard C  18 Luzmila Arroyo  19 Damien Bonal  20 Hirma Ramirez-Angulo  21 Alejandro Araujo-Murakami  19 David Neill  22 Bruno Hérault  9 Aurélie Dourdain  9 Armando Torres-Lezama  21 Beatriz S Marimon  23 Rafael P Salomão  24 James A Comiskey  25 Maxime Réjou-Méchain  12 Marisol Toledo  26 Juan Carlos Licona  27 Alfredo Alarcón  27 Adriana Prieto  28 Agustín Rudas  28 Peter J van der Meer  29 Timothy J Killeen  30 Ben-Hur Marimon Junior  23 Lourens Poorter  31 Rene G A Boot  32 Basil Stergios  18 Emilio Vilanova Torre  21 Flávia R C Costa  33 Carolina Levis  33 Juliana Schietti  33 Priscila Souza  33 Nikée Groot  1 Eric Arets  34 Victor Chama Moscoso  14 Wendeson Castro  35 Euridice N Honorio Coronado  36 Marielos Peña-Claros  37 Clement Stahl  38 Jorcely Barroso  39 Joey Talbot  1 Ima Célia Guimarães Vieira  24 Geertje van der Heijden  40 Raquel Thomas  41 Vincent A Vos  42 Everton C Almeida  43 Esteban Álvarez Davila  44 Luiz E O C Aragão  45 Terry L Erwin  46 Paulo S Morandi  23 Edmar Almeida de Oliveira  23 Marco B X Valadão  23 Roderick J Zagt  47 Peter van der Hout  48 Patricia Alvarez Loayza  15 John J Pipoly  49 Ophelia Wang  50 Miguel Alexiades  51 Carlos E Cerón  52 Isau Huamantupa-Chuquimaco  14 Anthony Di Fiore  53 Julie Peacock  1 Nadir C Pallqui Camacho  14 Ricardo K Umetsu  23 Plínio Barbosa de Camargo  54 Robyn J Burnham  55 Rafael Herrera  56 Carlos A Quesada  33 Juliana Stropp  57 Simone A Vieira  58 Marc Steininger  59 Carlos Reynel Rodríguez  60 Zorayda Restrepo  44 Adriane Esquivel Muelbert  1 Simon L Lewis  61 Georgia C Pickavance  1 Oliver L Phillips  1
Affiliations

Hyperdominance in Amazonian forest carbon cycling

Sophie Fauset et al. Nat Commun. .

Abstract

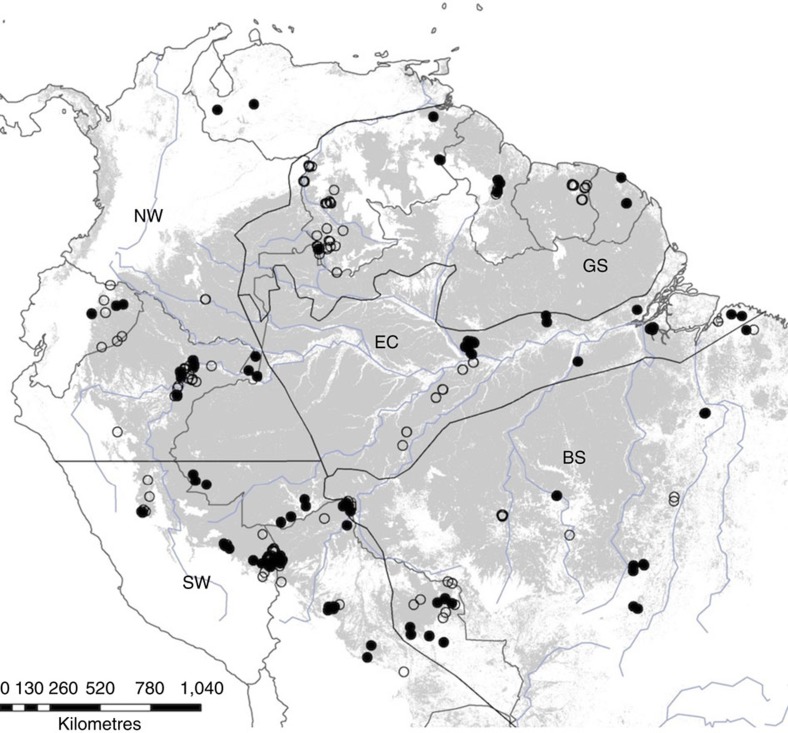
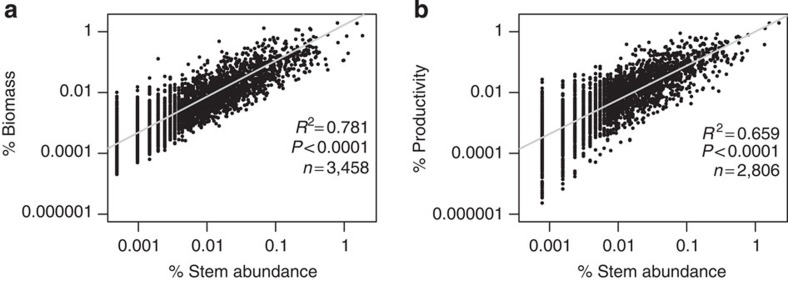
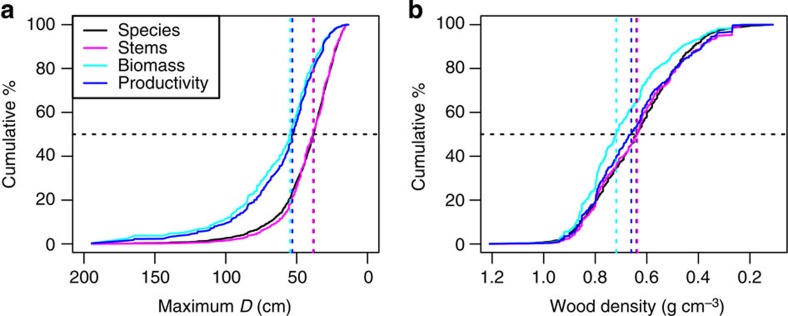
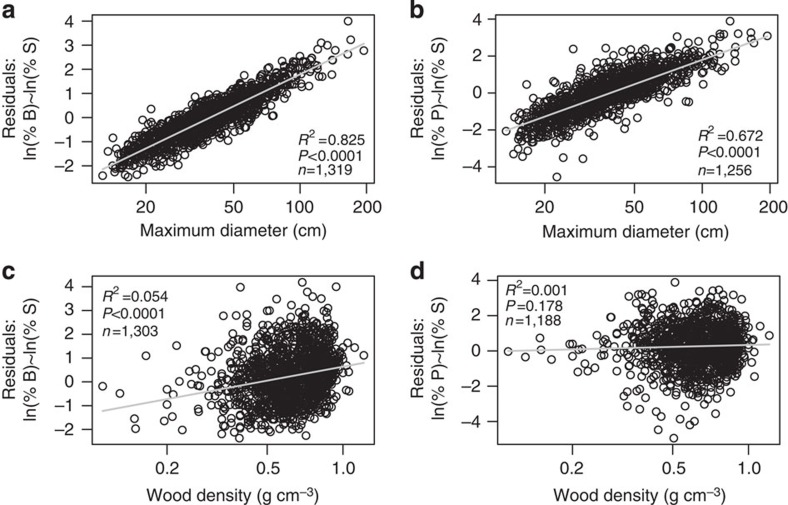
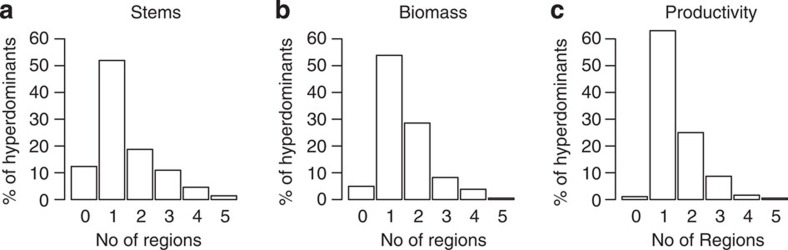
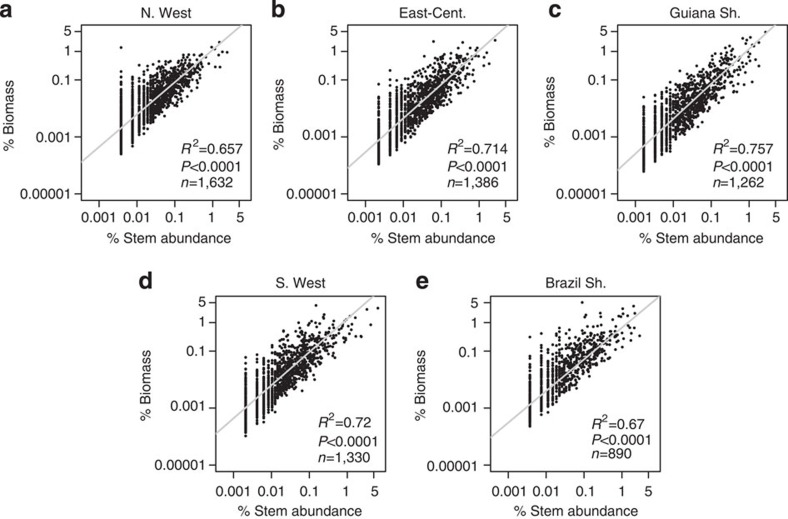
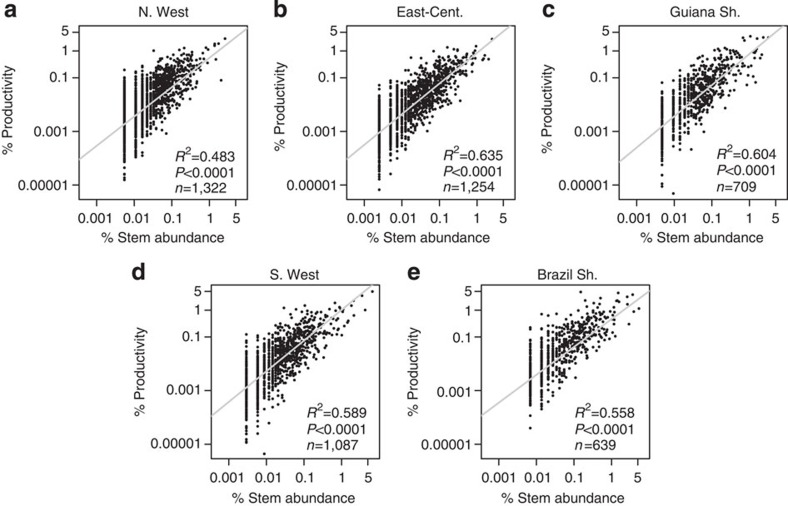
While Amazonian forests are extraordinarily diverse, the abundance of trees is skewed strongly towards relatively few 'hyperdominant' species. In addition to their diversity, Amazonian trees are a key component of the global carbon cycle, assimilating and storing more carbon than any other ecosystem on Earth. Here we ask, using a unique data set of 530 forest plots, if the functions of storing and producing woody carbon are concentrated in a small number of tree species, whether the most abundant species also dominate carbon cycling, and whether dominant species are characterized by specific functional traits. We find that dominance of forest function is even more concentrated in a few species than is dominance of tree abundance, with only ≈1% of Amazon tree species responsible for 50% of carbon storage and productivity. Although those species that contribute most to biomass and productivity are often abundant, species maximum size is also influential, while the identity and ranking of dominant species varies by function and by region.


Figures

Figure 1
Figure 1. Map of plot locations. Open circles—single census plots used for biomass and stem number analyses, closed circles—multi-census plots used for biomass, productivity and stem number analyses.
Black lines—Amazon regional boundaries from Feldpausch et al. with additional north–south separation of the western Amazon; BS—Brazilian shield, EC—east central, GS—Guiana shield, NW—north western, SW—south western. Grey—unflooded closed canopy forest below 500 m.a.s.l. reclassified from GLC2000 data.
Figure 2
Figure 2. Relationships between species contributions to stem abundance and contributions to biomass and productivity.
% contribution of species to total stem abundance with % contribution to (a) total aboveground biomass and (b) total aboveground woody productivity. Regression models are plotted with grey lines. Regression equation for % contribution to biomass: log(% biomass)=0.22+1.18 log(% stem), regression equation for productivity: log(% productivity)=0.003+1.12 log(% stem). All 530 plots are used for a, and the reduced productivity data set of 221 plots is used for b. 77 species with negative or 0 productivity were excluded from b. Plotted on log scale.
Figure 3
Figure 3. Cumulative % contribution to species, stems, biomass and productivity ordered by maximum D and wood density.
(a) Maximum D (n=1,256), (b) wood density (n=1,188). Horizontal dashed black lines represent the mid-point of all metrics, vertical dashed lines show the trait value at the mid-point of each metric. All curves are based on the reduced productivity data set, curves for biomass and stems are very similar when using the full data set (data not shown).
Figure 4
Figure 4. Patterns between plant traits and contributions to biomass and productivity after accounting for abundance.
Relationship between the residuals from ln(% contribution to biomass)=a+b * ln(% contribution to stem number) and (a) maximum D and (c) wood density, relationships between the residuals from ln(% contribution to productivity)=a+b * ln(% contribution to stem number) and (b) maximum D, and (d) wood density. Regression models are plotted with grey lines. Maximum diameter and wood density plotted on a log scale.
Figure 5
Figure 5. Percentage of Amazon-wide hyperdominant species that are also dominant within regions.
(a) stem hyperdominants (n=283), (b) biomass hyperdominants (n=182), (c) productivity hyperdominants (n=184).
Figure 6
Figure 6. Relationships between % contribution of species to stems and % contribution to biomass in five different Amazon regions.
(a) Northwestern Amazonia (N.West), (b) East-central Amazonia (East-Cent.), (c) Guiana shield (Guiana Sh.), (d) Southwestern Amazonia (S.West), (e) Brazilian shield (Brazil Sh.). Regression models are plotted with grey lines. Plotted on log scale.
Figure 7
Figure 7. Relationships between % contribution of species to stems and % contribution to productivity in five different Amazon regions.
(a) Northwestern Amazonia (N.West), (b) East-central Amazonia (East-Cent.), (c) Guiana shield (Guiana Sh.), (d) Southwestern Amazonia (S.West), (e) Brazilian shield (Brazil Sh.). Regression models are plotted with grey lines. Plotted on log scale.

References

    1. ter Steege H. et al. Hyperdominance in the Amazonian tree flora. Science 342, 1243092 (2013). - PubMed
    1. Zhao M. & Running S. W. Drought-induced reduction in global terrestrial net primary production from 2000 through 2009. Science 329, 940–943 (2010). - PubMed
    1. Cao M. & Woodward F. I. Net primary and ecosystem production and carbon stocks of terrestrial ecosystems and their responses to climate change. Glob. Change Biol. 4, 185–198 (1998).
    1. Feldpausch T. R. et al. Tree height integrated into pantropical forest biomass estimates. Biogeosciences 9, 3381–3403 (2012).
    1. Balvanera P. et al. Quantifying the evidence for biodiversity effects on ecosystem functioning and services. Ecol. Lett 9, 1146–1156 (2006). - PubMed

Publication types