. 2015 Nov 15;212(10):1656-65.
doi: 10.1093/infdis/jiv256. Epub 2015 Apr 28.

Loss of Microbiota-Mediated Colonization Resistance to Clostridium difficile Infection With Oral Vancomycin Compared With Metronidazole

Affiliations

Loss of Microbiota-Mediated Colonization Resistance to Clostridium difficile Infection With Oral Vancomycin Compared With Metronidazole

Brittany B Lewis et al. J Infect Dis. .

Abstract

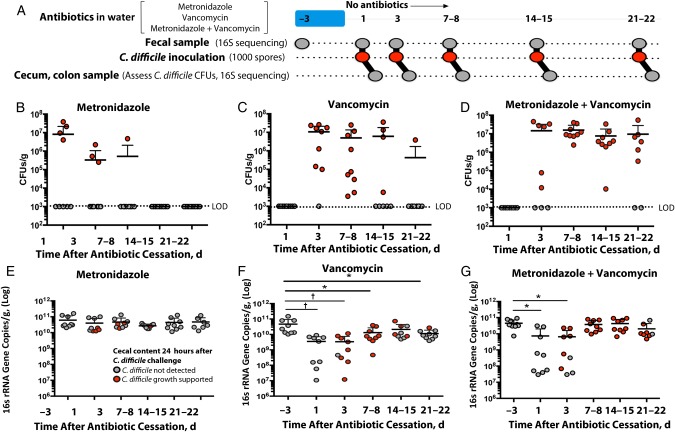
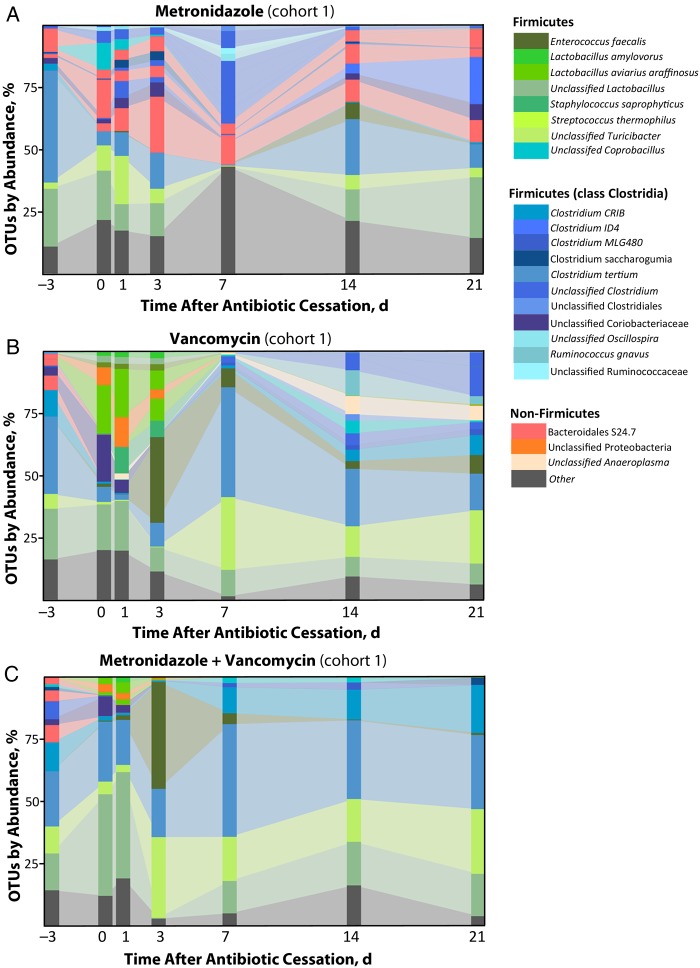
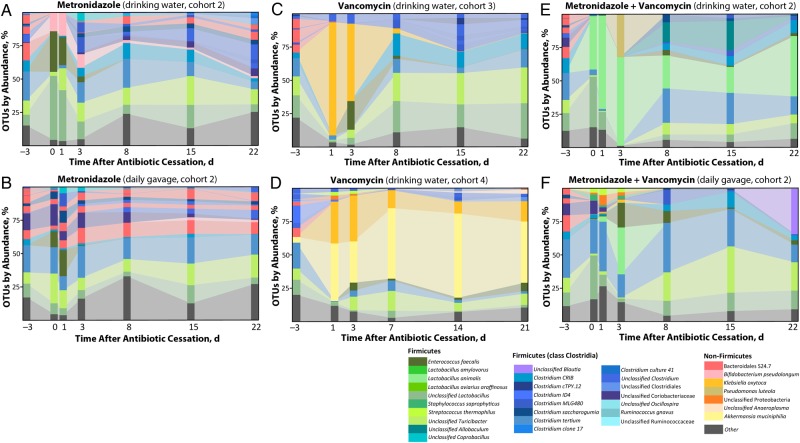
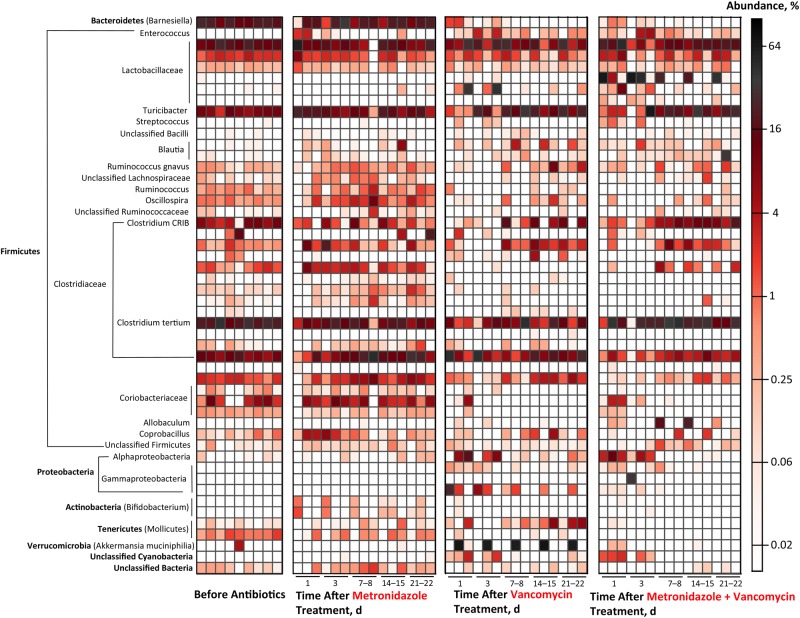
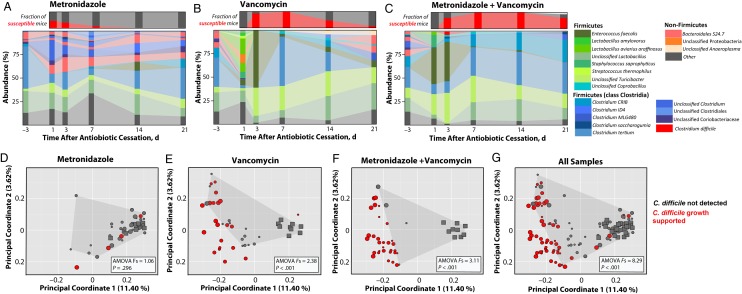
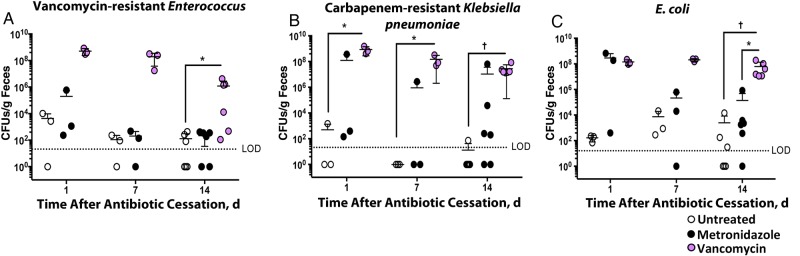
Antibiotic administration disrupts the intestinal microbiota, increasing susceptibility to pathogens such as Clostridium difficile. Metronidazole or oral vancomycin can cure C. difficile infection, and administration of these agents to prevent C. difficile infection in high-risk patients, although not sanctioned by Infectious Disease Society of America guidelines, has been considered. The relative impacts of metronidazole and vancomycin on the intestinal microbiota and colonization resistance are unknown. We investigated the effect of brief treatment with metronidazole and/or oral vancomycin on susceptibility to C. difficile, vancomycin-resistant Enterococcus, carbapenem-resistant Klebsiella pneumoniae, and Escherichia coli infection in mice. Although metronidazole resulted in transient loss of colonization resistance, oral vancomycin markedly disrupted the microbiota, leading to prolonged loss of colonization resistance to C. difficile infection and dense colonization by vancomycin-resistant Enterococcus, K. pneumoniae, and E. coli. Our results demonstrate that vancomycin, and to a lesser extent metronidazole, are associated with marked intestinal microbiota destruction and greater risk of colonization by nosocomial pathogens.

Keywords: Clostridium difficile; colonization resistance; metronidazole; microbiota; vancomycin.


Figures

Figure 1.
Figure 1.
Exposure to metronidazole, vancomycin, or both increases susceptibility to Clostridium difficile infection. A, Summary of experimental protocol. BD, Burden of C. difficile in ceca of mice 24 hours after infection. EG, Intestinal bacterial density of animals before and after antibiotic exposure. Horizontal lines represent means; error bars, standard deviations (n = 9 except for metronidazole + vancomycin–treated mice on days 21–22, where n = 8). *P < .05; P < .01. Abbreviations: CFUs, colony-forming units; LOD, limit of detection.
Figure 2.
Figure 2.
Exposure to metronidazole, vancomycin, or both disrupts commensal bacterial species found in the lower intestine. Fecal samples were collected from mice before antibiotic treatment (day −3) and at the indicated times after cessation of antibiotics. Samples were assessed for bacterial operational taxonomic units (OTUs), as described in “Methods” section. Each stacked bar represents the mean microbiota composition of 3 independently housed mice.
Figure 3.
Figure 3.
Impact of starting microbiota and route of antibiotic administration on resulting changes in bacterial composition. The experiment represented in Figure 2 (mouse cohort 1) was repeated with different cohorts of wild-type C57BL/6 Jackson mice. Mice from cohort 2 were subdivided into 2 additional treatment groups, with the first group receiving antibiotics dissolved in water (A, E), and the other receiving antibiotics by daily oral gavage (B, F). Each stacked bar represents a mean of 3 mice per time point per treatment group (exception: F at day 22, where n = 2). Abbreviation: OTUs, operational taxonomic units.
Figure 4.
Figure 4.
Summary of effects of metronidazole and vancomycin on fecal microbial populations. Sequences from fecal samples were binned into operational taxonomic units (OTUs), and abundance of the 50 most highly represented OTUs was plotted based on percentage of total sequences. Each horizontal bar represents 1 OTU; each vertical bar represents the mean abundance of individual OTUs within 1 cohort of mice at specified time point and treatment group (n = 3 for each vertical bar).
Figure 5.
Figure 5.
Antibiotic-induced disruptions of microbial communities contribute to Clostridium difficile susceptibility. AC, Colon samples were collected from mice 24 hours after C. difficile infection and assessed for abundance of individual bacterial operational taxonomic units (large panels). Each stacked bar represents mean microbiota composition of 3 independently housed mice from cohort 1. Small panels in AC represent the fraction of mice found susceptible to C. difficile 24 hours after infection in all cohorts (red bar; n = 9 mice per time point). DG, Principal coordinate analysis of colon samples from all cohorts 24 hours after infection. Squares represent preantibiotic samples; circles, postantibiotic treatment samples. Circle sizes represent the time point of each posttreatment sample, with large circles representing earliest time points. Analysis of molecular variance (AMOVA) F statistics were used to compare samples in which C. difficile was not detected (gray points bounded by shaded region) with samples that supported C. difficile growth (red points).
Figure 6.
Figure 6.
Exposure to metronidazole and vancomycin affects the colonization ability of vancomycin-resistant Enterococcus, carbapenem-resistant Klebsiella pneumoniae, and Escherichia coli. Mice were treated with indicated antibiotics for 3 days and then allowed to recover. After cessation of antibiotics, mice were challenged with approximately 50 000 colony-forming units (CFUs) of vancomycin-resistant Enterococcus (A), carbapenem-resistant K. pneumoniae (B), or E. coli (C). Fecal pellets were collected from mice 24 hours after infection and assessed for the corresponding pathogen burden. *P < .05, P < .01. Horizontal lines represent means; error bars standard deviations (n = 3 [days 1 and 7] or n = 6 [day 14]). Abbreviation: LOD, limit of detection.

References

    1. Bartlett JG. Historical perspectives on studies of Clostridium difficile and C. difficile infection. Clin Infect Dis 2008; 46(suppl 1):S4–11. - PubMed
    1. McDonald LC, Killgore GE, Thompson A et al. An epidemic, toxin gene-variant strain of Clostridium difficile. N Engl J Med 2005; 353:2433–41. - PubMed
    1. He M, Miyajima F, Roberts P et al. Emergence and global spread of epidemic healthcare-associated Clostridium difficile. Nat Genet 2013; 45:109–13. - PMC - PubMed
    1. Centers for Disease Control and Prevention. Antibiotic resistance threats in the United States. http://www.cdc.gov/drugresistance/threat-report-2013/ Accessed 16 January 2015.
    1. Pépin J, Valiquette L, Alary M-E et al. Clostridium difficile-associated diarrhea in a region of Quebec from 1991 to 2003: a changing pattern of disease severity. Can Med Assoc J 2004; 171:466–72. - PMC - PubMed

Publication types

MeSH terms