. 2015 May 11;27(5):658-70.
doi: 10.1016/j.ccell.2015.03.017. Epub 2015 Apr 23.

Inherited and Somatic Defects in DDX41 in Myeloid Neoplasms

Affiliations

Inherited and Somatic Defects in DDX41 in Myeloid Neoplasms

Chantana Polprasert et al. Cancer Cell. .

Abstract

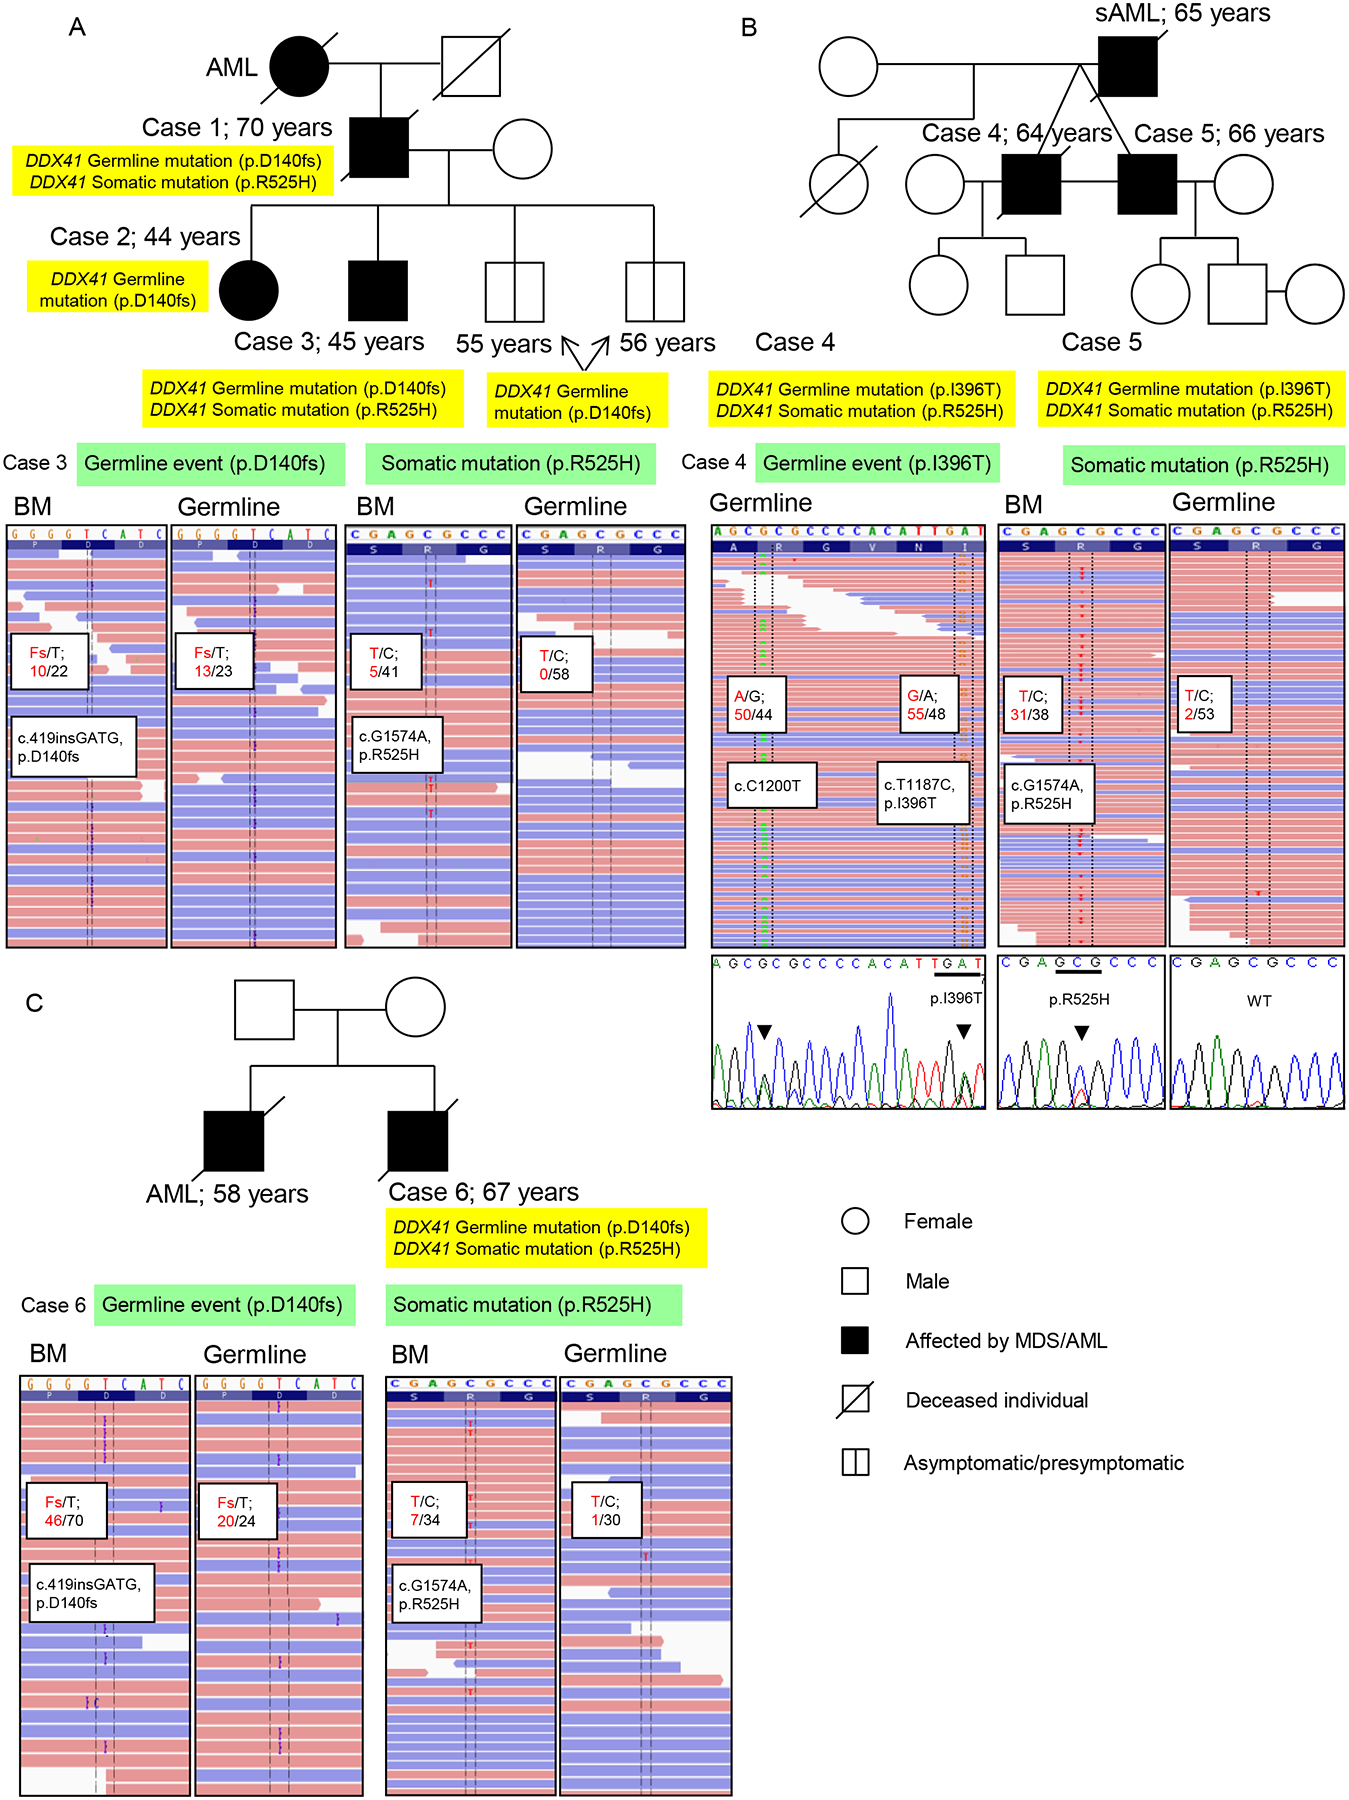
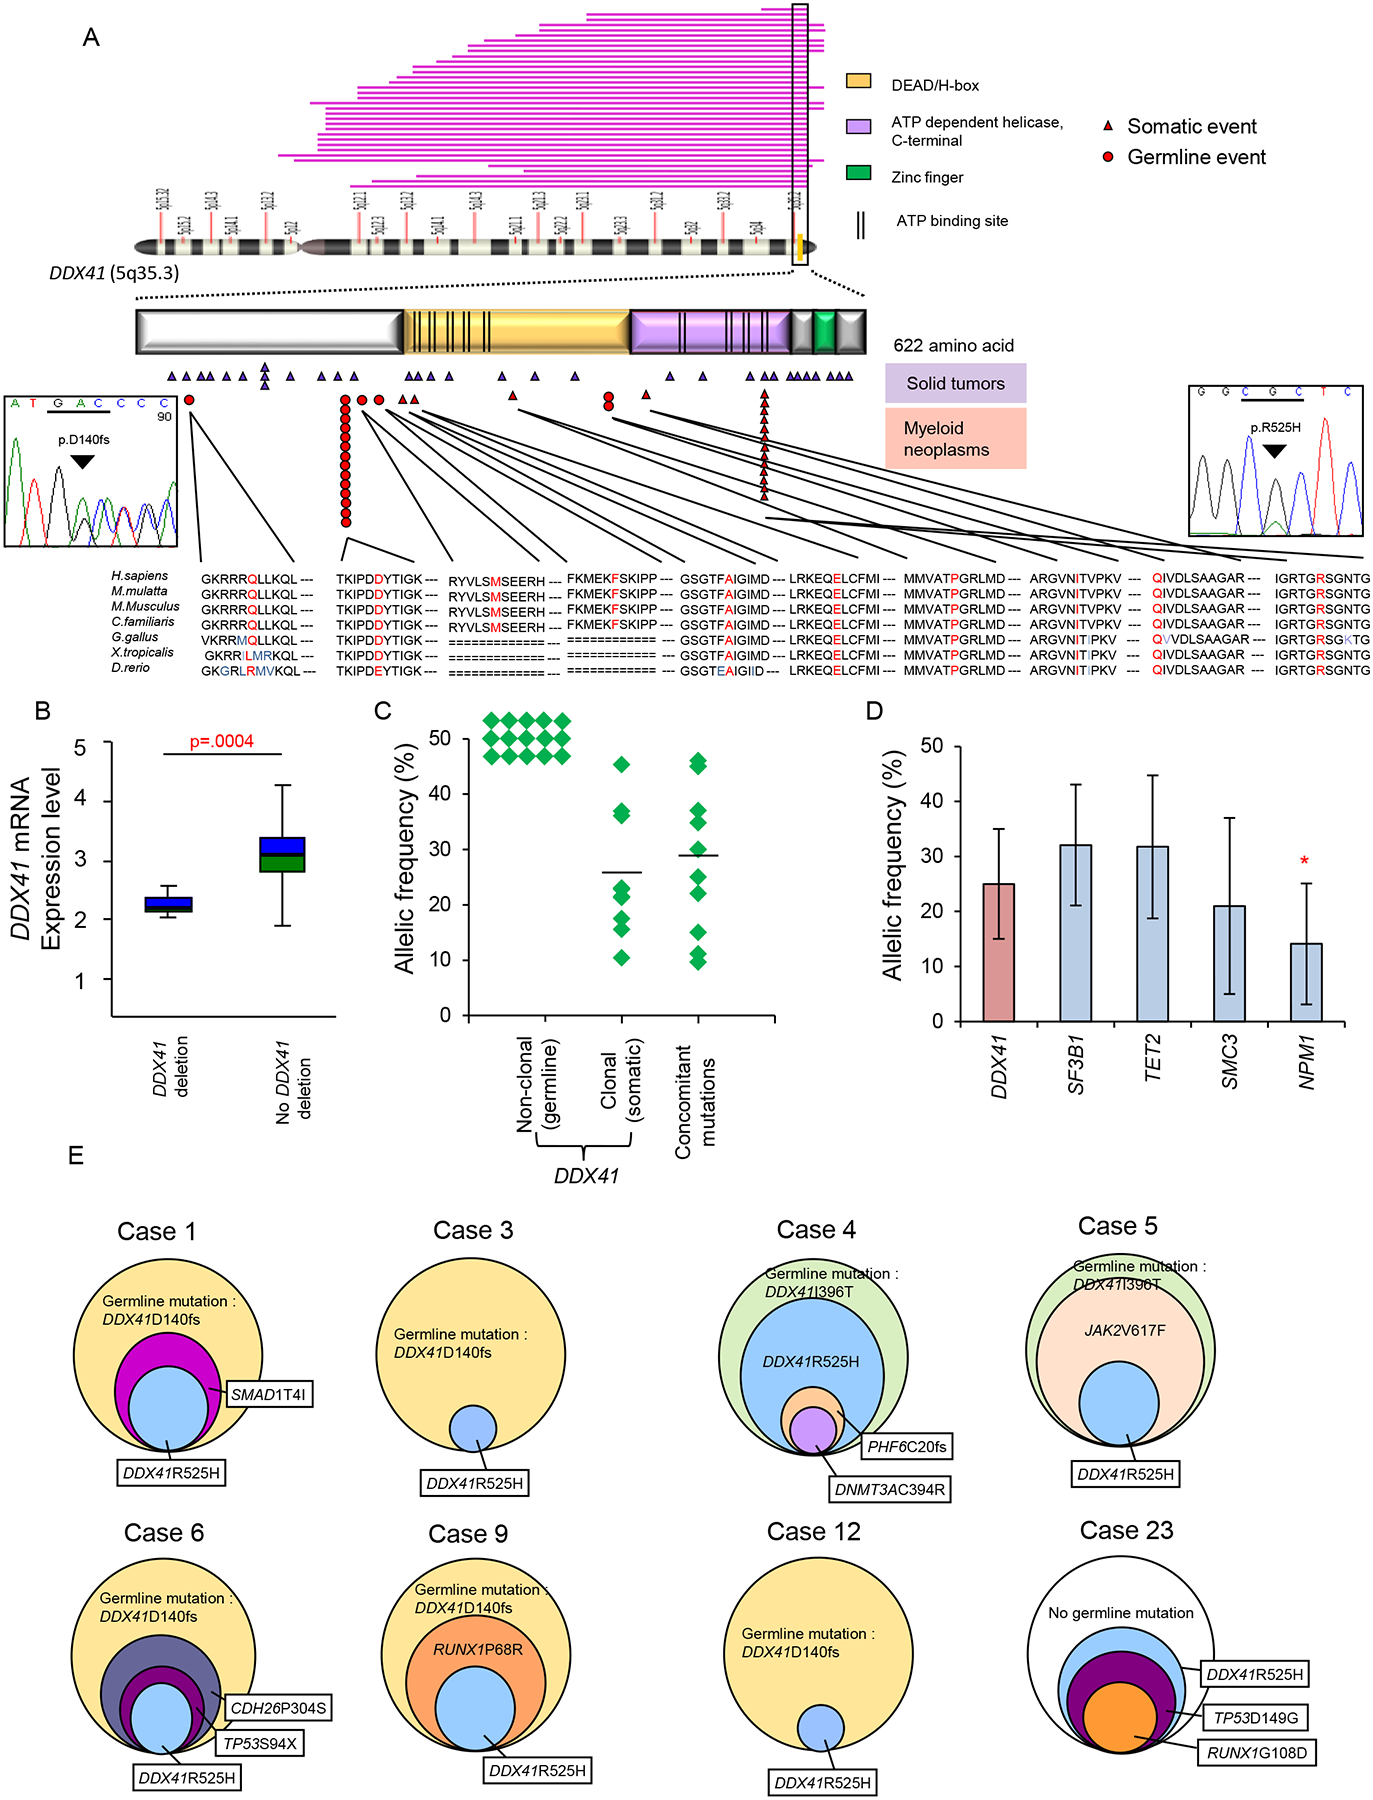
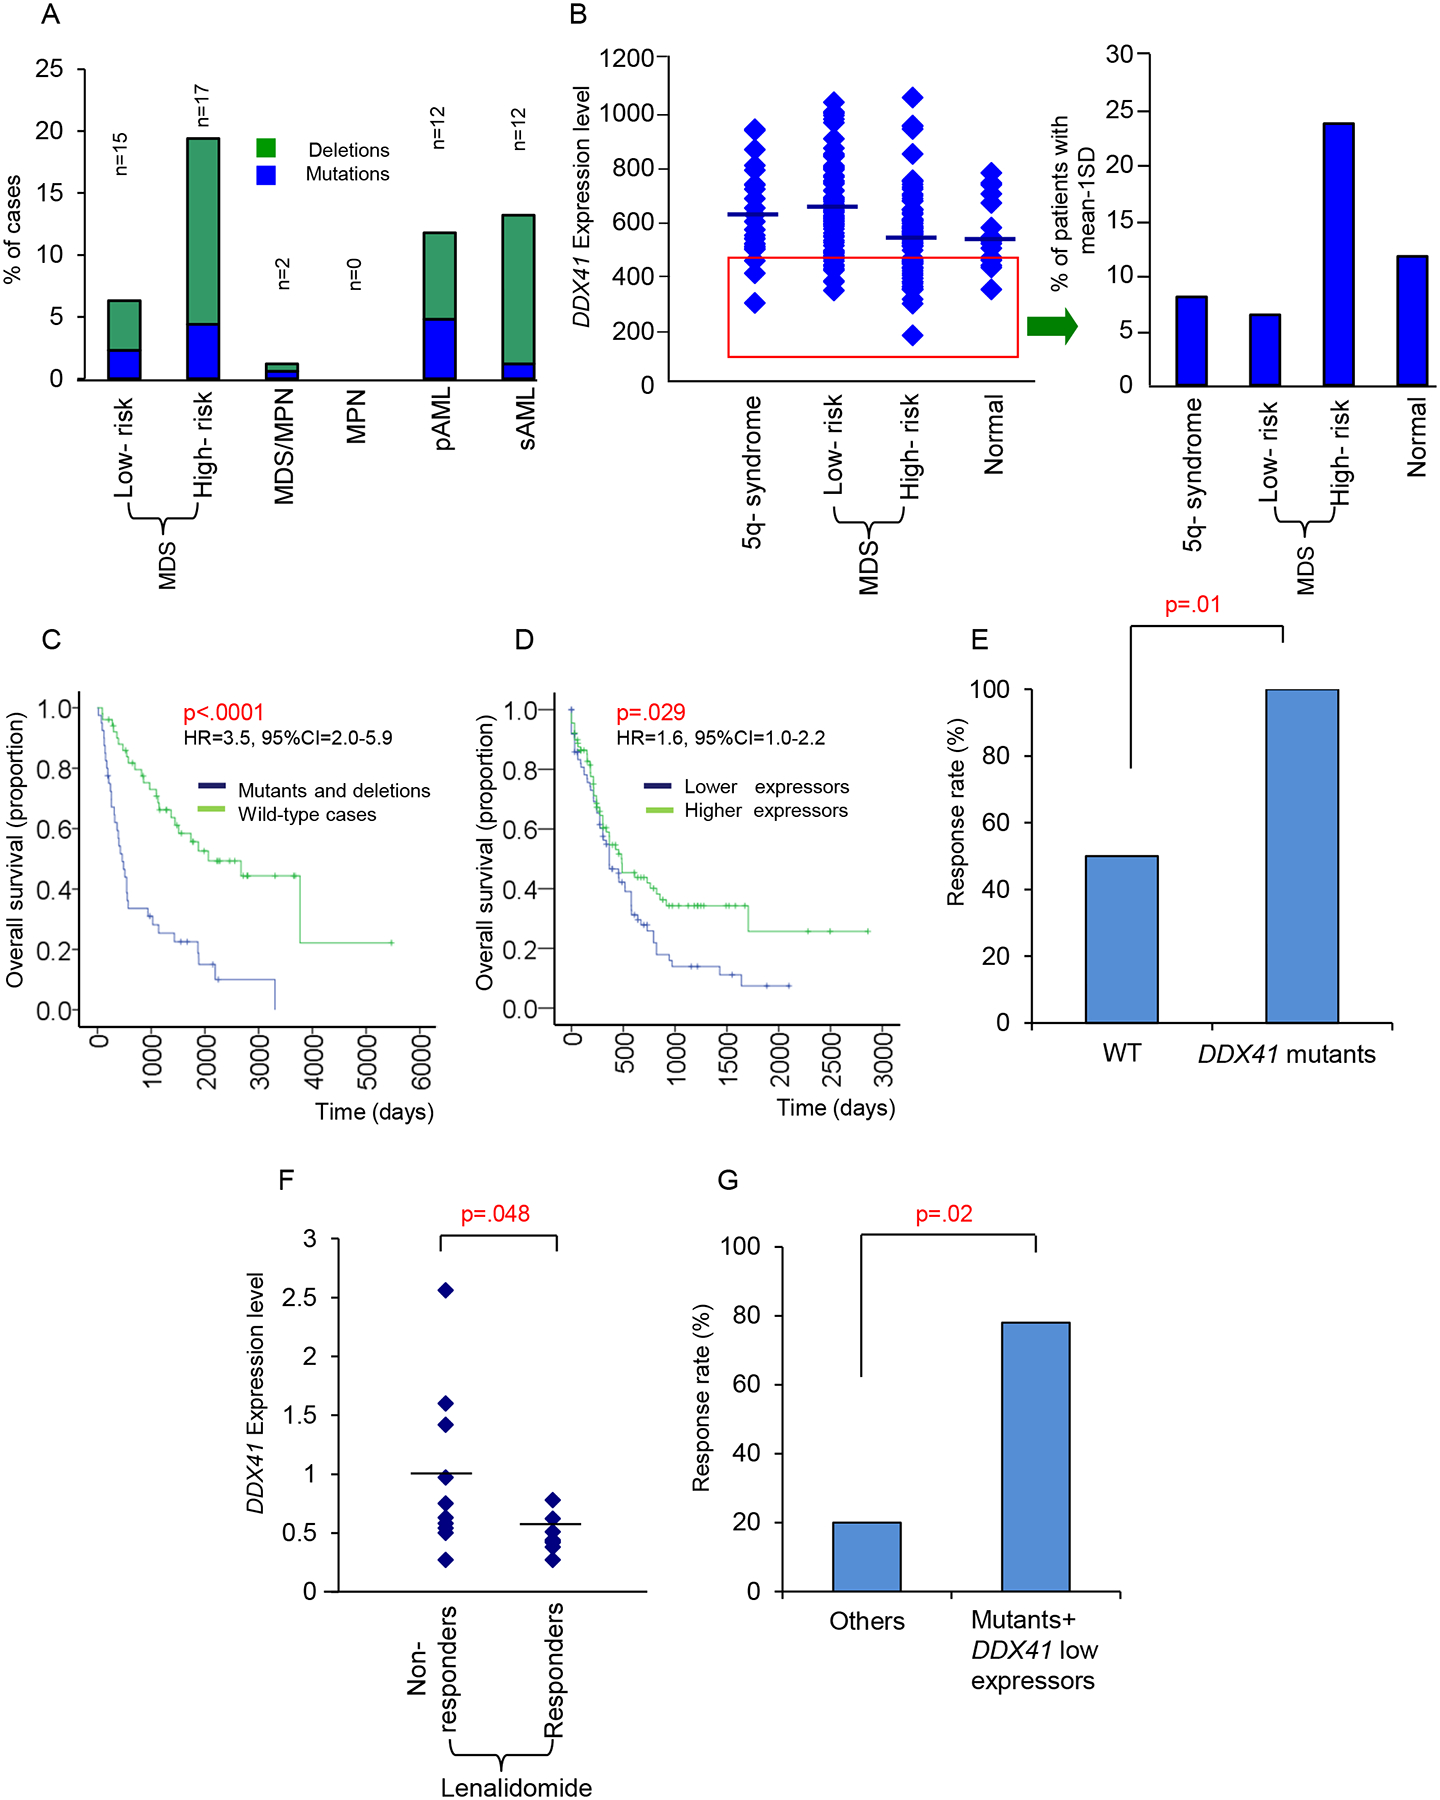
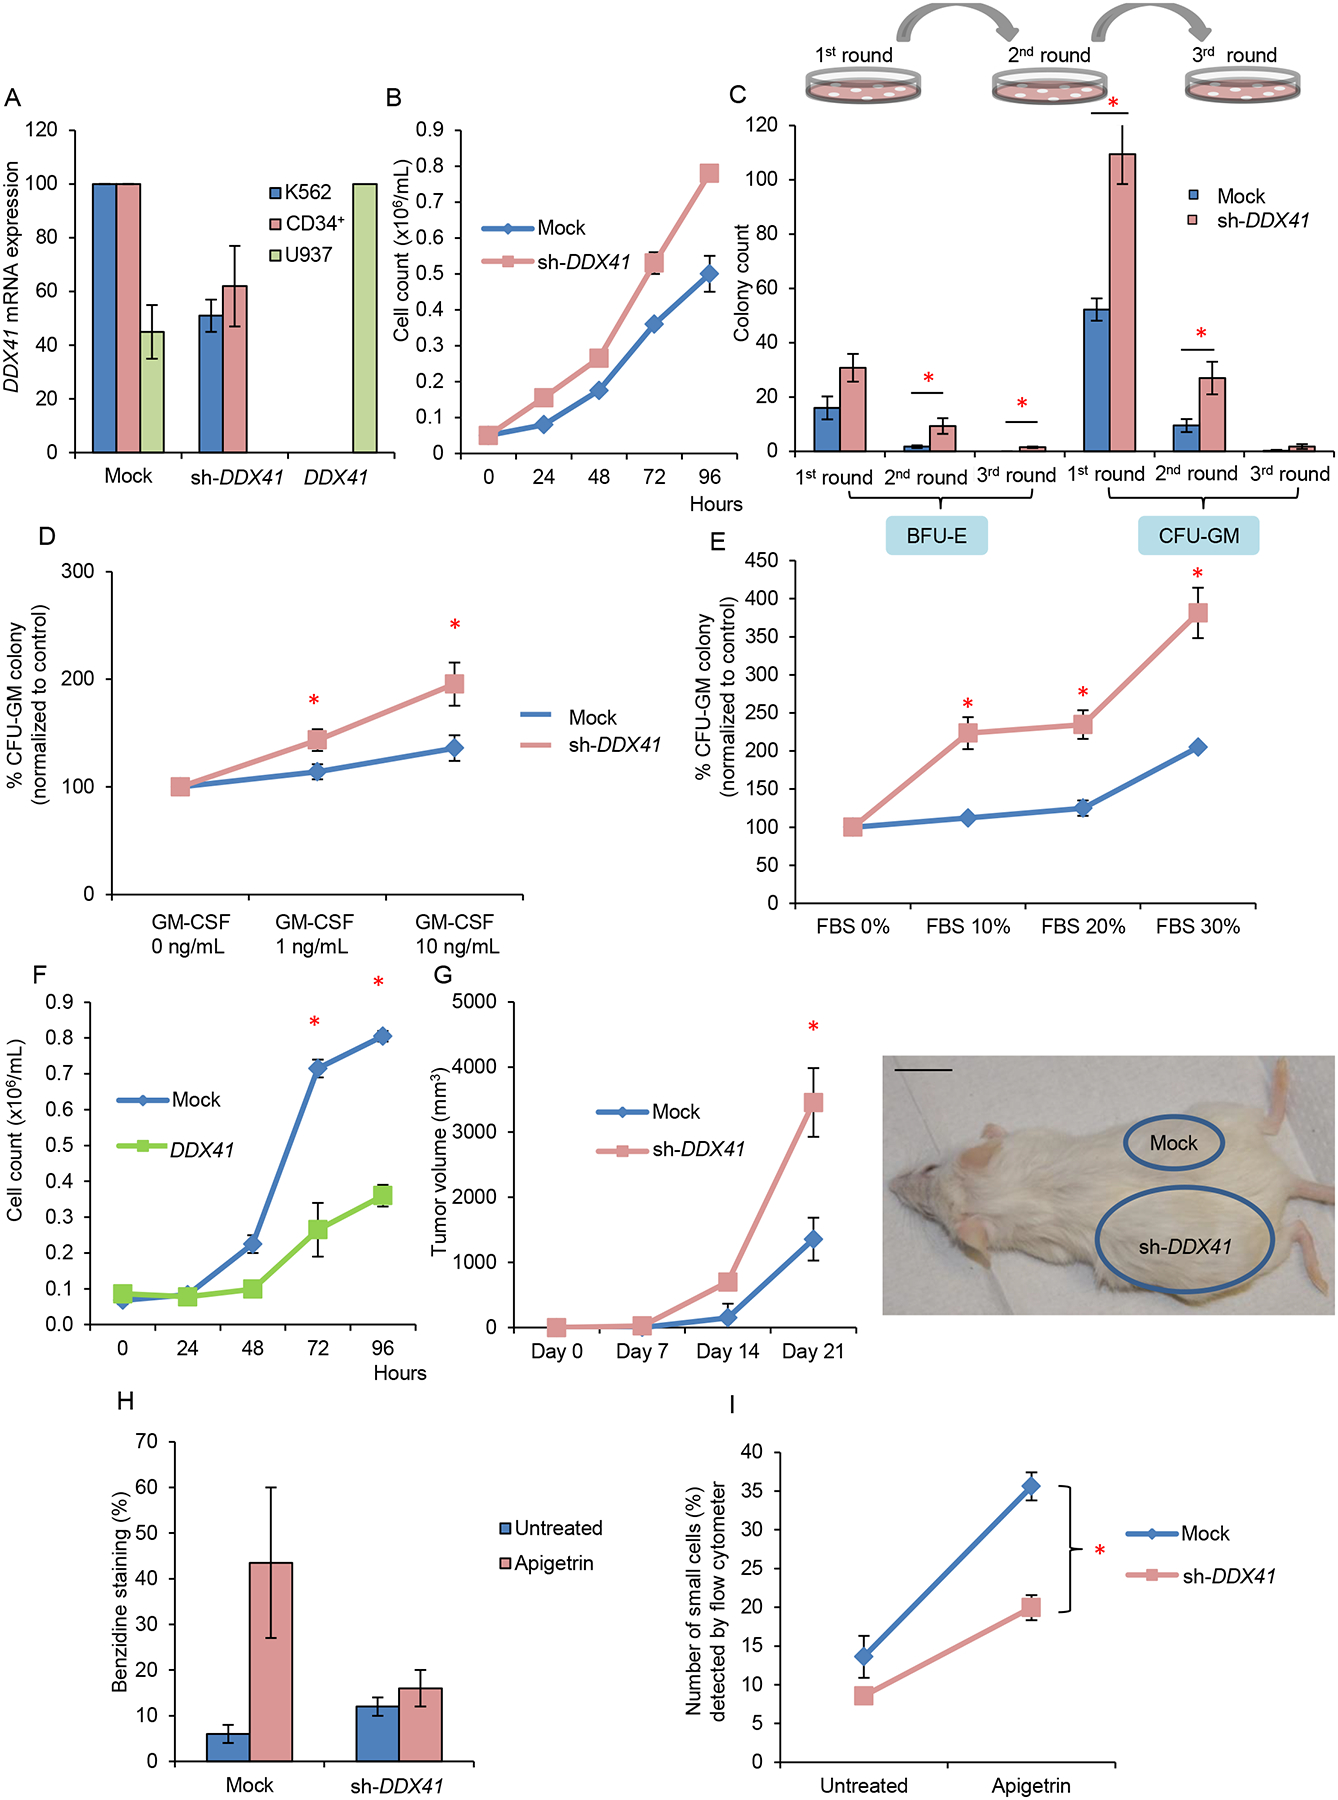
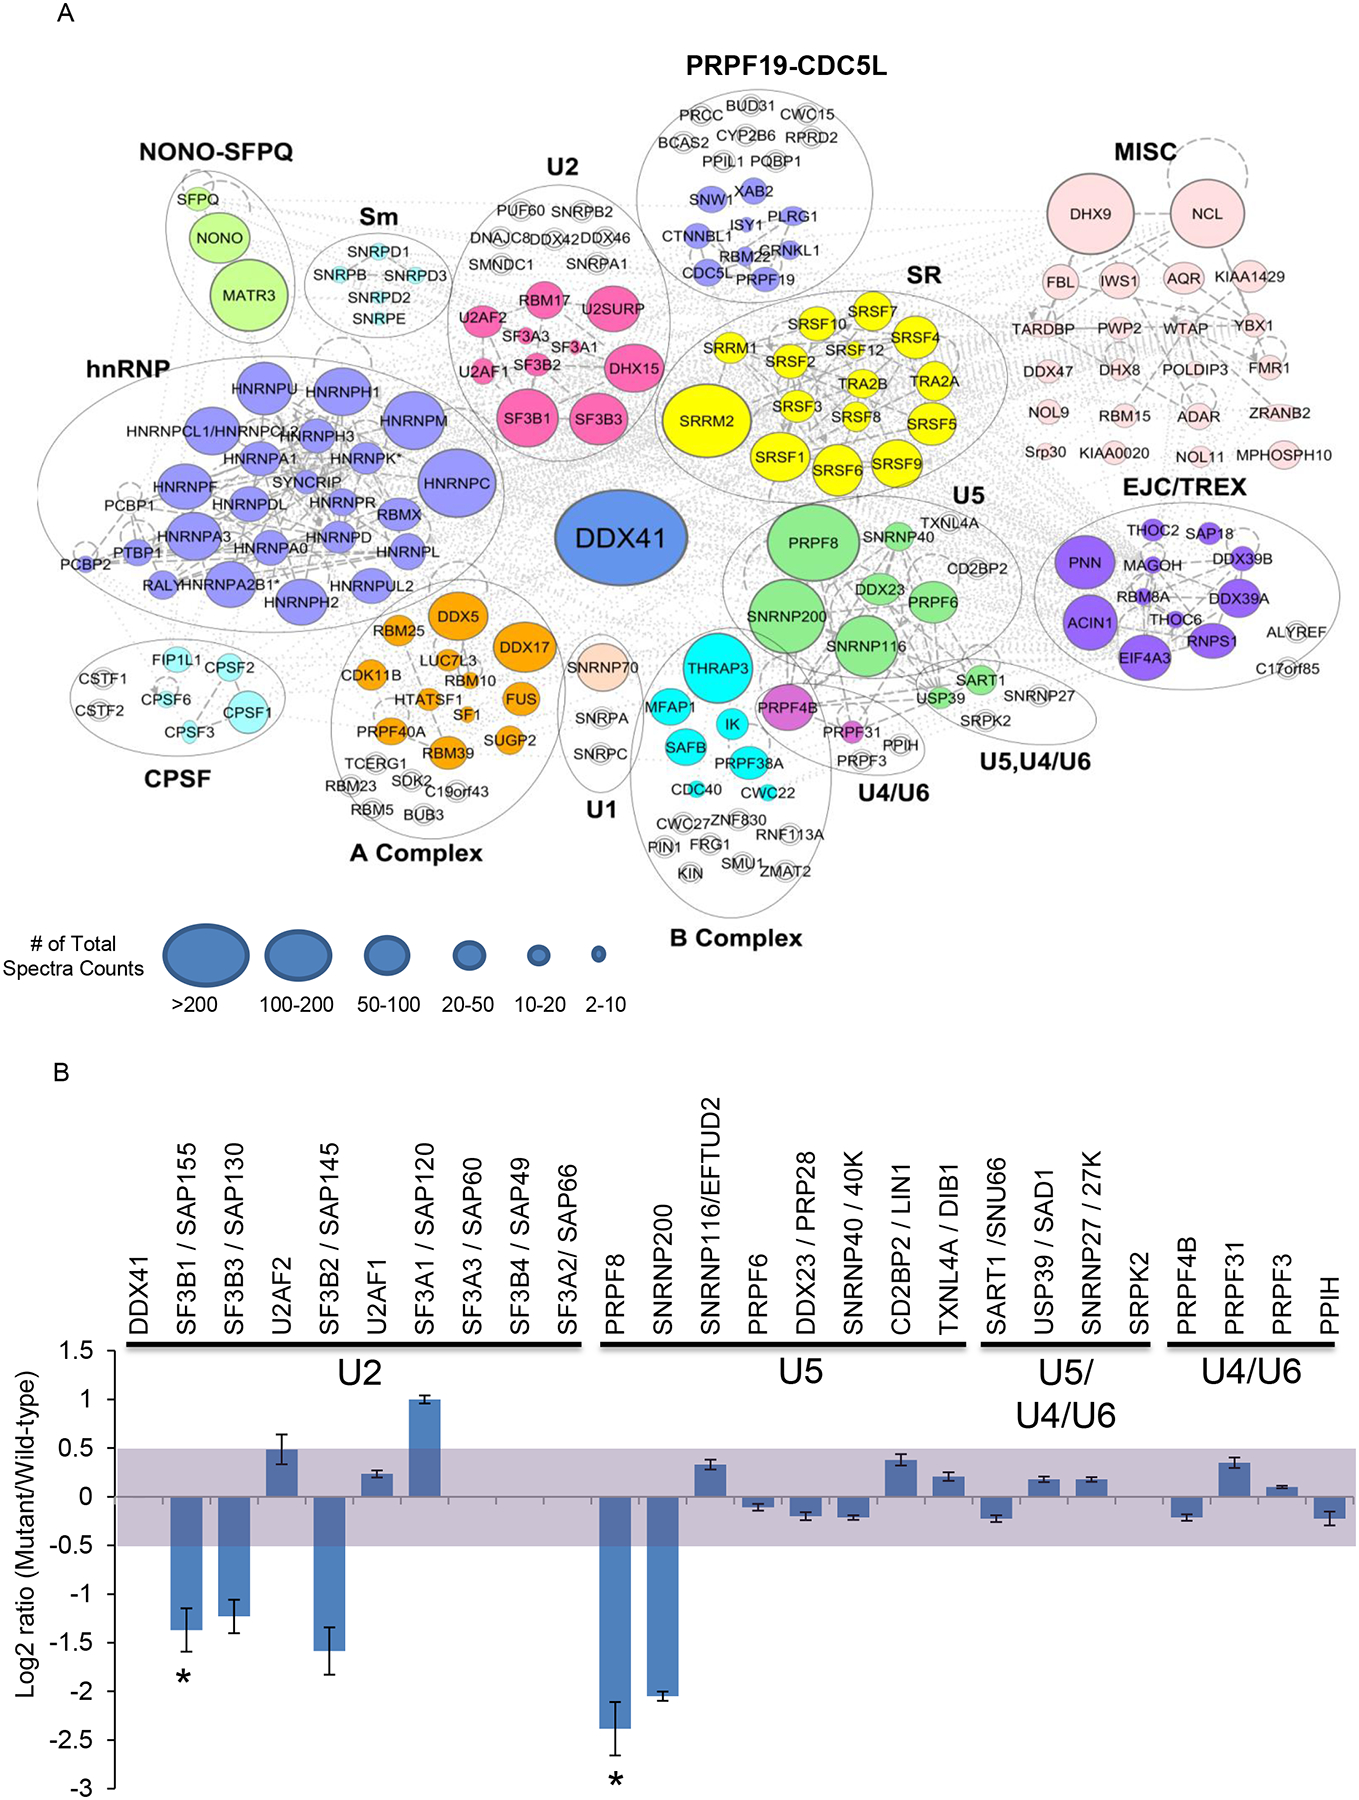
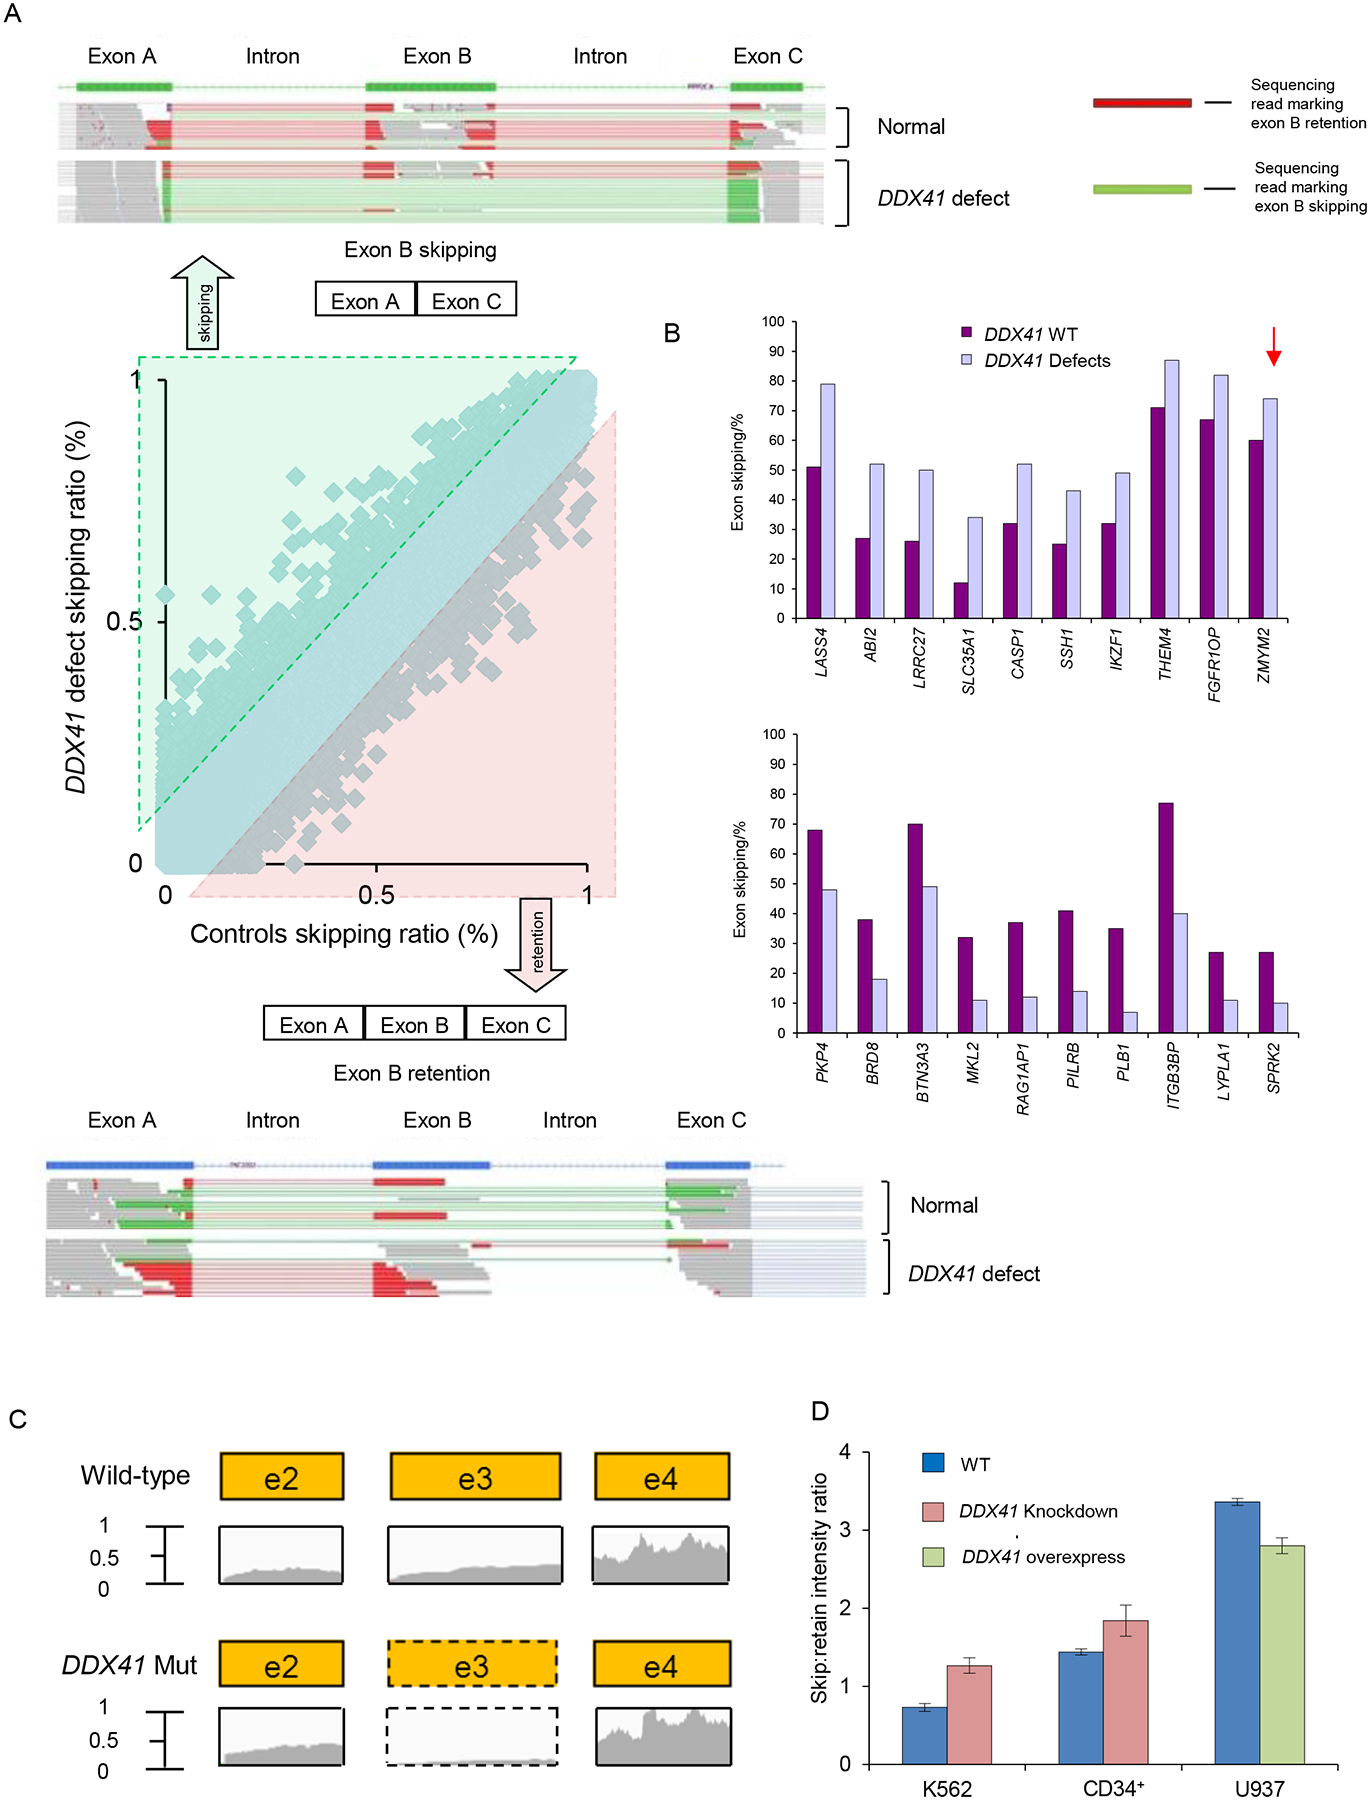
Most cases of adult myeloid neoplasms are routinely assumed to be sporadic. Here, we describe an adult familial acute myeloid leukemia (AML) syndrome caused by germline mutations in the DEAD/H-box helicase gene DDX41. DDX41 was also found to be affected by somatic mutations in sporadic cases of myeloid neoplasms as well as in a biallelic fashion in 50% of patients with germline DDX41 mutations. Moreover, corresponding deletions on 5q35.3 present in 6% of cases led to haploinsufficient DDX41 expression. DDX41 lesions caused altered pre-mRNA splicing and RNA processing. DDX41 is exemplary of other RNA helicase genes also affected by somatic mutations, suggesting that they constitute a family of tumor suppressor genes.


Figures

Figure 1:
Figure 1:. Germline and somatic mutations of three families with history of MDS and leukemia.
(A, B, C) Pedigrees of family 1 (A), family 2 (B), and family 3 (C) (upper panels). Age of diagnosis and detected DDX41 mutations are indicated. Lower panels show sequencing reads from whole exome sequencing (WES) with frequencies of detected mutations in bone marrow (BM) and germline samples. Confirmation of germline and somatic DDX41 mutations by Sanger sequencing is exemplarily shown for the family 2 (B). Arrows and bars indicated the specific nucleotide and predicted codon, respectively. Case number is annotated according to Table 1. Asymptomatic/presymptomatic carrier-clinically unaffected at this time but could later exhibit symptoms (Bennett et al., 2008) See also Figure S1
Figure 2:
Figure 2:. DDX41 gene structure and clonal architecture in DDX41 mutants.
(A) DDX41 is located at the distal end of chromosome 5q, 5q35.3, and encodes a protein that contains three known domains and ATP binding sites, as illustrated. The pink bars visualize deletions of chromosome 5q in our MDS cohort that include the DDX41 locus. The red triangles indicate DDX41 mutations in patients with hematological malignancies from our cohort and TCGA. Red circles indicate the identified germline mutations of DDX41 (p.Q52fs, p.D140fs, p.M155I and p.I396T). The p.R525H mutation was detected in 13 out of 1,045 cases. Purple triangles show DDX41 mutations in non-hematological malignancies. Sanger sequencing confirming recurrent germline mutation (p.D140fs; left) and somatic mutation (p.R525H; right) of DDX41 are shown. (B) DDX41 mRNA expression was analyzed by real-time RT-PCR in cases with deleted DDX41 locus compared with cases without deletion. Boxes represent 25–75 percentiles. A line inside a box represents median. Whiskers indicate maximum and minimum values. (C) For cases with DDX41 mutations, variant allelic frequencies (VAFs) of DDX41 mutations (germline and somatic) and concomitant mutations of other genes (somatic) are shown. Mean values of VAFs were compared between somatic DDX41 and concomitant mutations (Mean±SD: 25±10% and 29±14%, respectively; p>.05). (D) For cases in the whole examined cohort, VAFs of DDX41 mutations (Mean±SD: 25±10%) were compared to those of other genes affected by somatic mutations in myeloid neoplasms, including patients with DDX41 mutations. VAF is indicated as mean±SD. * indicates a p value of p=.004. (E) Clonal architecture of 8 cases with DDX41 mutations. The percentages represent allelic frequencies with 50% set as the largest circle; case 1: 50% of DDX41-D140fs (germline mutation), 25% of SMAD1-T4I and 21% of DDX41-R525H; case 3: 50% of DDX41-D140fs (germline mutation) and 12% of DDX41-R525H; case4: 50% of DDX41-I396T (germline mutation), 42% of DDX41-R525H, 15% of PHF6-C20fs and 14% of DNMT3A-C394R; case5: 50% of DDX41-I396T (germline mutation), 46% of JAK2-V617F and 37% of DDX41-R525H; case 6: 50% of DDX41-D140fs (germline mutation), 37% of CDH26-P304S, 22% of TP53-S94X and 20% of DDX41-R525H; case 9: 50% of DDX41-D140fs (germline mutation), 30% of RUNX1-P68R and 25% of DDX41-R525H; case 12: 50% of DDX41-D140fs (germline mutation) and 11% of DDX41-R525H; case 23: 36% of DDX41-R525H, 34.8% of TP53-D149G and 11.1% of RUNX1-G108D. (Case number is annotated according to Table1) See also Figure S3
Figure 3:
Figure 3:. Clinical impact of DDX41 deficiency in myeloid neoplasms.
(A) Patients with somatic DDX41 defects (mutations and deletions) in different types of myeloid neoplasms. Indicated is the percentage of patients of each cohort with DDX41 deletions and mutations. The absolute number of patients with alterations is shown on the top of each bar. (B) DDX41 mRNA levels in MDS patients with different subtypes. Reduced DDX41 expression was also demonstrated in various categories. Bars represent mean value. (C) Overall survival analysis in patients with DDX41 mutations or deletions compared with wild-type cases (HR=3.5, 95%CI=2.0–5.9, p<.0001). (D) Overall survival analysis in patients with low DDX41 mRNA expression compared with patients with higher expression (HR=1.6, 95%CI=1.0–2.2, p=.029). Cases with high and low DDX41 expression were dichotomized by the mean of relative mRNA transcription levels (mean=3.85 relative mRNA expression). (E) Response rate to lenalidomide in patients with DDX41 mutants (n=8/8) compared with wild-type cases (n=55/103). p=.01. (F) DDX41 mRNA expression in lenalidomide responders (n=9) compared with non-responders (n=10). Single square represent individual patients. Horizontal line indicates mean value. p=.048. (G) Response rate to lenalidomide treatment of patients with DDX41 mutations and/or low DDX41 expression (n=7/9) compared with others (n=2/10). See also Figure S4 and Table S2–S4
Figure 4:
Figure 4:. Biological consequences in DDX41 deficient cells.
(A) Expression level of DDX41 in leukemic cell lines K562 and U937 and primary CD34+ cells as determined by normalization to GAPDH upon knockdown or overexpression of DDX41. (B) Growth curves of K562 leukemic cells transduced with DDX41 knockdown construct (sh-DDX41) or mock-transduced. Doubling time of mock vs. sh-DDX41 = 29 hr. vs. 24 hr. (C) Colony forming assay comparing DDX41 deficient with control primary CD34+ cells. Numbers of plating are indicated. BFU-E burst forming unit-erythroid; CFU-GM colony forming unit-granulocyte/macrophage. (D) Percentage of CFU-GM colonies derived from plating of DDX41 deficient primary CD34+ cells in the absence or presence of different concentrations of GM-CSF in methylcellulose semisolid medium. (E) Percentage of CFU-GM colonies derived from plating of DDX41 deficient CD34+ primary cells with various concentrations of FBS. (F) Growth curves of U937 cells after lentiviral infection with a DDX41 expression construct compared to mock infected control cells. Doubling time of mock vs. DDX41 = 31 hr. vs. 36 hr. (G) K562 cells with decreased DDX41 expression were injected into the left flank and those with mock transduction were injected into the right flank of NSG mice. n=3 for each experiment. A representative image and quantification of tumor volume are shown. Three series of independent experiments were performed. Scale bar: 1 inch. (H) Hemoglobin detection of K562 cells with decreased DDX41 expression compared to those with mock transduction before and after exposure to apigetrin. Hemoglobin was measured by benzidine staining. (I) Percentage of small cell population (mature erythroid cells) as detected by flow cytometry in DDX41 knockdown K562 cells compared with control cells after exposure to apigetrin. Each bar/value represents the mean±SEM of 3 independent experiments performed in duplicates unless stated otherwise. * p<.05 See also Figure S5
Figure 5:
Figure 5:. Protein Interactions of DDX41 and splicing factors.
(A) DDX41 interactions with spliceosomal protein complexes are indicated. Spliceosomal proteins that coimmunoprecipitated with DDX41 were organized in colored functional protein complexes based on Ingenuity pathway analysis and published data (Hegele et al., 2012). Individual protein enrichment was presented as total spectral counts and displayed by different circle size. Increased circle size indicates higher number of total spectra counts for the protein. Total spectral count is a semi-quantitative method to predict abundance of a specific protein and is not used to compare with abundance of other proteins. Unfilled double ring symbols indicate proteins that were not identified in DDX41 co-immunoprecipitation experiments, but which have been linked to the spliceosome. (B) Summary of cataloging and quantification of protein interactions with wild-type and mutant DDX41. Protein names and their associated spliceosomal complex are shown on top of bars. Protein abundance was normalized to DDX41 and presented as ratio of mutant to wild-type in log2 scale. Light purple shading indicates no significant difference in protein interaction between wild-type and mutant DDX41 (log2 scale between 0.5 and −0.5). Standard deviation (+/−) was calculated based on the three strongest peak intensities used in the calculation. See also Figure S6/Table S5
Figure 6:
Figure 6:. Deep whole RNA sequencing showed splicing defects in DDX41 deficient cells.
(A) Increased exon skipping (top) and retention (bottom) in patients with DDX41 defects are indicated by an excess of green reads and red reads, respectively. The center panel shows a scatter plot of exon skipping in RNA isolated from control cells versus RNA from DDX41 defective mutant cells. Lines show the 10% difference cutoff limit used to select the most frequently affected exons. (B) Deep RNA sequencing was performed for blasts from patients with DDX41 mutations, deletions and wild-type to analyze altered splicing. The bar diagrams indicate the top 10 genes significantly more skipped in DDX41 defects (top) and in DDX41 wild-type (bottom). The arrow indicates the 13% difference of exon skipping in the ZMYM2 gene when comparing DDX41 defect and wild-type samples. (C) Exon 3 of ZMYM2 was skipped in DDX41 deficient cells as demonstrated by the read counts from deep sequencing. (D) RT-PCR was performed in K562 cells, CD34+ progenitors and U937 cells to evaluate ZMYM2 exon 3 skipping compared with controls. Depicted is the skip:retain intensity ratio for wild-type and DDX41 knockdown/overexpressing samples. Each bar represents the mean±SEM of 3 independent experiments. See also Figure S7/Table S6

Comment in

References

    1. Bantscheff M, Hopf C, Savitski MM, Dittmann A, Grandi P, Michon AM, Schleg J, Abraham Y, Becher I, Bergamini G,et al. (2011). Chemoproteomics profiling of HDAC inhibitors reveals selective targeting of HDAC complexes. Nat. Biotechnol 29, 255–265. - PubMed
    1. Bennett RL, Freanc KS, Resta RG, Doyle DL (2008). Standardized human pedigree nomenclature: update and assessment of the recommendations of the national society of genetic counselors. J. Genet. Counsel 17, 424–33. - PubMed
    1. Boultwood J, Pellagatti A, Cattan H, Lawrie CH, Giagounidis A, Malcovati L, Della Porta MG, Jädersten M, Killick S, Fidler C, et al. (2007). Gene expression profiling of CD34+ cells in patients with the 5q- syndrome. Br. J. Haematol 139, 578–589. - PubMed
    1. Cancer Genome atlas Research Network. (2013). Genomic and epigenomic landscapes of adult de novo acute myeloid leukemia. N. Engl. J. Med 368, 2059–2074. - PMC - PubMed
    1. Cordin O, Hahn D & Beggs JD (2012). Structure, function and regulation of spliceosomal RNA helicases. Curr. Opin. Cell Biol 24, 431–438. - PubMed

Publication types

Substances

Associated data