. 2015 May 5;21(5):764-776.
doi: 10.1016/j.cmet.2015.04.003. Epub 2015 Apr 23.

De Novo Reconstruction of Adipose Tissue Transcriptomes Reveals Long Non-coding RNA Regulators of Brown Adipocyte Development

Affiliations

De Novo Reconstruction of Adipose Tissue Transcriptomes Reveals Long Non-coding RNA Regulators of Brown Adipocyte Development

Juan R Alvarez-Dominguez et al. Cell Metab. .

Erratum in

  • Cell Metab. 2015 Jun 2;21(6):918

Abstract

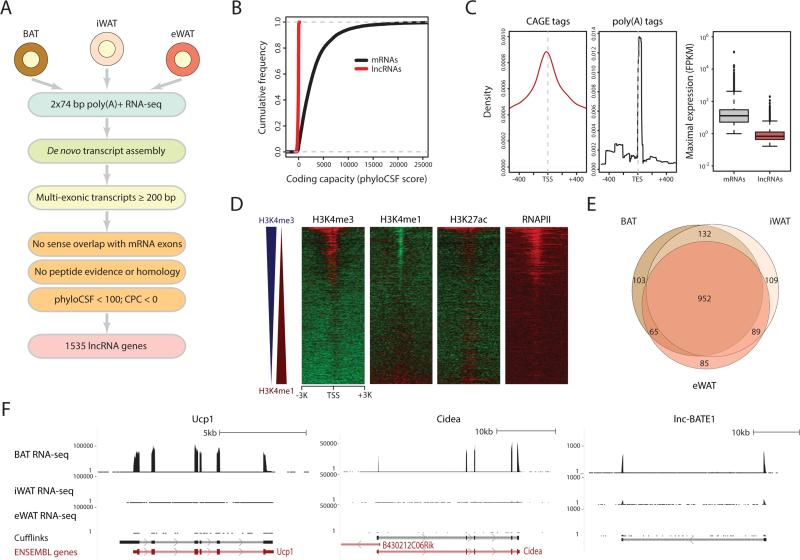
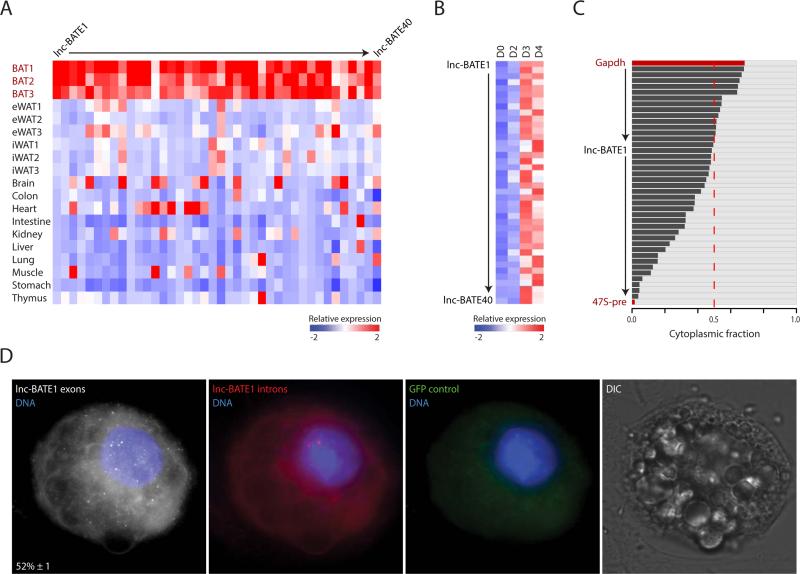
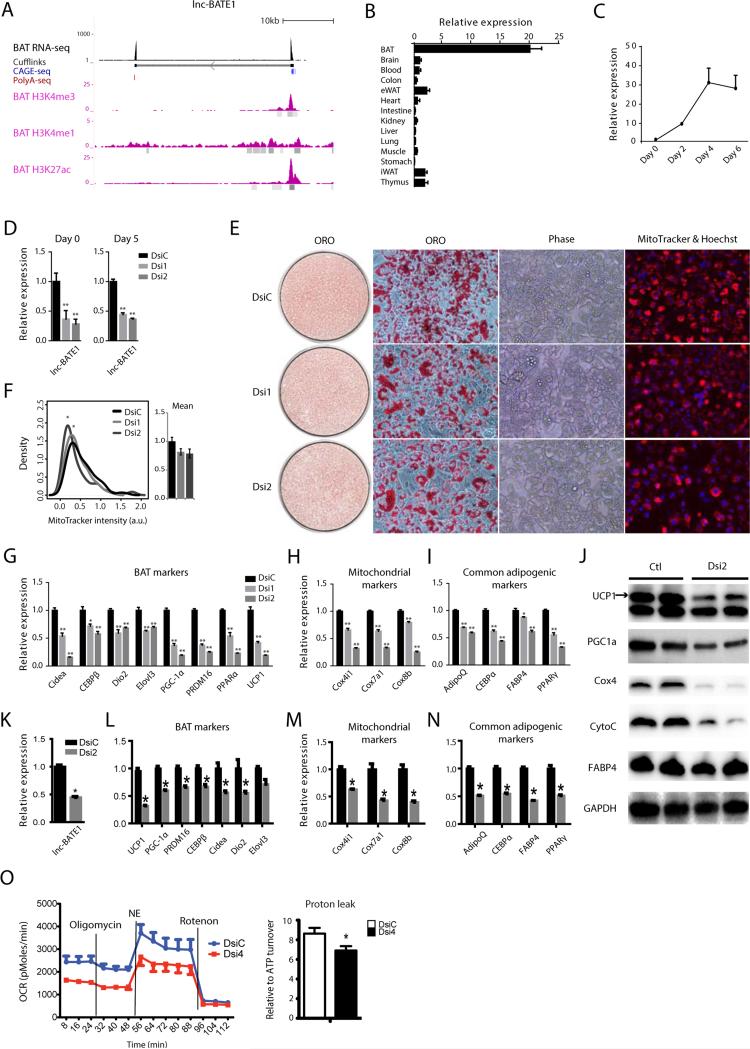
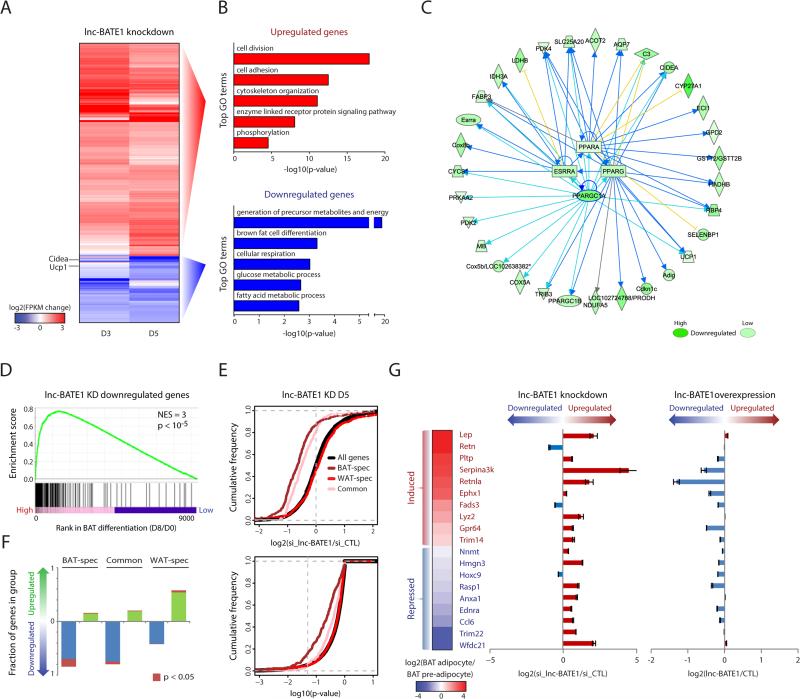
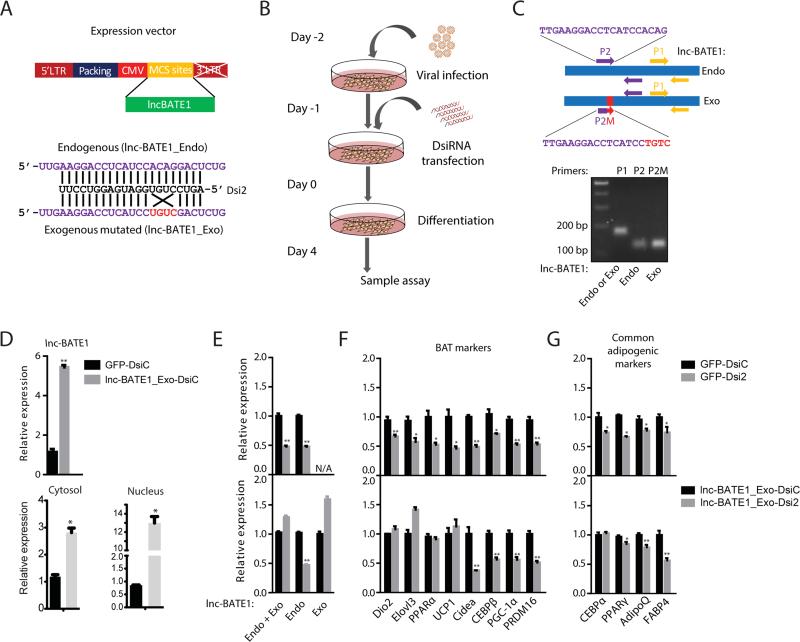
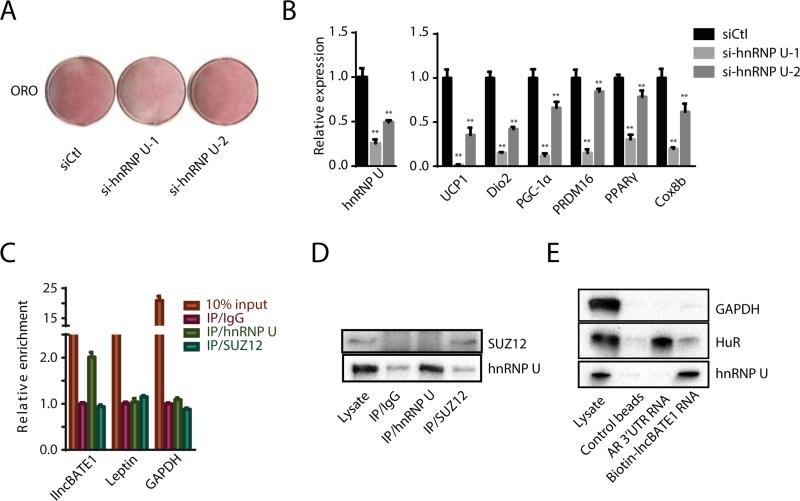
Brown adipose tissue (BAT) protects against obesity by promoting energy expenditure via uncoupled respiration. To uncover BAT-specific long non-coding RNAs (lncRNAs), we used RNA-seq to reconstruct de novo transcriptomes of mouse brown, inguinal white, and epididymal white fat and identified ∼1,500 lncRNAs, including 127 BAT-restricted loci induced during differentiation and often targeted by key regulators PPARγ, C/EBPα, and C/EBPβ. One of them, lnc-BATE1, is required for establishment and maintenance of BAT identity and thermogenic capacity. lnc-BATE1 inhibition impairs concurrent activation of brown fat and repression of white fat genes and is partially rescued by exogenous lnc-BATE1 with mutated siRNA-targeting sites, demonstrating a function in trans. We show that lnc-BATE1 binds heterogeneous nuclear ribonucleoprotein U and that both are required for brown adipogenesis. Our work provides an annotated catalog for the study of fat depot-selective lncRNAs and establishes lnc-BATE1 as a regulator of BAT development and physiology.


Figures

Figure 1
Figure 1. Global Discovery of Adipose Tissue lncRNAs
(A) lncRNA discovery pipeline. See text and Supplemental Experimental Procedures. (B) Coding capacity of adipose-expressed mRNAs and lncRNAs as estimated by phyloCSF (Lin et al., 2011). (C) Density of CAGE tags (left) and poly(A) tags (center) within 1kb of lncRNA transcription start sites (TSS) or end sites (TES), respectively. (Right) Box plots of maximal gene-level expression distributions for adipose-expressed mRNAs (maximal FPKM >1) and lncRNAs (maximal FPKM >0.1). (D) Evidence of histone marking, open chromatin, and RNA Pol II binding within TSS ±3kb regions of adipose- expressed lncRNAs. Color intensity represents the log2 signal enrichment over input. Heat maps are sorted by the difference in enrichment for H3K4me3 and H3K4me1, depicted by blue and red triangles to the left, respectively. (E) Overlap between lncRNAs detected (FPKM >0) in BAT, iWAT and eWAT. (F) Examples of BAT-restricted mRNAs and lncRNAs. Tracks depict RNA-seq signal for poly(A)+ RNA from BAT, iWAT and eWAT as density of mapped reads. Bottom tracks depict de novo transcript models by Cufflinks and Ensembl gene annotations. Left-to-right arrows indicate transcripts in the plus strand; right-to-left arrows indicate transcripts in the minus strand.
Figure 2
Figure 2. Adipose tissue-specific lncRNAs and their regulation
(A) Abundance of adipose-expressed mRNAs (13342) and lncRNAs (1535) across 30 tissues from ENCODE, based on our de novo gene models. Color intensity represents the fractional expression across all the tissues examined (see Supplemental Experimental Procedures). (B) Proportion of BAT-specific and eWAT-specific lncRNAs with promoter-proximal (TSS ±3kb) BAT- or eWAT-specific PPARγ binding (Rajakumari et al., 2013), as determined by peaks of ChIP-seq signal enrichment. ***p <0.001 (Kolmogorov-Smirnov test). (C) Examples of BAT- and eWAT-restricted lncRNAs showing BAT- or eWAT-specific PPARγ promoter-proximal binding, respectively. UCP1, a BAT-restricted mRNA locus targeted by PPARγ specifically in BAT, is shown for comparison. Tracks depict RNA-seq signal for poly(A)+ RNA from BAT and eWAT as density of mapped reads (black) and ChIP-seq signal for PPARγ binding in BAT and eWAT as density of processed signal enrichment (purple). Peaks of signal enrichment are shown in gray under the ChIP-seq tracks. Bottom tracks depict de novo transcript models by Cufflinks and Ensembl gene annotations as in Figure 1F. (D) Expression dynamics of BAT-specific and iWAT-specific lncRNAs during brown adipogenesis. Shown are abundance estimates (FPKM) from poly(A)+ RNA-seq of brown preadipocytes (D0) and cultured brown adipocytes (D8) (Sun et al., 2013), based on our de novo gene models. (E) Dynamic changes in promoter-proximal chromatin marking and transcription factor binding among BAT-specific lncRNAs during brown adipogenesis. Shown are changes in ChIP-signal for binding of C/EBPα, C/EBPβ, PPARγ, and RNA Pol II, as well as H3K27ac, H3K4me1, and H3K4me2 marking, between immortalized brown pre-adipocytes before (D0) and after (D2) adipogenic induction (Lee et al., 2013). Changes are log2 ratios of normalized read counts within TSS ±3kb regions.
Figure 3
Figure 3. Validation of BAT-selective lncRNAs
(A) Validation of 40 lncRNAs in BAT, eWAT and iWAT (n =3) and across 10 tissue samples by qPCR. Color intensity represents column mean-centered expression. (B) Induction of 40 BAT lncRNAs during brown adipogenesis. Expression values during a 4-day differentiation time course of cultured mouse pre-adipocytes were determined by qPCR (n =3). Color intensity represents row mean-centered expression. (C) Subcellular localization of 40 BAT lncRNAs. The relative proportion of cytoplasmic (black) and nuclear (gray) expression was assessed by qPCR (n =3). GAPDH mRNA and 47S pre-rRNA represent predominantly cytoplasmic and predominantly nuclear controls, respectively. Rows are sorted from highest to lowest cytoplasmic fraction. (D) Detection of lnc-BATE1 transcripts by single-molecule RNA FISH. Shown are maximum z-stack projections of fluorescence microscopy images. lncRNA molecules and DNA staining are pseudocolored as indicated. Shown at the bottom left panel corner for lnc-BATE1 exons is the mean ±SEM (n =2) percent of nuclear-localized transcripts. GFP control indicates background fluorescence measured in the GFP channel. DIC indicates imagining in the differential interference contrast channel.
Figure 4
Figure 4. lnc-BATE1 is required for brown adipocyte development, function, and maintenance
(A) lnc-BATE1 locus map. Track 1 depicts BAT poly(A)+ RNA-seq signal as density of mapped reads. Track 2 depicts de novo transcript models by Cufflinks. Tracks 3-4 display RNA 5’capping and 3’polyadenylation sites as evidenced by CAGE tags (blue) and poly(A) tags (red), respectively; only tags from the strand of transcription are shown. Tracks 5-7 display ENCODE BAT ChIP-seq signal from H3K4me3, H3K4me1 and H3K27ac marks, respectively, as density of processed signal enrichment; peaks of signal enrichment are shown in gray under each track. (B) Expression of lnc-BATE1 across 14 mouse tissues assessed by qPCR. (C) Expression of lnc-BATE1 during the course of brown adipogenesis in culture assessed by qPCR. (D) Expression of lnc-BATE1 in cultured brown adipocytes transfected with DsiRNA control (DsiC) or DsiRNAs targeting lnc-BATE1 (Dsi1 and Dsi2) and collected for qPCR at differentiation days 0 and 5. (E) Representative images of DsiRNA-treated cultured brown adipocytes at differentiation day 5 labelled with Oil red O (ORO, red) or MitoTracker® Deep Red FM (red) plus Hoechst (blue), respectively. (F) Quantification of integrated density signal of MitoTracker® fluorescence in individual cells from (E). Signal distributions are shown to the left and their mean values to the right. (G-I) Expression of BAT (G), mitochondrial (H), and common adipogenic markers (I) in DsiRNA-treated cultured day 5 brown adipocytes. (J) Protein levels of BAT, mitochondrial and common adipogenic markers assessed by western blot on cell lysates from DsiRNA-treated cultured day 5 brown adipocytes. (K-N) Knockdown of lnc-BATE1 in mature brown adipocytes 72h post-transfection with DsiRNAs (K) impairs expression of BAT (L), mitochondrial (M), and common adipogenic markers (N). (O) Representative metabolic flux curves from cultured DsiRNA-treated day 5 brown adipocytes treated with the adrenergic agent norepinephrine (NE) and 2% BSA. Oxygen consumption rates (OCR) are mean ±SEM. and are normalized by protein concentration. Error bars are mean ± SEM., n=3. *P ≤0.05, **P ≤0.01.
Figure 5
Figure 5. lnc-BATE1 mediates concurrent activation of the brown fat and suppression of the white fat gene programs
(A) Expression change of 1,014 mRNAs that are differentially expressed (P <0.05, DESeq) in cultured brown adipocytes upon lnc-BATE1 KD, collected at differentiation days 3 (D3) and 5 (D5). Changes are log2 expression (FPKM) ratios over control siRNA. (B) Top 5 non-redundant gene ontology (GO) biological process terms enriched (P <0.05, Fisher's test) among mRNA genes that show significantly higher (top) or lower (bottom) expression (P <0.05, DESeq) upon lnc-BATE1 KD relative to control. (C) Network diagram of top upstream transcription regulators whose inhibition best explains genes downregulated (P <0.05, DESeq) upon lnc-BATE1 KD, along with their known direct targets. Arrows and blocked lines indicate transcriptional activation and repression, respectively. Blue and yellow lines indicate whether the predicted inhibition of the upstream regulator is consistent or inconsistent with the state of the downstream molecule, respectively; gray lines generated no prediction. Highlighted blue lines emphasize PGC-1α relationships. (D) Gene set enrichment analysis for overlap between genes depleted upon lnc-BATE1 KD and the BAT differentiation gene signature published previously (Sun et al., 2013). NES, normalized enrichment score; p, empirical p-value. (E) Cumulative density distributions of expression changes (top) and p-values for these changes (bottom) for all expressed protein-coding genes and for BAT-specific, WAT-specific and common adipogenic genes in lnc-BATE1 siRNA-treated cultured day 5 brown adipocytes. Changes are log2 expression (FPKM) ratios relative to control siRNA. Vertical gray line denotes the P <0.05 significance threshold (bottom). (F) Proportion of BAT-specific, WAT-specific and common adipogenic genes that are upregulated (log2 expr. change vs. control >0) or downregulated (log2 expr. change vs. control <0) in lnc-BATE1 siRNA-treated cultured day 5 brown adipocytes. (G) lnc-BATE1 mediates repression of WAT marker genes. Expression change of select WAT markers during brown adipogenesis in culture, shown as the log2 expression ratio between brown adipocytes (Day 6) and pre-adipocytes (Day 0) (left). Expression change in cultured day 3 brown adipocytes transfected with siRNA targeting lnc-BATE1, relative to control siRNA (middle). Expression change in cultured day 5 white adipocytes expressing ectopic lnc-BATE1, relative to GFP control (right). Error bars are mean ±SEM., n ≥3.
Figure 6
Figure 6. Exogenous siRNA-resistant lnc-BATE1 partially rescues gene suppression in brown adipocytes depleted of endogenous lnc-BATE1
(A) Construction of exogenous siRNA-resistant lnc-BATE1 mutant (lnc-BATE1_Exo) from the endogenous transcript (lnc-BATE1_Endo). (B) Schematic illustration of procedure used for rescue experiments. (C) Design of qPCR primer pairs and agarose gel image of the resulting PCR products. Lane 2: lnc-BATE1_Endo or _Exo amplified by P1 primer pair; lane 3: lnc-BATE1_Endo amplified by P2 primer pair; lane 4: lnc-BATE1_Exo amplified by P2M primer pair. (D) Expression (top) and localization (bottom) of total lnc-BATE1 in brown adipocytes infected with GFP control viruses or with lnc-BATE1_Exo viruses prior to transfection with control DsiRNA (DsiC). (E-G) Expression of endogenous or exogenous lnc-BATE1 (E), brown adipocyte markers (F) and general adipogenic markers (G) in brown adipocytes infected with GFP control virus or with lnc-BATE1_Exo virus prior to transfection with control DsiRNA (DsiC) or lnc-BATE1 DsiRNA (Dsi2). Error bars are SEM., n =3. *P ≤0.05, **P ≤0.01.
Figure 7
Figure 7. lnc-BATE1 interacts with hnRNP U, which is required for brown adipocyte differentiation
(A) Oil red O staining of brown adipocytes differentiated in culture upon siRNA-mediated hnRNP U KD. (B) Expression of hnRNP U and marker genes in cultured brown adipocytes following hnRNP U KD, quantified by qPCR. (C-D) Association between endogenous lnc-BATE1 and hnRNP U in the nucleus of cultured brown adipocytes. RNA immunoprecipitation (RIP) enrichment was assessed as RNA associated to hnRNP U or Suz12 relative to IgG control by qPCR (C) or Western blot (D). (E) lnc-BATE1 and hnRNP U specifically interact in vitro. Western blots for biotin-RNA pull-down show specific interaction between lnc-BATE1 and hnRNP U but not GAPDH or HuR protein, which specifically interacts with androgen receptor (AR) 3’UTR RNA. Error bars are SEM., n =3. *P ≤0.05, **P ≤0.01.

References

    1. Alvarez-Dominguez JR, Hu W, Gromatzky AA, Lodish HF. Long noncoding RNAs during normal and malignant hematopoiesis. International journal of hematology. 2014a;99:531–541. - PMC - PubMed
    1. Alvarez-Dominguez JR, Hu W, Yuan B, Shi J, Park SS, Gromatzky AA, van Oudenaarden A, Lodish HF. Global discovery of erythroid long noncoding RNAs reveals novel regulators of red cell maturation. Blood. 2014b;123:570–581. - PMC - PubMed
    1. Bostrom P, Wu J, Jedrychowski MP, Korde A, Ye L, Lo JC, Rasbach KA, Bostrom EA, Choi JH, Long JZ, et al. A PGC1-alpha-dependent myokine that drives brown-fat-like development of white fat and thermogenesis. Nature. 2012;481:463–468. - PMC - PubMed
    1. Cabili MN, Trapnell C, Goff L, Koziol M, Tazon-Vega B, Regev A, Rinn JL. Integrative annotation of human large intergenic noncoding RNAs reveals global properties and specific subclasses. Genes Dev. 2011;25:1915–1927. - PMC - PubMed
    1. Chen Y, Siegel F, Kipschull S, Haas B, Frohlich H, Meister G, Pfeifer A. miR-155 regulates differentiation of brown and beige adipocytes via a bistable circuit. Nat Commun. 2013;4:1769. - PMC - PubMed

Publication types

Substances

Associated data