. 2015 Jun:97:27-34.
doi: 10.1016/j.plefa.2015.03.002. Epub 2015 Apr 11.

Docosahexaenoic acid differentially affects TNFα and IL-6 expression in LPS-stimulated RAW 264.7 murine macrophages

Affiliations

Docosahexaenoic acid differentially affects TNFα and IL-6 expression in LPS-stimulated RAW 264.7 murine macrophages

Kaori L Honda et al. Prostaglandins Leukot Essent Fatty Acids. 2015 Jun.

Abstract

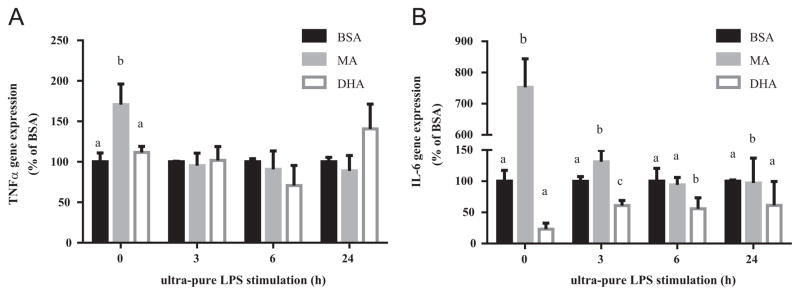
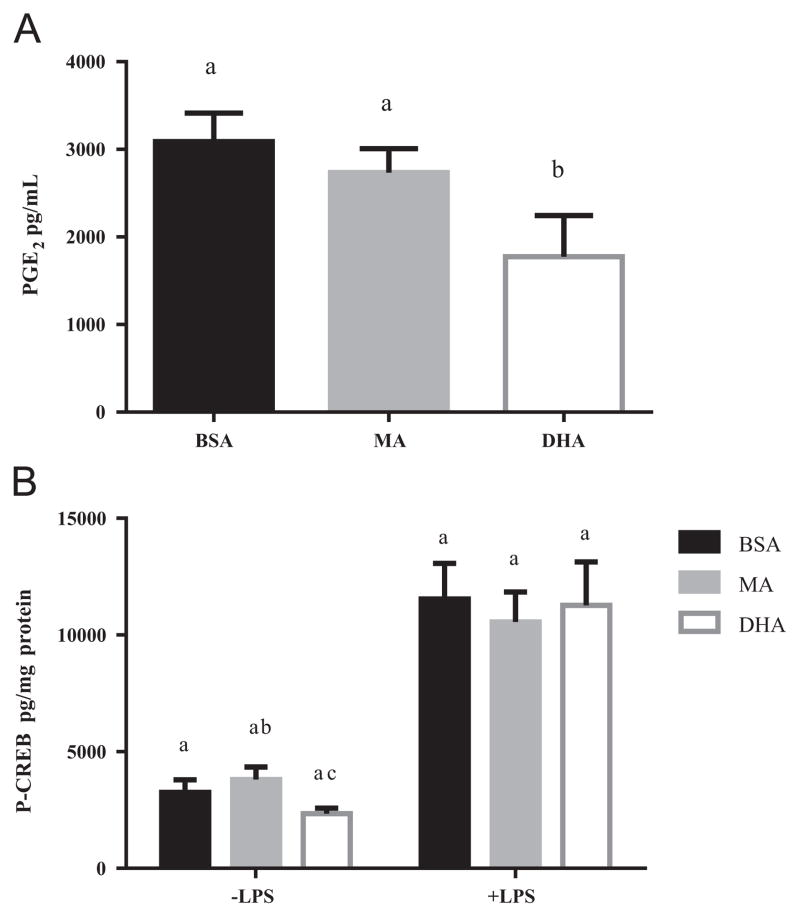
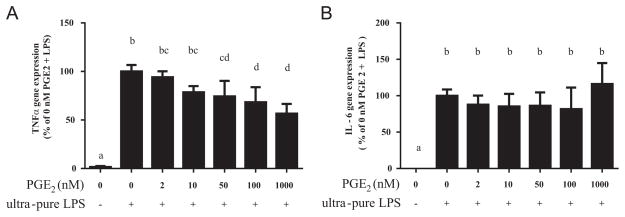
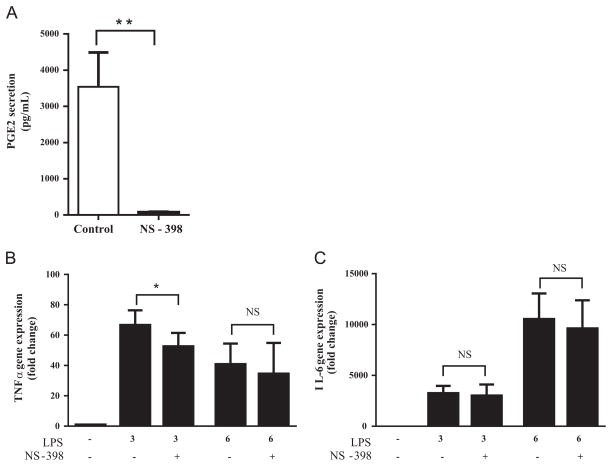
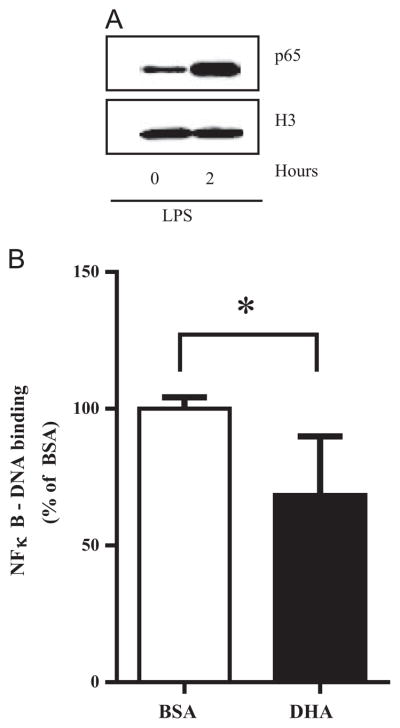
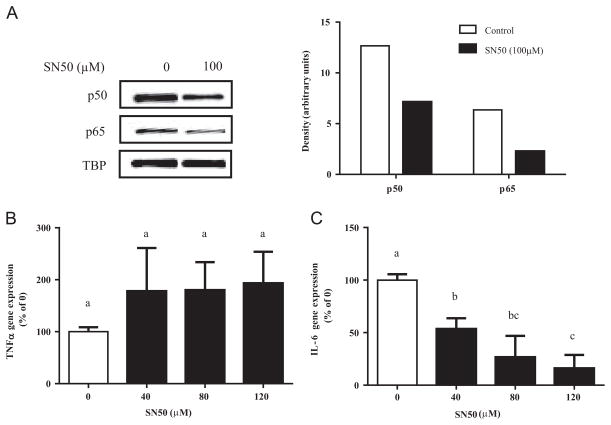
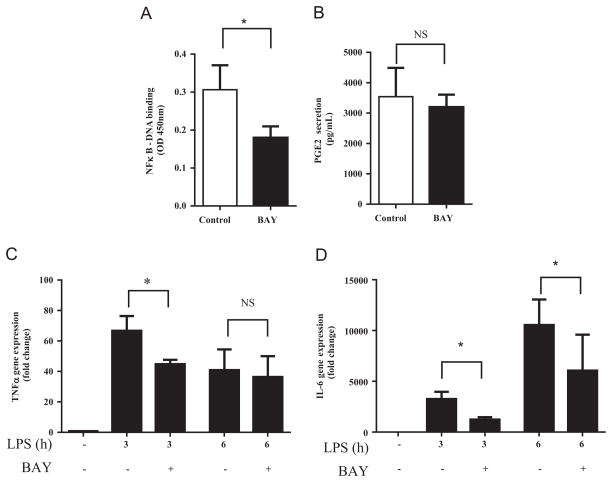
Docosahexaenoic acid (DHA) is generally reported to have anti-inflammatory properties, however, prior work has documented differential effects on individual pro-inflammatory cytokines: reduced IL-6, but not TNFα, mRNA expression in macrophages. To elucidate the mechanism, the roles of prostaglandin E2 (PGE2), cyclic AMP response element-binding protein (CREB), and NFκB were examined in RAW 264.7 macrophages. DHA did not influence CREB activity, but significantly reduced PGE2 production by 41% and NFκB activity by 32%. Exogenous PGE2 inhibited TNFα mRNA expression dose dependently. Unexpectedly, inhibiting PGE2 production with NS-398 also decreased TNFα mRNA expression, suggesting a concentration-dependent dual role of PGE2 in regulating TNFα expression. IL-6 expression was unaffected by endogenous or exogenous PGE2. Partial block of NFκB activation (SN50; 46%, or, BAY-11-7082; 41%) lowered IL-6 to a greater extent than TNFα mRNA expression. The differential effect of DHA on TNFα and IL-6 mRNA expression may be mediated via reduction in NFκB activity.

Keywords: CREB; IL-6; Macrophages; PGE(2); TLR4; TNFα.


Figures

Fig. 1
Fig. 1
Effect of fatty acid on TNFα (A) and IL-6 (B) gene expression. RAW 264.7 cells were pretreated with DHA or MA (100 μM, 24 h) then stimulated with ultra-pure LPS (100 ng/mL) in the presence of treatment fatty acid for the times indicated. Bars without common letters within the same time group statistically differ at P<0.05 determined by one-way ANOVA, adjusted with Tukey’s post-hoc test for multiple comparisons. Values are mean±SD of three independent experiments.
Fig. 2
Fig. 2
Effect of fatty acid on PGE2 secretion and CREB activity in RAW 264.7 cells. (A) Cells were pretreated with MA or DHA (100 μM, 24 h) and then stimulated with ultra-pure LPS (100 ng/mL, 6 h). PGE2 concentration in culture supernatant was determined by ELISA. Values are mean±SD of three independent experiments. Bars without common letters statistically differ at P<0.05 determined by one-way ANOVA adjusted with Tukey’s post-hoc test for multiple comparisons. (B) Cells were pretreated with MA or DHA (100 μM, 24 h) and then stimulated with ultra-pure LPS (100 ng/mL, 30 min). P-CREB concentration in whole cell lysates was determined by ELISA. Values are mean±SD of four independent experiments. Bars without common letters within each group statistically differ at P<0.05 determined by two-way repeated measures ANOVA adjusted with Sidak’s post-hoc test for multiple comparisons.
Fig. 3
Fig. 3
Effect of exogenous PGE2 on (A) TNFα and (B) IL-6 gene expression. RAW 264.7 cells were incubated with exogenous PGE2 at the concentrations indicated for 45 min, and then stimulated with ultra-pure LPS (100 ng/mL, 3 h). Bars without common letters statistically differ at P<0.05 determined by one-way ANOVA, adjusted with Tukey’s post-hoc test for multiple comparisons. Values are mean±SD of four independent experiments.
Fig. 4
Fig. 4
Effect of NS-398 on (A) PGE2 secretion, (B) TNFα, and (C) IL-6 gene expression. RAW 264.7 cells were pretreated with NS-398 (10 μM, 18 h) and then stimulated with ultra-pure LPS (100 ng/mL). (A) PGE2 in culture supernatant was determined by ELISA after 6 h of ultra-pure LPS stimulation. **P <0.01 vs. control determined by unpaired Student t test. (B) TNFα and (C) IL-6 gene expression were determined after 3 or 6 h of ultra-pure LPS stimulation. Values are mean±SD of three independent experiments. *P<0.05 determined by two-way repeated measures ANOVA adjusted by Sidak’s test for multiple comparisons. Values are mean±SD of three independent experiments.
Fig. 5
Fig. 5
NFκB activity in RAW 264.7 cells. (A) Western blot of nuclear p65 protein expression before and after 2 h of ultra-pure LPS stimulation relative to histone 3 (H3) protein expression (nuclear protein loading control). One representative experiment is shown out of 3 independent experiments that had similar results. (B) Cells were pretreated with DHA (100 μM, 24 h), then stimulated with ultra-pure LPS (100 ng/mL, 30 min). NFκB-DNA binding in nuclear extracts was determined by ELISA. Values are mean±SD of five independent experiments. *P<0.05 determined by Student t test.
Fig. 6
Fig. 6
Effect of SN50 in RAW 264.7 cells. Cells were pretreated with SN50 (100 μM, 15 min) and then stimulated with ultra-pure LPS (100 ng/mL). (A) After 30 min of stimulation, nuclear protein expression of p50 and p65 were determined by western blot. TBP (TATA-binding protein) was used as a nuclear protein loading control. Values are mean of two independent samples of one experiment. (B) TNFα and (C) IL-6 mRNA expression after 3 h of stimulation was determined by RT-PCR. Values are mean±SD of three independent experiments. Bars without common letters statistically differ at P<0.05 determined by one-way ANOVA, adjusted with Tukey’s post-hoc test for multiple comparisons.
Fig. 7
Fig. 7
Effect of BAY on inflammatory response of RAW 264.7 cells. Cells were pretreated with BAY (10 μM, 18 h) then stimulated with ultra-pure LPS (100 ng/mL). (A) NFκB-DNA binding determined by ELISA. Values are mean of triplicate samples of one experiment. (B) PGE2 in culture supernatant was determined after 6 h of ultra-pure LPS stimulation. (C) TNFα and (D) IL-6 gene expression were determined after 3 or 6 h of stimulation. Values are mean±SD of three independent experiments. *P≤0.05 determined by two-way repeated measures ANOVA adjusted with Sidak’s post-hoc test for multiple comparisons.

References

    1. Calder PC. Long-chain fatty acids and inflammation. Proc Nutr Soc. 2012;71:284–289. - PubMed
    1. Honda KL, Lamon-Fava S, Matthan NR, Wu D, Lichtenstein AH. EPA and DHA exposure alters the inflammatory response but not the surface expression of toll-like receptor 4 in macrophages. Lipids. 2015;50:121–129. - PMC - PubMed
    1. Calder PC, Ahluwalia N, Albers R, et al. A consideration of biomarkers to be used for evaluation of inflammation in human nutritional studies. Br J Nutr. 2013;109(Suppl 1):S1–S34. - PubMed
    1. Branen L, Hovgaard L, Nitulescu M, Bengtsson E, Nilsson J, Jovinge S. Inhibition of tumor necrosis factor-alpha reduces atherosclerosis in apolipo-protein E knockout mice. Arterioscler Thromb Vasc Biol. 2004;24:2137–2142. - PubMed
    1. Sun Y, Yin M, Zhang L, Pan J. Characterization of the cytokine expression profiles of the aorta and liver of young tumor necrosis factor alpha mutant mice. Mol Cell Biochem. 2012;366:59–67. - PubMed

Publication types

MeSH terms