. 2016 Jan;9(1):24-37.
doi: 10.1038/mi.2015.33. Epub 2015 Apr 29.

Gut dendritic cell activation links an altered colonic microbiome to mucosal and systemic T-cell activation in untreated HIV-1 infection

Affiliations

Gut dendritic cell activation links an altered colonic microbiome to mucosal and systemic T-cell activation in untreated HIV-1 infection

S M Dillon et al. Mucosal Immunol. 2016 Jan.

Abstract

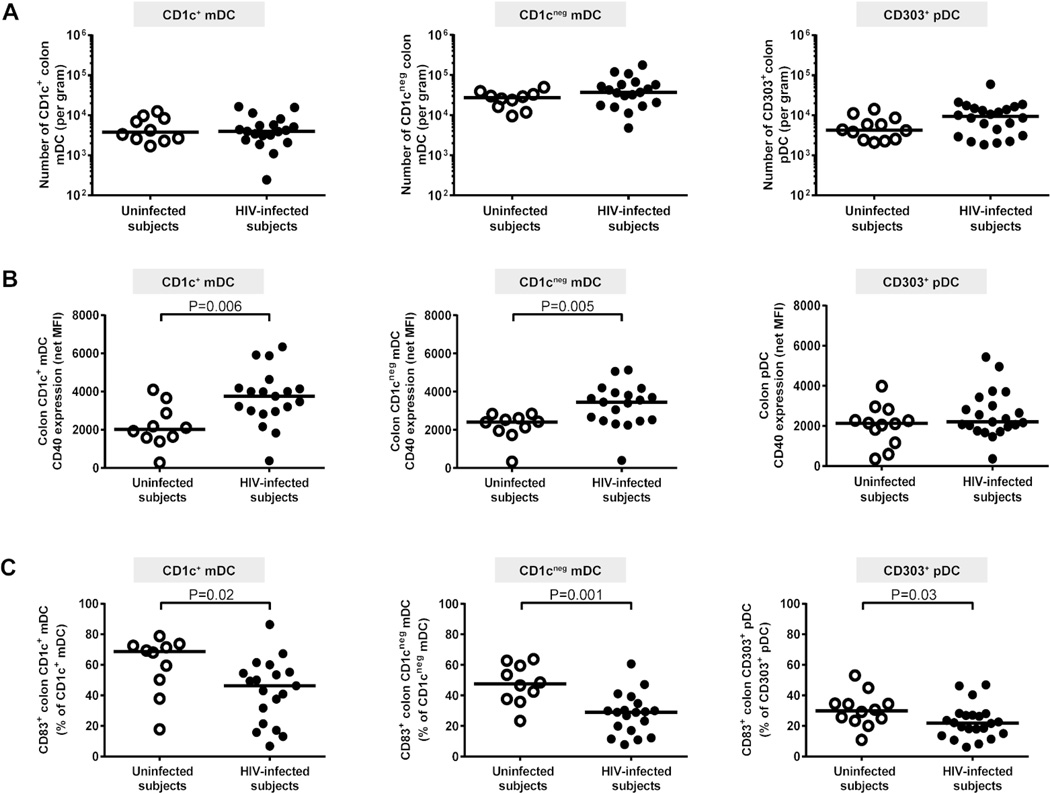
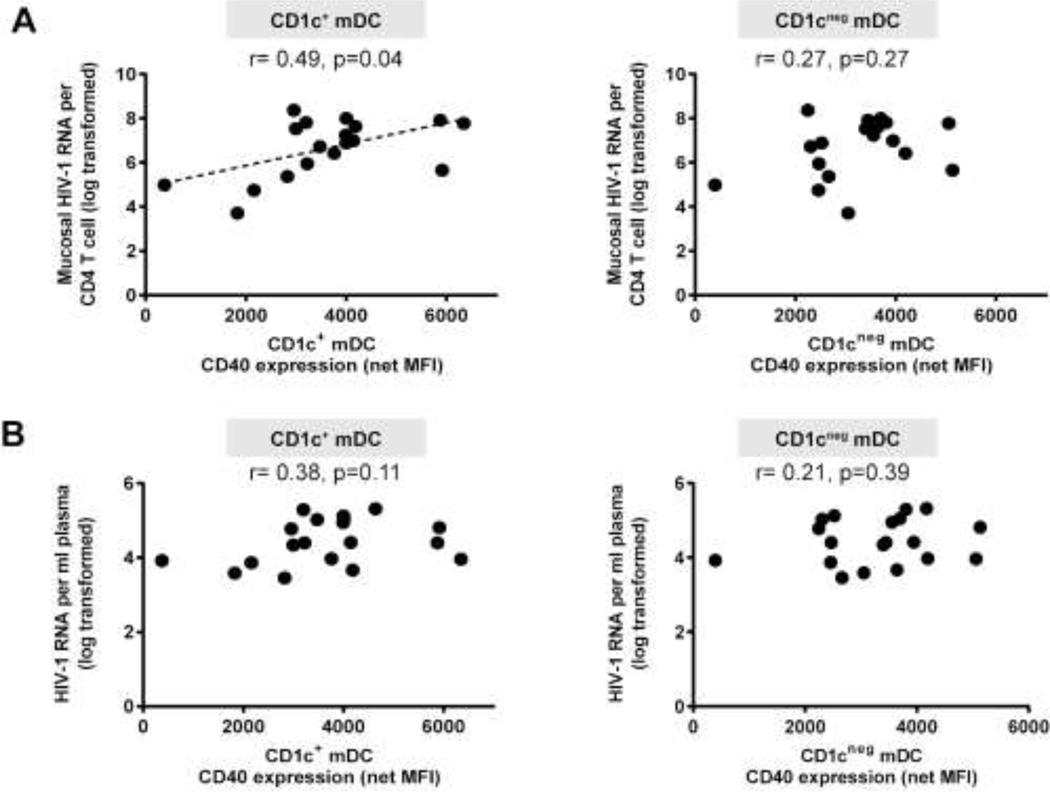
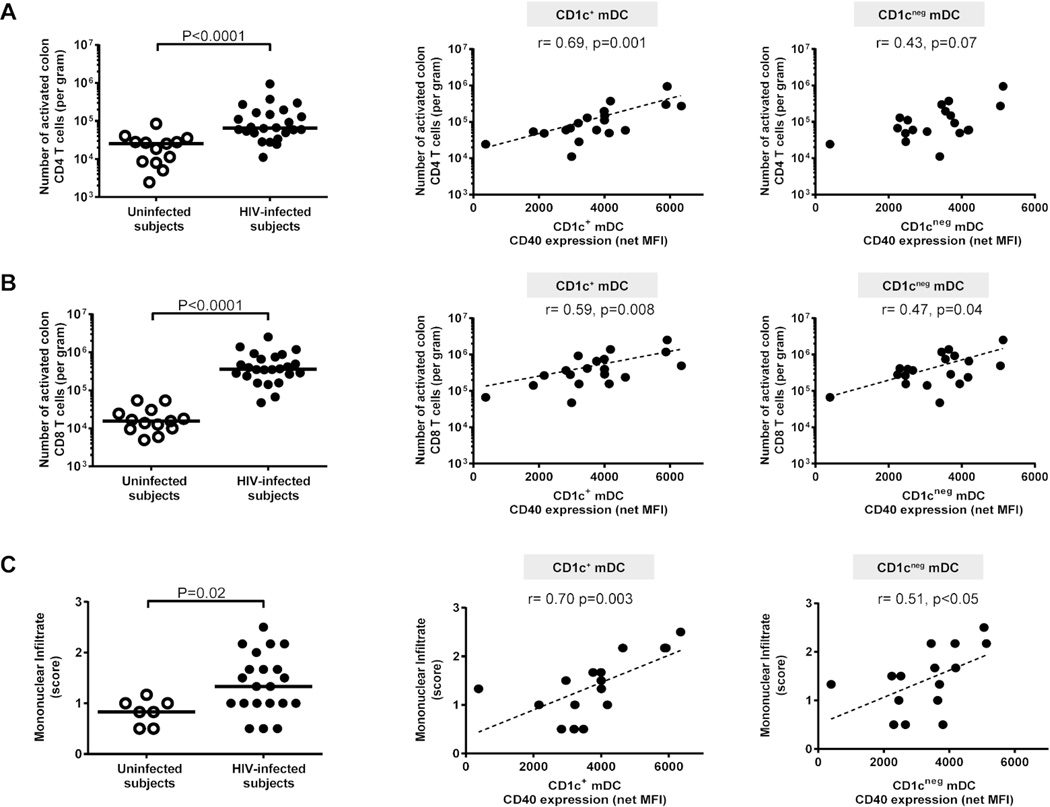
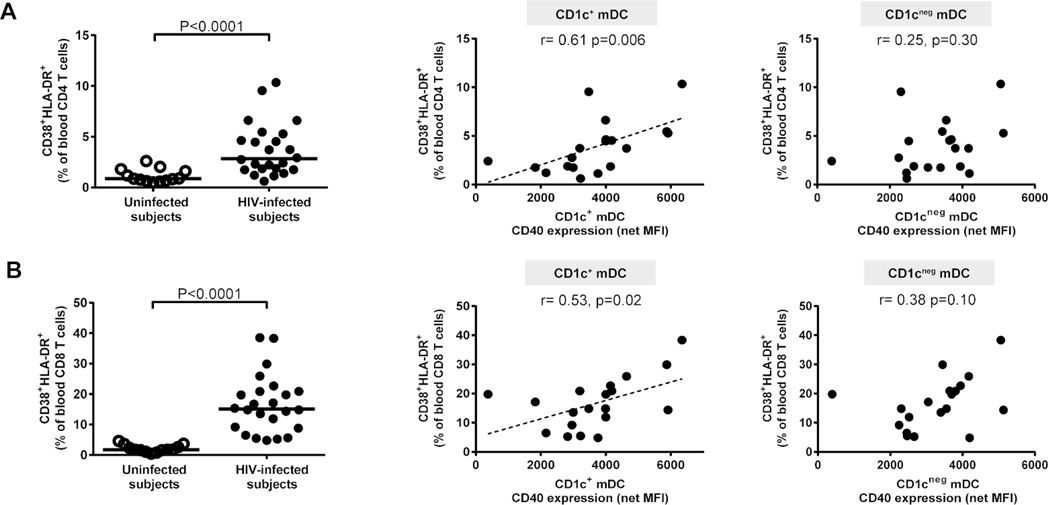
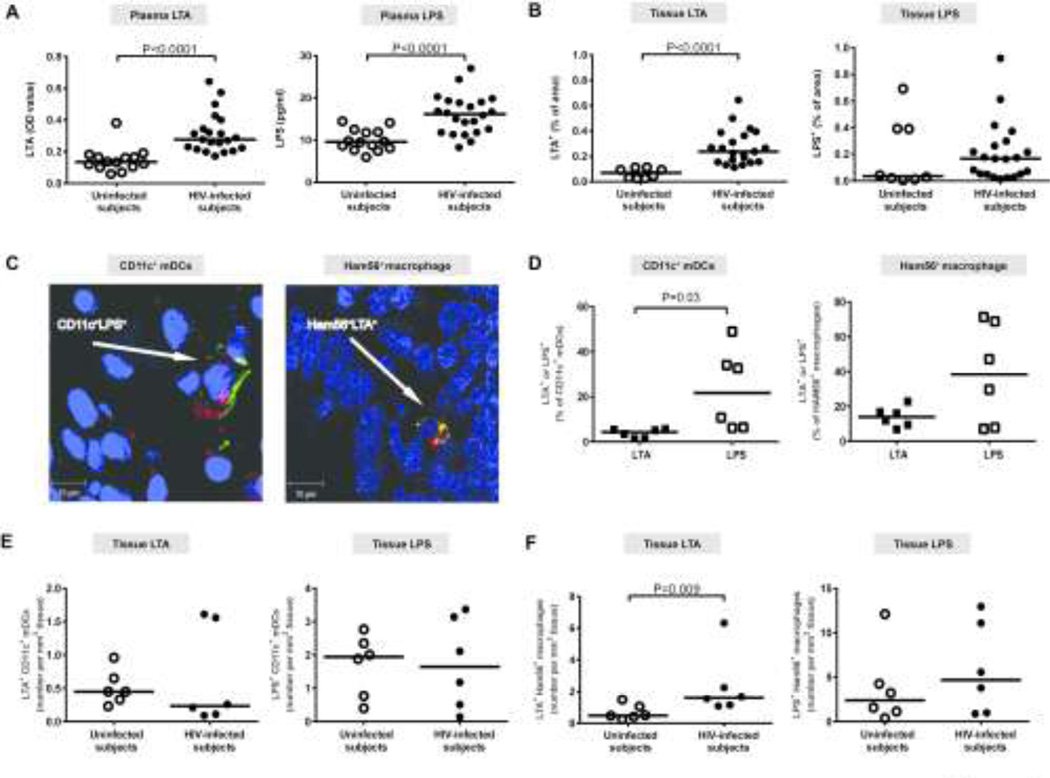
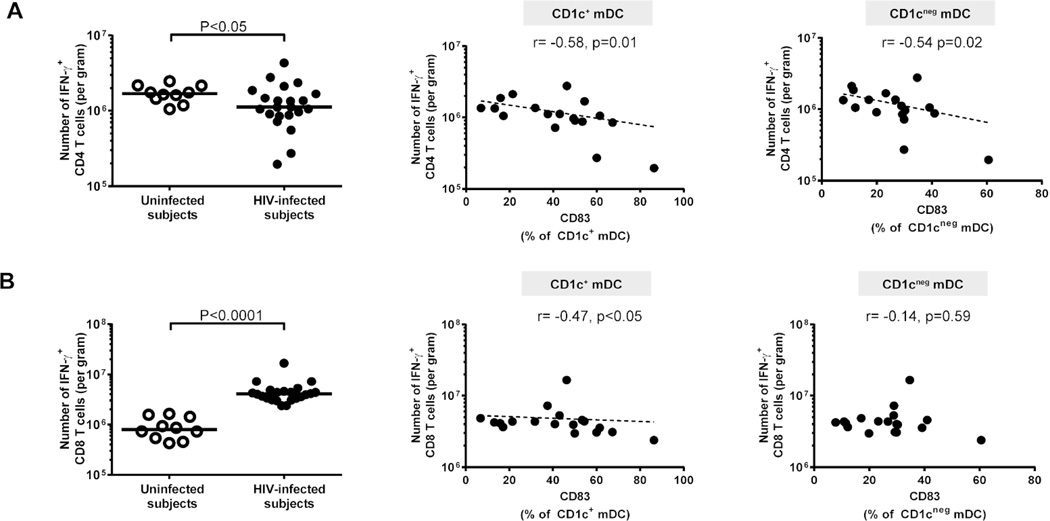
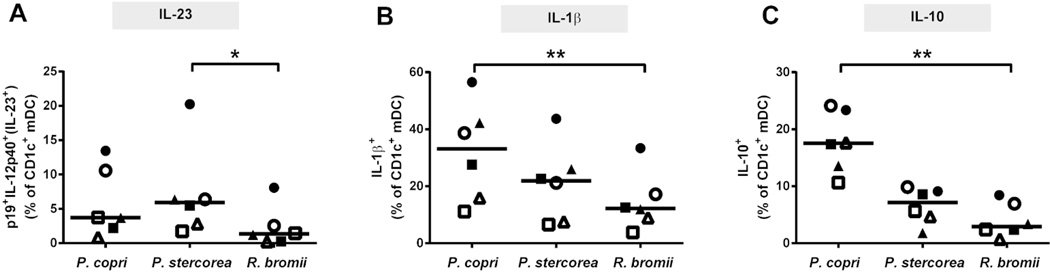
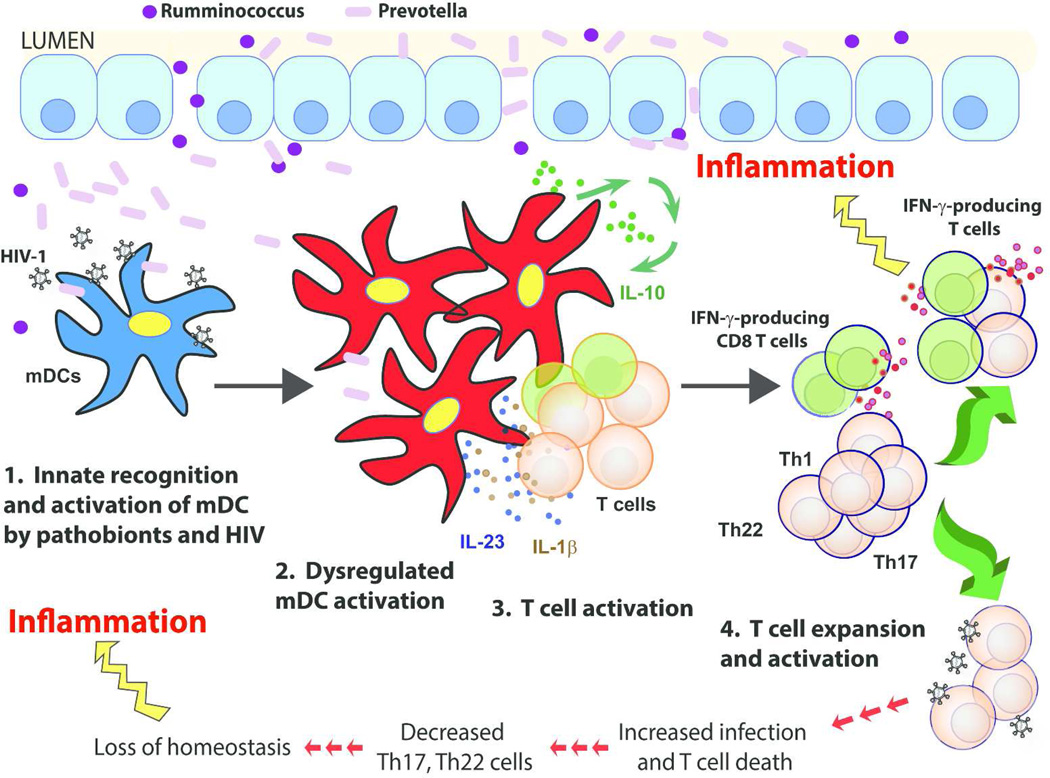
HIV-1-associated disruption of intestinal homeostasis is a major factor contributing to chronic immune activation and inflammation. Dendritic cells (DCs) are crucial in maintaining intestinal homeostasis, but the impact of HIV-1 infection on intestinal DC number and function has not been extensively studied. We compared the frequency and activation/maturation status of colonic myeloid DC (mDC) subsets (CD1c(+) and CD1c(neg)) and plasmacytoid DCs in untreated HIV-1-infected subjects with uninfected controls. Colonic mDCs in HIV-1-infected subjects had increased CD40 but decreased CD83 expression, and CD40 expression on CD1c(+) mDCs positively correlated with mucosal HIV-1 viral load, with mucosal and systemic cytokine production, and with frequencies of activated colon and blood T cells. Percentage of CD83(+)CD1c(+) mDCs negatively correlated with frequencies of interferon-γ-producing colon CD4(+) and CD8(+) T cells. CD40 expression on CD1c(+) mDCs positively associated with abundance of high prevalence mucosal Prevotella copri and Prevotella stercorea but negatively associated with a number of low prevalence mucosal species, including Rumminococcus bromii. CD1c(+) mDC cytokine production was greater in response to in vitro stimulation with Prevotella species relative to R. bromii. These findings suggest that, during HIV infection, colonic mDCs become activated upon exposure to mucosal pathobiont bacteria leading to mucosal and systemic immune activation.


Conflict of interest statement

DISCLOSURE

The authors declare no conflict of interest.

Figures

Figure 1
Figure 1. Colon dendritic cells (DCs) from HIV-1-infected subjects have an altered activation profile
Multi-color flow cytometry techniques were used to determine frequencies and activation/maturation states of colon CD1c+ myeloid DCs (mDCs), CD1cneg mDCs and CD303+ plasmacytoid DCs (pDC) in uninfected (open circles) and HIV-1-infected (HIV-infected; closed circles) subjects. (A) Frequencies of CD1c+ mDCs, CD1cneg mDCs (uninfected n=10; HIV-infected n=19) and CD303+ pDCs (uninfected n=12, HIV-infected n=22) were evaluated as a percent of viable, CD45+ leucocytes and converted into a total number of DC per gram of tissue. (B) CD40 expression levels (Mean Fluorescence Intensity; MFI) and (C) percent of CD83+ DCs were assessed on CD1c+ mDCs, CD1cneg mDCs (uninfected n=10; HIV-infected n=19) and CD303+ pDCs (uninfected n=12, HIV-infected n=22). Appropriate isotype controls were removed to control for background staining (net). Lines represent median values and statistical analysis was performed using the Mann-Whitney test.
Figure 2
Figure 2. Activated colon CD1c+ myeloid dendritic cells (mDCs) correlate with mucosal HIV-1 viral load
Correlations between CD40 expression levels (mean fluorescence intensity; MFI) on CD1c+ and CD1cneg mDCs (shown with background isotype values removed; net MFI) with (A) mucosal HIV-1 viral load (n= 18) and (B) plasma HIV-1 viral load (n=19). Statistical analysis was performed using the Spearman test. Dotted line is a visual representation of the significant association.
Figure 3
Figure 3. Activated colon CD1c+ myeloid dendritic cells (mDCs) correlate with mucosal T cell activation and mononuclear infiltration
Multi-color flow cytometry techniques were used to determine frequencies of activated (percent CD38+ HLA-DR+) colonic mucosal CD4 and CD8 T cells and H&E staining to evaluate lamina propria (LP) infiltration of mononuclear cells in uninfected (open circles) and HIV-1-infected (HIV-infected; closed circles). Frequencies of colonic mucosal (A) CD38+HLA-DR+ CD4 T cells and (B) CD38+HLA-DR+ CD8 T cells (uninfected n=13; HIV-infected n=24) were evaluated (with background isotype values removed) as a percent of viable, CD45+ leucocytes and converted into a total number of activated CD4 or CD8 T cells per gram of tissue. Lines represent median values and statistical analysis was performed using the Mann-Whitney test. Correlations between CD40 expression levels (mean fluorescence intensity; MFI) on CD1c+ and CD1cneg mDCs (shown with background isotype values removed; net MFI) and activated (A) CD4 T cells or (B) CD8 T cells (shown with background isotype values removed) in HIV-infected subjects (n= 19) were performed using the Spearman test. Dotted line is a visual representation of the significant associations. (C) Mononuclear infiltrate assessed as the relative cellularity of the LP infiltrate consisting of lymphocytes, plasma cells, eosinophils and occasional neutrophils and scored on a scale of 0 = Not present, Minimal = 0.5, Mild = 1, Moderate = 2, and Severe = 3. Values are shown as the average score of 3 sections of colon biopsy from uninfected (open circles, n=7) and HIV-1-infected (HIV-infected; n=21) subjects. Lines represent median values and statistical analysis was performed using the Mann-Whitney test. Correlations between CD40 expression levels (mean fluorescence intensity; MFI) on CD1c+ and CD1cneg mDCs (shown with background isotype values removed; net MFI) and mononuclear infiltrate scores in HIV-infected subjects (n= 16) were performed using the Spearman test. Dotted line is a visual representation of the significant associations.
Figure 4
Figure 4. Activated colon CD1c+ myeloid dendritic cells (mDCs) correlate with systemic T cell activation
Multi-color flow cytometry techniques were used to determine frequencies of activated (percent CD38+ HLA-DR+) blood CD4 and CD8 T cells in uninfected (open circles; n=13) and HIV-1-infected (HIV-infected; n=24; closed circles). Percentages of (A) CD38+HLA-DR+ blood CD4 T cells and (B) CD38+HLA-DR+ blood CD8 T cells as a fraction of blood CD4 or CD8 T cells (shown with background isotype values removed). Lines represent median values and statistical analysis was performed using the Mann-Whitney test. Correlations between CD40 expression levels (mean fluorescence intensity; MFI) on CD1c+ and CD1cneg mDCs (shown with background isotype values removed; net MFI) and activated blood (A) CD4 and (B) CD8 T cells (shown with background isotype values removed) in HIV-infected subjects (n= 19) were performed using the Spearman test. Dotted line is a visual representation of the significant associations.
Figure 5
Figure 5. Colonic tissue and systemic levels of microbial products are increased in HIV-1-infected subjects and colonic myeloid dendritic cells (mDCs) associate with tissue LPS to a greater extent than LTA
Levels of LTA and LPS were evaluated in the (A) plasma of uninfected (n=14) and HIV-1-infected (HIV-infected; LTA n=21; LPS n=22) subjects and in the (B) colonic lamina propria (LP) of uninfected (n=8) and HIV-1-infected (HIV-infected, n=21) subjects. Lines represent median values and statistical analysis was performed using the Mann-Whitney test. (C) Representative images demonstrating localization of mDCs (CD11c/green) or macrophages (Ham56/yellow) with either LTA or LPS (red) in formalin-fixed, paraffin-embedded colon biopsy tissue of an HIV-1-infected subject. (D) Comparisons between percentages of LTA+ or LPS+ CD11c+ mDCs and HAM56+ macrophages in HIV-infected subjects (n=6). Lines represent median values and statistical analysis was performed using the Wilcoxon matched-pairs signed rank test. (E, F) Number of LTA+ or LPS+ (E) CD11c+ mDCs and (F) Ham56+ macrophages per mm2 of tissue in uninfected (n=6) and HIV-infected subjects (n=6). Lines represent median values and statistical analysis was performed using the Mann-Whitney test.
Figure 6
Figure 6. CD83+ myeloid dendritic cells (mDCs) negatively correlate with colonic IFN-γ-producing CD4 and CD8 T cells
Multi-color flow cytometry techniques were used to determine frequencies of IFN-γ-producing colonic CD4 and CD8 T cells following mitogenic stimulation in uninfected (open circles; n=10) and HIV-1-infected (HIV-infected; n=22) subjects. Frequencies of colonic (A) IFN-γ+ CD4 T cells and (B) IFN-γ+ CD8 T cells were evaluated (background isotype values removed) as a percent of viable, CD45+ leucocytes and converted into a total number of activated CD4 or CD8 T cells per gram of tissue. Lines represent median values and statistical analysis was performed using the Mann-Whitney test. Correlations between percent of CD83+ CD1c+ and CD1cneg mDCs (shown with background isotype values removed) and number of IFN-γ+ (A) CD4 T cells or (B) CD8 T cells (shown with background isotype values removed) in HIV-infected subjects (n= 18) were performed using the Spearman test. Dotted line is a visual representation of the significant associations.
Figure 7
Figure 7. CD1c+ myeloid dendritic cell (mDC) cytokine production in response to in vitro stimulation with HIV-altered mucosal bacteria (HAMB) species
Colonic LPMC (n=7 samples) were exposed to Prevotella copri P. stercorea or Ruminococcus bromii for 18–20hrs and multi-color intracellular cytokine flow cytometry techniques used to enumerate IL-23+ (IL-12p40+p19+), IL-1β+ and IL-10+ CD1c+ mDCs. Appropriate isotype controls were removed to control for background staining. Values are shown as HAMB-specific cytokine+ mDCs determined by removing the percent of cytokine+ CD1c+ mDCs detected in unstimulated cultures. Each symbol is a unique donor. Lines represent median values and statistical analysis was performed using the Friedman test for matched-paired comparisons across multiple groups, with a Dunn’s multiple comparison test performed when the overall p value was <0.05. *p<0.05, **p<0.01.
Figure 8
Figure 8. Proposed model illustrating colonic myeloid dendritic cells (mDCs) driving mucosal immune activation and inflammation during chronic untreated HIV-1 infection
HIV replication in the lamina propria (LP) results in epithelial barrier disruption, leading to the 1) increased translocation of gram-negative Prevotella into the LP which synergizes with HIV-1 to induce 2) a dysregulated mDC activation profile characterized by increased levels of CD40 and decreased CD83 expression. Activated mDCs subsequently induce 3) increased T cell activation via stimulation of bacteria-specific CD4 T cells, through cell-cell contact (e.g. CD40/CD40L), production of inflammatory cytokines (IL-23, IL-1β) and potentially via CD83-mediated loss of T cell regulation. mDCs produce IL-10 to compensate for increased pro-inflammatory cytokine production; however, this may also exacerbate IFN-γ production. In total, this culminates in 4) increased T cell activation and expansion of T helper (Th)1, Th17 and Th22 and IFN-γ-producing CD8 T cells. Activated Th1/17/22 cells are targets for viral replication which ultimately results in their infection and depletion. Increased mucosal mDC and T cell activation and inflammation, a loss of mDC-mediated regulation, and a lack of “protective” Th17 and Th22 cells further contribute to epithelial barrier breakdown and microbial translocation, thereby potentiating a vicious cycle that ultimately leads to systemic inflammation and immune activation and their attendant comorbidities.

References

    1. Hunt PW. HIV and inflammation: mechanisms and consequences. Current HIV/AIDS reports. 2012;9:139–147. - PubMed
    1. Deeks SG, et al. Immune activation set point during early HIV infection predicts subsequent CD4+ T-cell changes independent of viral load. Blood. 2004;104:942–947. - PubMed
    1. Giorgi JV, et al. Shorter survival in advanced human immunodeficiency virus type 1 infection is more closely associated with T lymphocyte activation than with plasma virus burden or virus chemokine coreceptor usage. The Journal of infectious diseases. 1999;179:859–870. - PubMed
    1. Giorgi JV, et al. Elevated levels of CD38+ CD8+ T cells in HIV infection add to the prognostic value of low CD4+ T cell levels: results of 6 years of follow-up. The Los Angeles Center, Multicenter AIDS Cohort Study. J Acquir Immune Defic Syndr. 1993;6:904–912. - PubMed
    1. Marchetti G, Tincati C, Silvestri G. Microbial translocation in the pathogenesis of HIV infection and AIDS. Clinical microbiology reviews. 2013;26:2–18. - PMC - PubMed

Publication types

MeSH terms