. 2015 Jun 12;290(24):15292-303.
doi: 10.1074/jbc.M114.611178. Epub 2015 Apr 28.

Critical Roles of Two Hydrophobic Residues within Human Glucose Transporter 9 (hSLC2A9) in Substrate Selectivity and Urate Transport

Affiliations

Critical Roles of Two Hydrophobic Residues within Human Glucose Transporter 9 (hSLC2A9) in Substrate Selectivity and Urate Transport

Wentong Long et al. J Biol Chem. .

Abstract

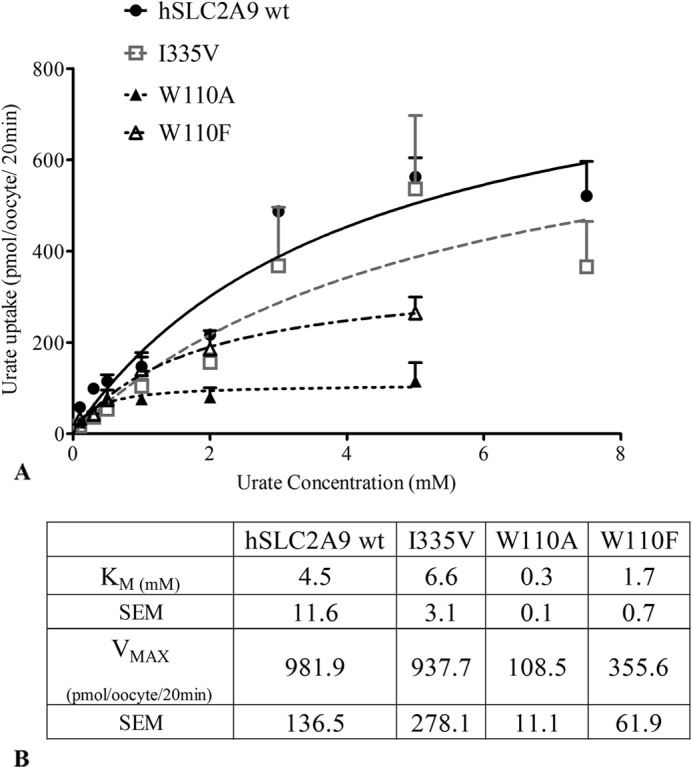
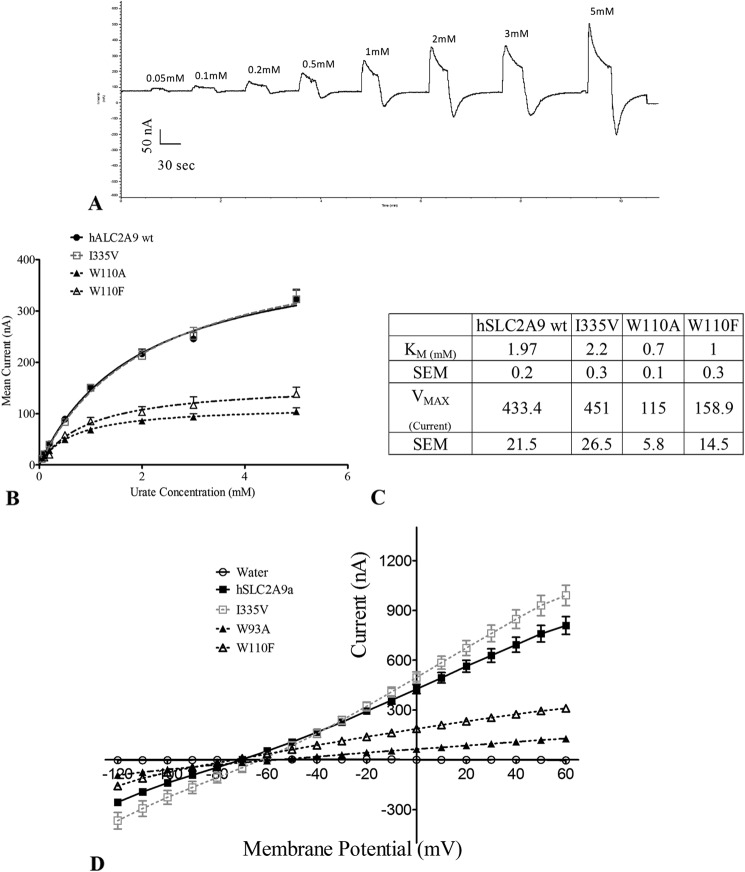
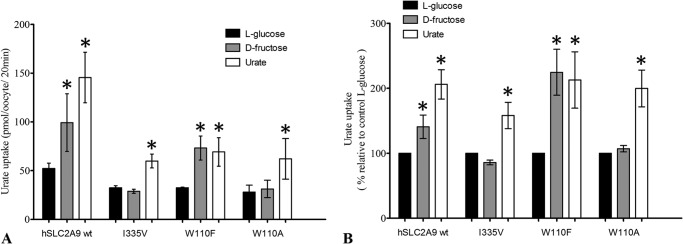
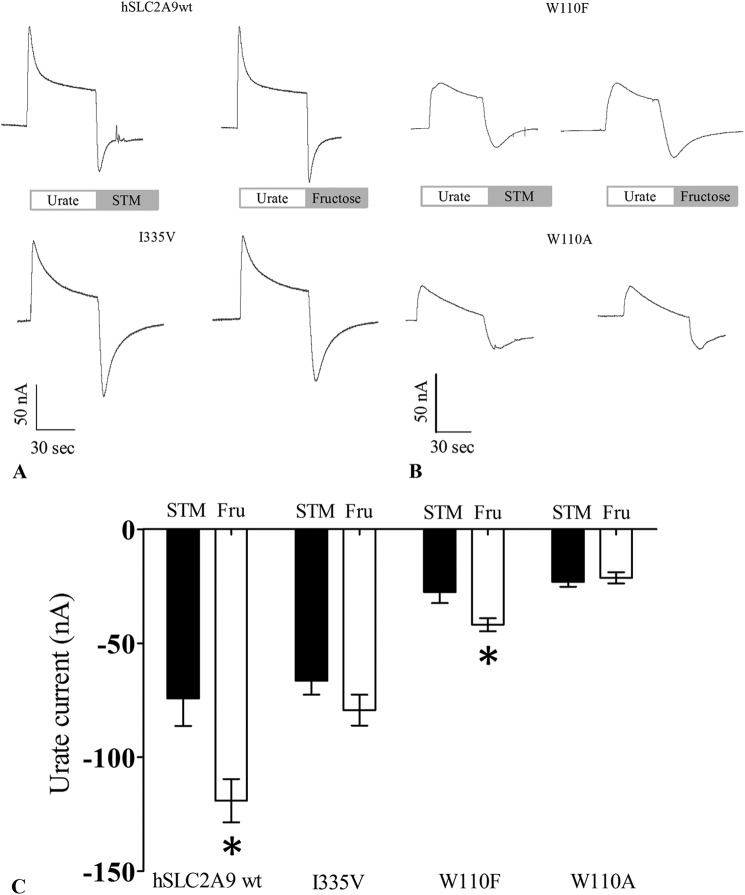
High blood urate levels (hyperuricemia) have been found to be a significant risk factor for cardiovascular diseases and inflammatory arthritis, such as hypertension and gout. Human glucose transporter 9 (hSLC2A9) is an essential protein that mainly regulates urate/hexose homeostasis in human kidney and liver. hSLC2A9 is a high affinity-low capacity hexose transporter and a high capacity urate transporter. Our previous studies identified a single hydrophobic residue in trans-membrane domain 7 of class II glucose transporters as a determinant of fructose transport. A mutation of isoleucine 335 to valine (I355V) in hSLC2A9 can reduce fructose transport while not affecting glucose fluxes. This current study demonstrates that the I335V mutant transports urate similarly to the wild type hSLC2A9; however, Ile-335 is necessary for urate/fructose trans-acceleration exchange to occur. Furthermore, Trp-110 is a critical site for urate transport. Two structural models of the class II glucose transporters, hSLC2A9 and hSLC2A5, based on the crystal structure of hSLC2A1 (GLUT1), reveal that Ile-335 (or the homologous Ile-296 in hSLC2A5) is a key component for protein conformational changes when the protein translocates substrates. The hSLC2A9 model also predicted that Trp-110 is a crucial site that could directly interact with urate during transport. Together, these studies confirm that hSLC2A9 transports both urate and fructose, but it interacts with them in different ways. Therefore, this study advances our understanding of how hSLC2A9 mediates urate and fructose transport, providing further information for developing pharmacological agents to treat hyperuricemia and related diseases, such as gout, hypertension, and diabetes.

Keywords: hSLC2A9, hydrophobic residues, urate, trans-acceleration.


Figures

FIGURE 1.
FIGURE 1.
[14C]Urate kinetic measurements in oocytes expressing hSLC2A9. Panel A, Michaelis-Menten curves of [14C]urate kinetics of hSLC2A9 WT (●) and its mutants I335V (□), W110A (▴), and W110F (▵). Urate uptake was measured by incubating protein expressing oocytes in 200 μl of urate solution ranged from 100 μm to 5 mm for 20 min. Uptake activity was corrected for nonspecific transport measured in control water-injected oocytes from the same batch of oocytes. Panel B, [14C]urate kinetic constants of the three isoforms (n = 4).
FIGURE 2.
FIGURE 2.
Urate-induced currents in oocytes measured with TEVC. Panel A, Provides a representative trace from the Gap-free protocol of WT hSLC2A9-expressed oocytes. Single oocytes were clamped at −30 mV and super-perfused with different concentrations of urate for 30 s (range from 0.1 to 5 mm) followed by a 1-min wash with urate free buffer in between. Panel B, Michaelis-Menten curves of urate kinetics of hSLC2A9 WT (●) and its mutants I335V (□), W110A (▴), and W110F (▵). Data were collected at the peak of each urate-induced current. Points represent the mean of urate induced peak outward current for each concentration. Panel C, [14C]urate kinetic constants of the WT and mutant isoforms (n ≥15 oocytes from 3 frogs). Panel D, current-voltage curve of 1 mm urate-induced current obtained from RAMP protocol for control and WT hSLC2A9 (●)- and I335V (□), W110A(▴), and W110F (▵) mutant-expressing oocytes. The oocytes were clamped initially at −30 mV followed by voltage change instantly from −120 to 60 mV for a 3-s period. I-V curves were RAMP at the peak of the urate-induced currents. n ≥15 oocytes from 3 frogs.
FIGURE 3.
FIGURE 3.
Trans-acceleration studies for urate uptake into oocytes preloaded with urate or fructose. Panel A, trans-acceleration experiments of urate flux in the presence of intracellular substrates mediated by hSLC2A9 WT- I335V mutant-, W110A mutant-, and W110F-expressing oocytes. Oocytes were preloaded with intracellular substrates, l-glucose (dark), d-fructose (gray), or urate (white) by preincubation for 1 h. Preloaded oocytes were then washed with fresh modified Barth's medium before performing [14C]urate uptake experiments. Panel B, bar graphs represent the percentage of each condition relative to control experiments (l-glucose). n ≥ 3, one-way ANOVA; *, p < 0.05.
FIGURE 4.
FIGURE 4.
Trans-acceleration studies of urate-induced currents mediated by hSLC2A9 measured with TEVC. Panels A and B are representative current traces in a single oocyte expressing hSLC2A9 WT (upper traces), the I335V (lower traces), W110F (upper traces), and W110A (lower traces) mutants. All traces indicate 1 min of urate preloading followed by washing with either substrate free STM buffer (left) or 50 mm d-fructose STM buffer (right). Oocytes were clamped at −30 mV, and traces were recorded under the Gap-free protocol. Panel C, mean urate-induced inward currents were collected at the peak of the inward currents hSLC2A9 WT, I335V, W110F, and W110A. Urate preloading, oocytes were washed with either STM (dark) or 50 mm fructose containing STM (Fru, white). n ≥ 15 oocytes from 3 frogs, unpaired t test. *, p < 0.05.
FIGURE 5.
FIGURE 5.
Qualitative and quantitative determination of WT and mutant hSLC2A9 protein expression. Panel A, representative pictures of immunohistochemistry of water injected, hSLC2A9 WT and I335V, W110A, and W110F mutant-expressing oocytes. Panel B, a representative picture of Western blot analysis of protein expression of water injected: hSLC2A9 WT and I335V-, W110F-, and W110A-expressing oocytes. Total (Tf; black), unbound (Un; gray), and biotinylated (Bt, white) proteins of hSLC2A9 WT, W110F, and W110A were loaded onto one 10-well SDS-PAGE gel, whereas proteins of I335V were loaded on a separated gel. Panel C, quantitative analysis of protein expression. Data were calculated from band intensities obtained from Image J and use a formula, biotinylated protein = total protein − unbound protein. Protein expression levels are shown as bar graphs with arbitrary units. n ≥ 6, one-way ANOVA among the three biotinylated proteins, p > 0.05.
FIGURE 6.
FIGURE 6.
Molecular model of the human SLC2A9 and SLC2A5 transporters comparing possible hydrophobic interactions. Panel A, schematic representation of the molecular homology model of the hSLC2A9a based on the human SLC2A1 crystal structure (PDB ID 4PYP). The 12-transmembrane helices are labeled. Panels B and C show views from the intracellular face and extracellular face. The intracellular face contains the conserved intracellular helical bundle. Panel D, potential interactions of Ile-335 indicate a hydrophobic network with residues within TM10, thus linking the critical TM7 (orange) to one-half of the transporter. Panel E, structural model of the mutant SLC2A9 I335V was generated that demonstrates the intricate linkage to helix 10 is disrupted when Ile-335 is converted to Val. Panel F, in SLC2A5 Ile-296, equivalent of Ile-335 in SLC2A9, forms an even more extensive hydrophobic cluster with neighboring residues at TM10 and TM12. Panel G, structural model of the mutant SLC2A5 I296V highlights the loss of the hydrophobic network, which subsequently leads to alteration in substrate specificity.
FIGURE 7.
FIGURE 7.
Analysis of tryptophan 110 orientation within the translocation pore of hSLC2A9. A schematic representation of the extracellular face of two SLC2A9 homology models, with the two halves of six helical bundles colored in green and purple, indicate that the Trp-110 residue is located within the substrate translocation pore of the transporter. Furthermore, it was noted among the molecular models generated, Trp-110 was observed in different orientations within the pore, suggesting a possible role of Trp-110 side chain movements during the transport cycle.

References

    1. Joost H. G., Thorens B. (2001) The extended GLUT-family of sugar/polyol transport facilitators: nomenclature, sequence characteristics, and potential function of its novel members. Mol. Membr. Biol. 18, 247–256 - PubMed
    1. Hirai T., Heymann J. A., Maloney P. C., Subramaniam S. (2003) Structural model for 12-helix transporters belonging to the major facilitator superfamily. J. Bacteriol. 185, 1712–1718 - PMC - PubMed
    1. Carruthers A., DeZutter J., Ganguly A., Devaskar S. U. (2009) Will the original glucose transporter isoform please stand up! Am. J. Physiol. Endocrinol. Metab. 297, E836–E848 - PMC - PubMed
    1. Cura A. J., Carruthers A. (2012) Role of monosaccharide transport proteins in carbohydrate assimilation, distribution, metabolism, and homeostasis. Compr. Physiol. 2, 863–914 - PMC - PubMed
    1. Phay J. E., Hussain H. B., Moley J. F. (2000) Cloning and expression analysis of a novel member of the facilitative glucose transporter family, SLC2A9 (GLUT9). Genomics 66, 217–220 - PubMed

Publication types

Associated data

LinkOut - more resources