

Contrasting spatial patterns and ecological attributes of soil bacterial and archaeal taxa across a landscape
- PMID: 25922908
- PMCID: PMC4475392
- DOI: 10.1002/mbo3.256
Contrasting spatial patterns and ecological attributes of soil bacterial and archaeal taxa across a landscape
Abstract
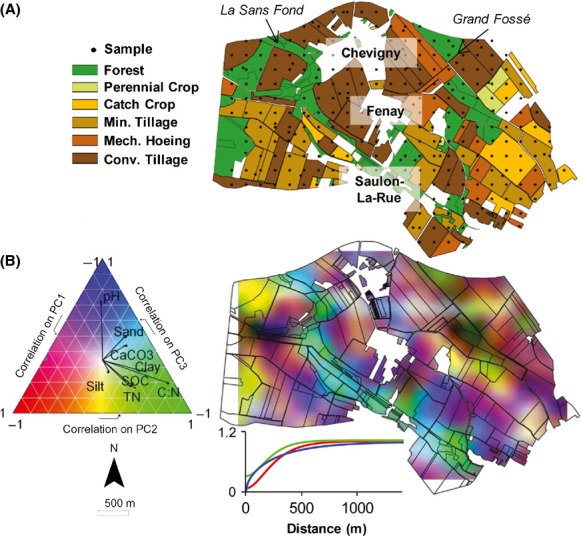
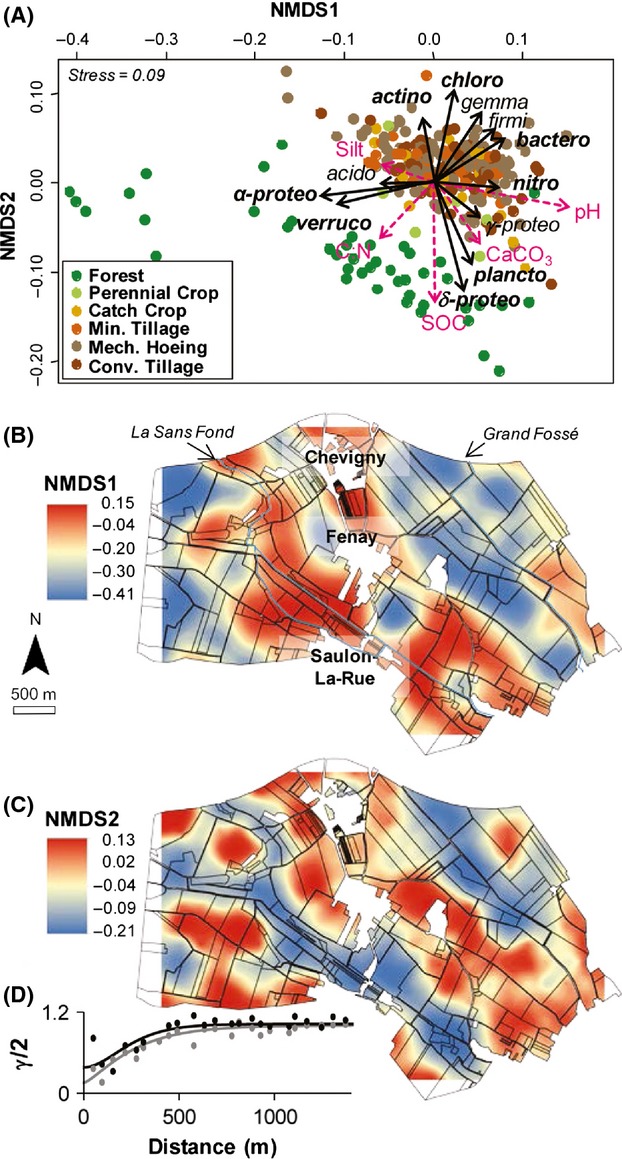
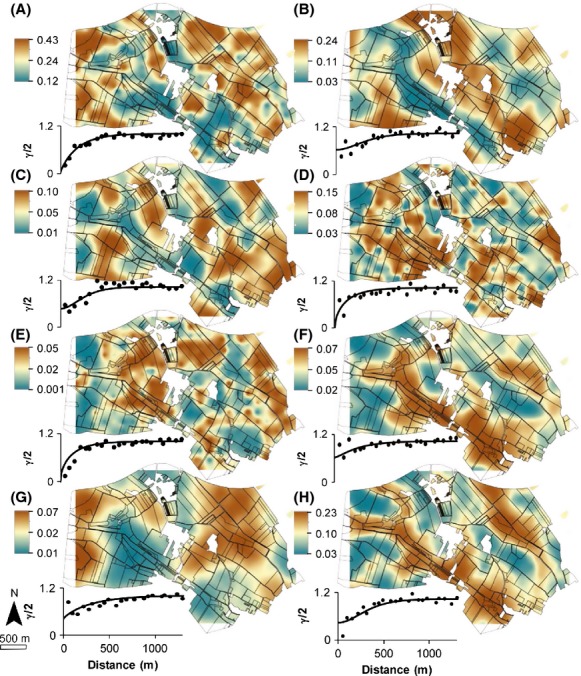
Even though recent studies have clarified the influence and hierarchy of environmental filters on bacterial community structure, those constraining bacterial populations variations remain unclear. In consequence, our ability to understand to ecological attributes of soil bacteria and to predict microbial community response to environmental stress is therefore limited. Here, we characterized the bacterial community composition and the various bacterial taxonomic groups constituting the community across an agricultural landscape of 12 km(2) , by using a 215 × 215 m systematic grid representing 278 sites to precisely decipher their spatial distribution and drivers at this scale. The bacterial and Archaeal community composition was characterized by applying 16S rRNA gene pyrosequencing directly to soil DNA from samples. Geostatistics tools were used to reveal the heterogeneous distribution of bacterial composition at this scale. Soil physical parameters and land management explained a significant amount of variation, suggesting that environmental selection is the major process shaping bacterial composition. All taxa systematically displayed also a heterogeneous and particular distribution patterns. Different relative influences of soil characteristics, land use and space were observed, depending on the taxa, implying that selection and spatial processes might be differentially but not exclusively involved for each bacterial phylum. Soil pH was a major factor determining the distribution of most of the bacterial taxa and especially the most important factor explaining the spatial patterns of α-Proteobacteria and Planctomycetes. Soil texture, organic carbon content and quality were more specific to a few number of taxa (e.g., β-Proteobacteria and Chlorobi). Land management also influenced the distribution of bacterial taxa across the landscape and revealed different type of response to cropping intensity (positive, negative, neutral or hump-backed relationships) according to phyla. Altogether, this study provided valuable clues about the ecological behavior of soil bacterial and archaeal taxa at an agricultural landscape scale and could be useful for developing sustainable strategies of land management.
Keywords: agroecology; bacterial communities; ecological attributes; landscape; soil; spatial distribution.
© 2015 The Authors. MicrobiologyOpen published by John Wiley & Sons Ltd.
Figures
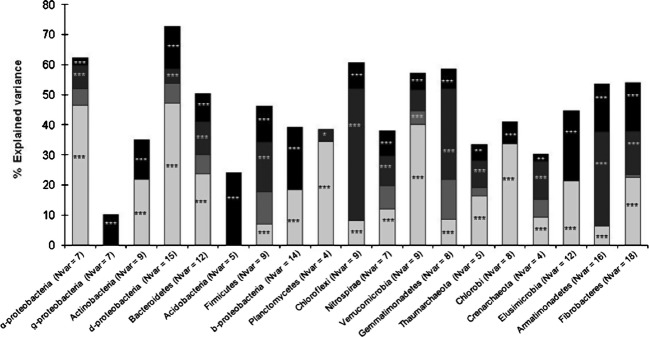
 : physicochemical characteristics,
  : land management,
  : space and
  : shared amount of variance between physicochemical properties and land management, using partial regressions). The significance level of the contribution of the sets of variables is indicated as follows; ns: not significant; P < 0.05: *; P < 0.01: **; P < 0.001: ***. Missing values indicate that no variable of the relating group was retained in the model.
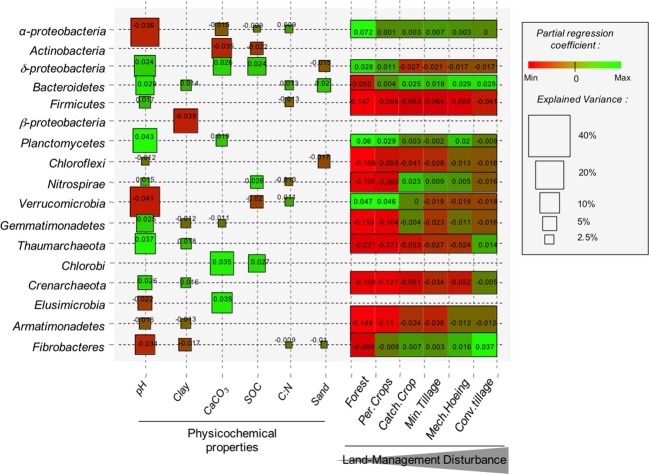
References
-
- Acosta-Martínez V, Dowd SE, Bell CW, Lascano R, Booker JD, Zobeck TM, et al. Microbial community composition as affected by dryland cropping systems and tillage in a semiarid sandy soil. Diversity. 2010;2:910–931.
-
- Arrouays D, Deslais W. Badeau V. The carbon content of topsoil and its geographical distribution in France. Soil Use Manag. 2001;17:7–11.
-
- Bell T. Experimental tests of the bacterial distance-decay relationship. ISME J. 2010;4:1357–1365. - PubMed
-
- Bernard L, Mougel C, Maron PA, Nowak V, Lévêque J, Henault C, et al. Dynamics and identification of soil microbial populations actively assimilating carbon from 13C-labelled wheat residue as estimated by DNA- and RNA-SIP techniques. Environ. Microbiol. 2007;9:752–764. - PubMed
Publication types
MeSH terms
Substances
LinkOut - more resources
Full Text Sources
Other Literature Sources
