. 2015 Apr 29;10(4):e0124577.
doi: 10.1371/journal.pone.0124577. eCollection 2015.

Functional Connectivity in MRI Is Driven by Spontaneous BOLD Events

Affiliations

Functional Connectivity in MRI Is Driven by Spontaneous BOLD Events

Thomas W Allan et al. PLoS One. .

Abstract

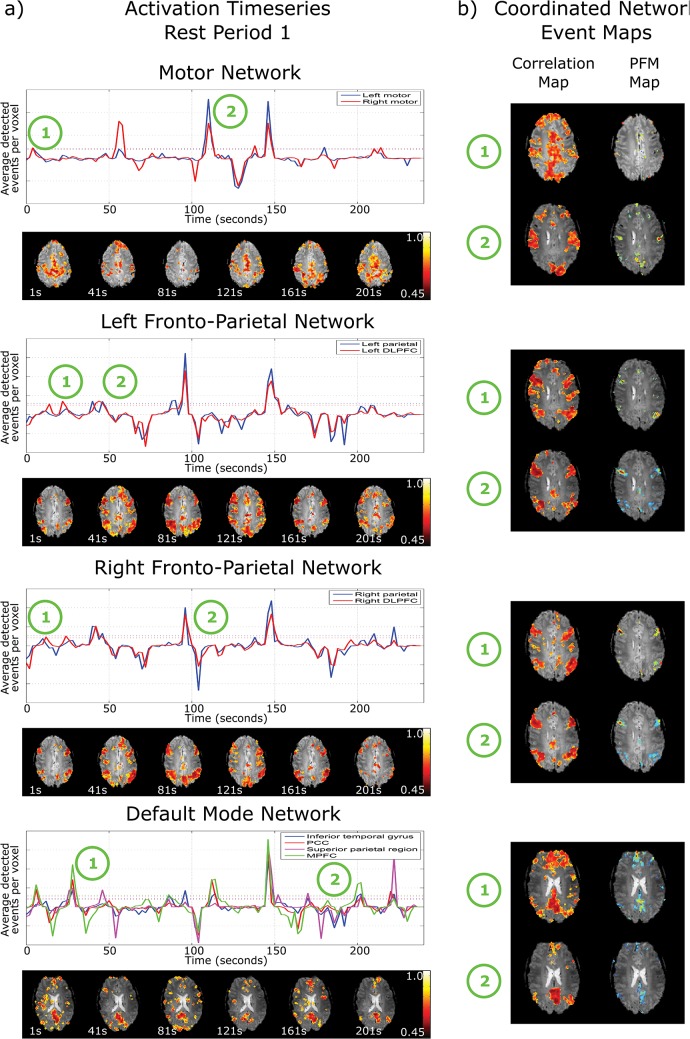
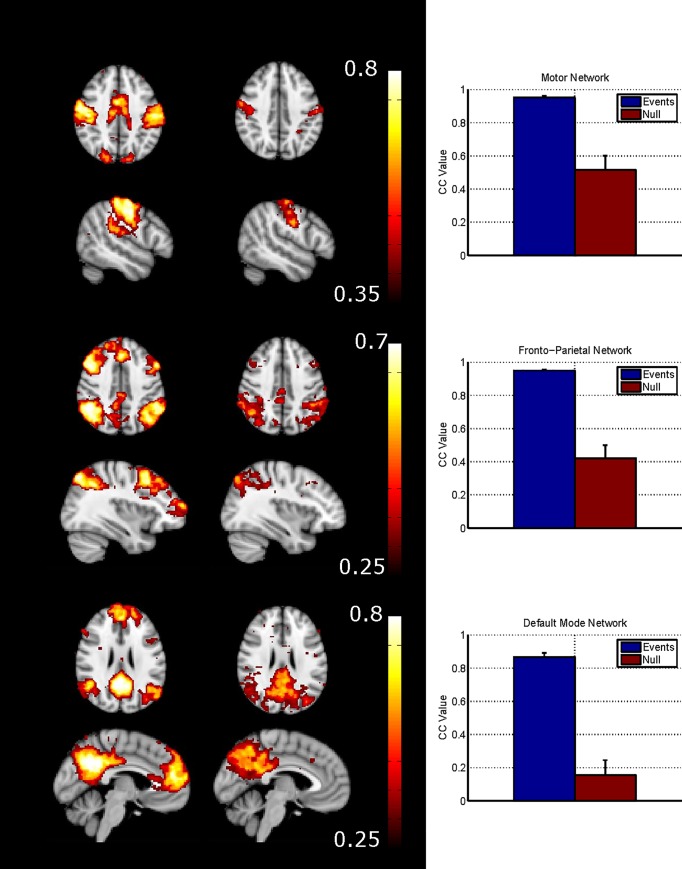
Functional brain signals are frequently decomposed into a relatively small set of large scale, distributed cortical networks that are associated with different cognitive functions. It is generally assumed that the connectivity of these networks is static in time and constant over the whole network, although there is increasing evidence that this view is too simplistic. This work proposes novel techniques to investigate the contribution of spontaneous BOLD events to the temporal dynamics of functional connectivity as assessed by ultra-high field functional magnetic resonance imaging (fMRI). The results show that: 1) spontaneous events in recognised brain networks contribute significantly to network connectivity estimates; 2) these spontaneous events do not necessarily involve whole networks or nodes, but clusters of voxels which act in concert, forming transiently synchronising sub-networks and 3) a task can significantly alter the number of localised spontaneous events that are detected within a single network. These findings support the notion that spontaneous events are the main driver of the large scale networks that are commonly detected by seed-based correlation and ICA. Furthermore, we found that large scale networks are manifestations of smaller, transiently synchronising sub-networks acting dynamically in concert, corresponding to spontaneous events, and which do not necessarily involve all voxels within the network nodes oscillating in unison.


Conflict of interest statement

Competing Interests: The authors have declared that no competing interests exist.

Figures

Fig 1
Fig 1. a) Nodal activation timeseries for the motor network, left and right fronto-parietal network and default mode network in rest period 1 from the motor data, for a single subject.
The solid lines show the average number of voxels within the node defined as active by PFM at each time point, and the dotted lines depict one standard deviation from baseline. The correlation maps (below the activation timeseries) are shown for 30s time windows at 40s intervals, each window starting at the time indicated. These highlight the dynamic nature and changing structure of networks b) correlation maps at the time of a coordinated network event that show strong network structure and their corresponding paradigm free mapping activation map depicting the voxels that showed an event at this time.
Fig 2
Fig 2. The cross subject average correlation maps following a coordinated network event (CNE- left) and for a null period (middle).
The graphs (right) show the difference in connectivity at these periods with high connectivity following a CNE and low in a null period.
Fig 3
Fig 3. Fractional significant correlation scores for the 2-back data for rest period 1 (top row) and 2-back task period (bottom row).
Fig 4
Fig 4. These graphs show the change in the average number of spontaneous events per voxel, per minute in each period.
The 2-back data has a significant (Wilcoxon sign rank test p = 0.0025, 0.0005 and 0.001 for the MN, DAN and DMN respectively, uncorrected) decrease from rest to task period for all three networks. There is also a significant (Wilcoxon sign rank test p = 0.0425, uncorrected) increase in the number of events in the motor network for the motor data. The different colours represent different subjects
Fig 5
Fig 5. a) Ten tICA weighting maps for subject 1 for the three networks studied, showing sub-structures within each network mask (beige) and b) a single component tICA maps showing consistent patterns between different subjects for the MN, DAN left and DMN.
The colour scale is normalised to unity.

References

    1. Biswal B, Yetkin FZ, Haughton VM, Hyde JS. Functional Connectivity in the Motor Cortex of Resting Human Brain Using Echo-Planar MRI. Magn Reson Med. 1995; 537–541. - PubMed
    1. Münchau A, Bloem BR, Irlbacher K, Trimble MR, Rothwell JC. Functional connectivity of human premotor and motor cortex explored with repetitive transcranial magnetic stimulation. J Neurosci. 2002;22: 554–61. Available: http://www.ncbi.nlm.nih.gov/pubmed/11784802 - PMC - PubMed
    1. Raichle ME, MacLeod AM, Snyder AZ, Powers WJ, Gusnard DA, Shulman GL. A default mode of brain function. Proc Natl Acad Sci U S A. 2001;98: 676–82. 10.1073/pnas.98.2.676 - DOI - PMC - PubMed
    1. Damoiseaux JS, Rombouts SARB, Barkhof F, Scheltens P, Stam CJ, Smith SM, et al. Consistent resting-state networks across healthy subjects. Proc Natl Acad Sci U S A. 2006;103: 13848–53. 10.1073/pnas.0601417103 - DOI - PMC - PubMed
    1. Sestieri C, Corbetta M, Romani GL, Shulman GL. Episodic memory retrieval, parietal cortex, and the default mode network: functional and topographic analyses. J Neurosci. 2011;31: 4407–20. 10.1523/JNEUROSCI.3335-10.2011 - DOI - PMC - PubMed

Publication types