

Trends in the prevalence of autism spectrum disorder, cerebral palsy, hearing loss, intellectual disability, and vision impairment, metropolitan atlanta, 1991-2010
- PMID: 25923140
- PMCID: PMC4414511
- DOI: 10.1371/journal.pone.0124120
Trends in the prevalence of autism spectrum disorder, cerebral palsy, hearing loss, intellectual disability, and vision impairment, metropolitan atlanta, 1991-2010
Abstract
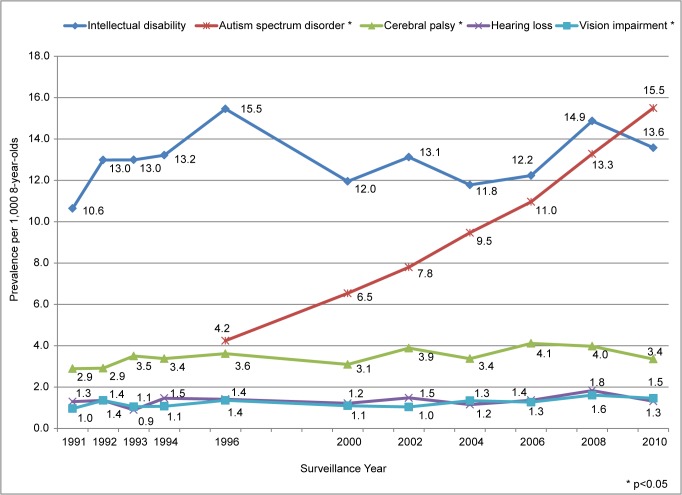
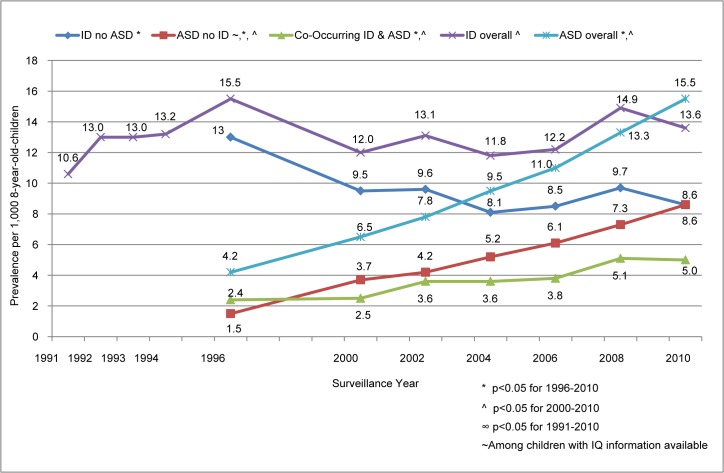
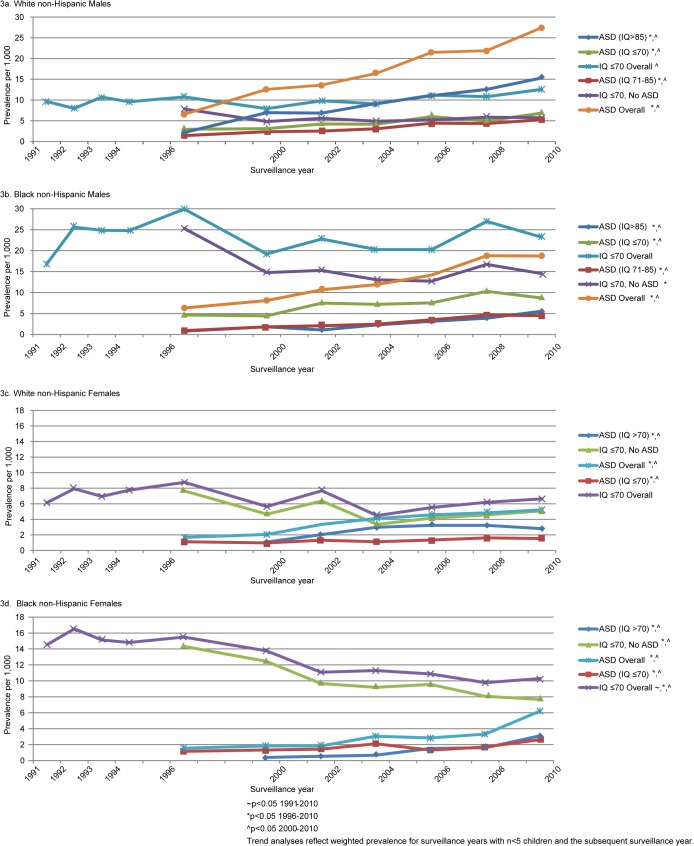
This study examined the prevalence and characteristics of autism spectrum disorder (ASD), cerebral palsy (CP), hearing loss (HL), intellectual disability (ID), and vision impairment (VI) over a 15-20 year time period, with specific focus on concurrent changes in ASD and ID prevalence. We used data from a population-based developmental disabilities surveillance program for 8-year-olds in metropolitan Atlanta. From 1991-2010, prevalence estimates of ID and HL were stable with slight increases in VI prevalence. CP prevalence was constant from 1993-2010. The average annual increase in ASD prevalence was 9.3% per year from 1996-2010, with a 269% increase from 4.2 per 1,000 in 1996 to 15.5 per 1,000 in 2010. From 2000-2010, the prevalence of ID without ASD was stable; during the same time, the prevalence of ASD with and without co-occurring ID increased by an average of 6.6% and 9.6% per year, respectively. ASD prevalence increases were found among both males and females, and among nearly all racial/ethnic subgroups and levels of intellectual ability. Average annual prevalence estimates from 1991-2010 underscore the significant community resources needed to provide early intervention and ongoing supports for children with ID (13.0 per 1,000), CP, (3.5 per 1,000), HL (1.4 per 1,000) and VI (1.3 in 1,000), with a growing urgency for children with ASD.
Conflict of interest statement
Figures
References
-
- Crocker AC. The spectrum of medical care for developmental disabilities In Rubin I.L. & Crocker AC (Eds). 1989. Developmental disabilities: Delivery of medical care for children and adults. Philadelphia:lea & Febiger.
-
- Yeargin-Allsopp M, Murphy CC, Oakley GP, Sikes RK. A multiple-source method for studying the prevalence of developmental disabilities in children: the Metropolitan Atlanta Developmental Disabilities Study. Pediatrics. 1992. April;89(4 Pt 1):624–30. - PubMed
-
- Centers for Disease Control and Prevention. Workshop on U.S. Data to Evaluate Changes in the Prevalence of Autism Spectrum Disorders (ASDs). February 1, 2011. http://www.cdc.gov/NCBDDD/autism/documents/EvaluatingChanges_WorkshopSum...
-
- Centers for Disease Control and Prevention. Autism and Developmental Disabilities Monitoring Network Surveillance Year 2010 Principal Investigators; Prevalence of autism spectrum disorders—Autism and Developmental Disabilities Monitoring Network, 11 sites, United States, 2010. MMWR Surveill Summ. 2014. March 28;63(2):1–21. - PubMed
MeSH terms
LinkOut - more resources
Full Text Sources
Other Literature Sources
Medical
Miscellaneous
