

Demonstration of a quantum error detection code using a square lattice of four superconducting qubits
- PMID: 25923200
- PMCID: PMC4421819
- DOI: 10.1038/ncomms7979
Demonstration of a quantum error detection code using a square lattice of four superconducting qubits
Abstract
The ability to detect and deal with errors when manipulating quantum systems is a fundamental requirement for fault-tolerant quantum computing. Unlike classical bits that are subject to only digital bit-flip errors, quantum bits are susceptible to a much larger spectrum of errors, for which any complete quantum error-correcting code must account. Whilst classical bit-flip detection can be realized via a linear array of qubits, a general fault-tolerant quantum error-correcting code requires extending into a higher-dimensional lattice. Here we present a quantum error detection protocol on a two-by-two planar lattice of superconducting qubits. The protocol detects an arbitrary quantum error on an encoded two-qubit entangled state via quantum non-demolition parity measurements on another pair of error syndrome qubits. This result represents a building block towards larger lattices amenable to fault-tolerant quantum error correction architectures such as the surface code.
Figures
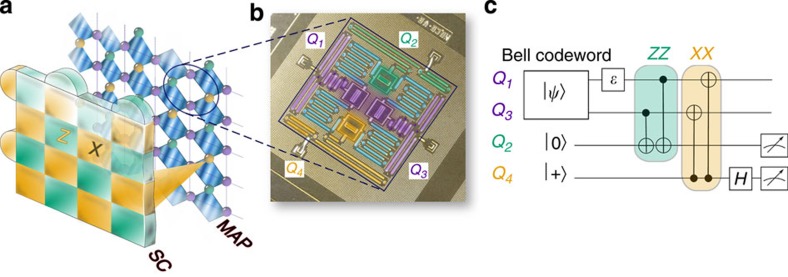
 onto the respective syndrome qubits, Q2 (green) and Q4 (yellow). Arbitrary errors ɛ are intentionally introduced on the code qubit Q1 and detected from the correlated measurement of the syndrome qubits. Q2 (Q4) is initialized to
  . A Hadamard operation, H, is applied to Q4 before measurement.
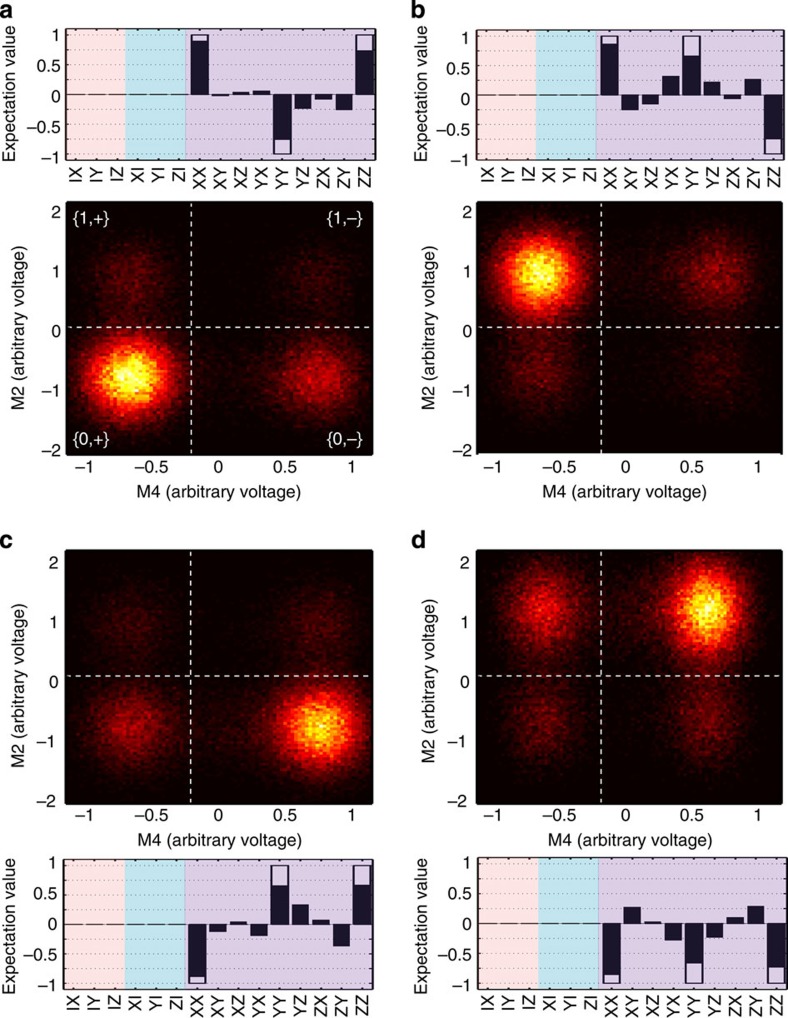
 at the beginning of the quantum process, when no error is applied to Q1, state tomography of Q1 and Q3 conditioned on outcomes in the lower left quadrant {0,+} of the colormap recover the same state with fidelity 0.8491±0.0005 (a). Introducing an error ɛ equal to X (b), Z (c) and Y (d) on Q1, and conditioning on outcomes in the upper left {1,+}, lower right {0,−} and upper right {1,−} quadrants results in the code qubits reconstructed as
  (fidelity 0.8195±0.0006),
  (with fidelity 0.8046±0.0005) and
  (fidelity 0.8148±0.0006), respectively. The X-syndrome qubit, Q4, is found in its excited state when a phase-flip error has occurred (c,d), whereas the Z-syndrome qubit, Q2, is found in its excited state as a result of bit-flip errors (b,d). The quoted uncertainties in reconstructed state fidelities are statistical (see Methods), but we note that systematic errors due to coherence time fluctuations, state preparation and measurement errors can lead to indifelity ∼0.01–0.02.
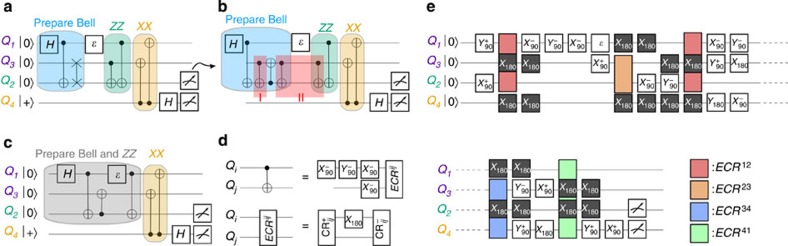
 gate, ECRij, consisting of two cross-resonance pulses of different sign separated by a π rotation in the control qubit. With that definition, a CNOT gate can be obtained with four single-qubit rotations plus a ECRij operation. An example, not unique, of such decomposition is shown in d. The complete gate sequence in our error detection experiments is presented in e, where the dark boxes indicate refocus pulses during every two-qubit gate on the two qubits not involved on it.
References
-
- Cory D. G. et al. Experimental quantum error correction. Phys. Rev. Lett. 81, 2152–2155 (1998).
-
- Zhang J., Laflamme R. & Suter D. Experimental implementation of encoded logical qubit operations in a perfect quantum error correcting code. Phys. Rev. Lett. 109, 100503 (2012). - PubMed
-
- Moussa O., Baugh J., Ryan C. A. & Laflamme R. Demonstration of sufficient control for two rounds of quantum error correction in a solid state ensemble quantum information processor. Phys. Rev. Lett. 107, 160501 (2011). - PubMed
-
- Chiaverini J. et al. Realization of quantum error correction. Nature 432, 602–605 (2004). - PubMed
-
- Schindler P. et al. Experimental repetitive quantum error correction. Science 332, 1059–1061 (2011). - PubMed
Publication types
LinkOut - more resources
Full Text Sources
Other Literature Sources
Molecular Biology Databases
