. 2015 Apr 29;10(4):e0125631.
doi: 10.1371/journal.pone.0125631. eCollection 2015.

A comparison of some organizational characteristics of the mouse central retina and the human macula

Affiliations

A comparison of some organizational characteristics of the mouse central retina and the human macula

Stefanie Volland et al. PLoS One. .

Abstract

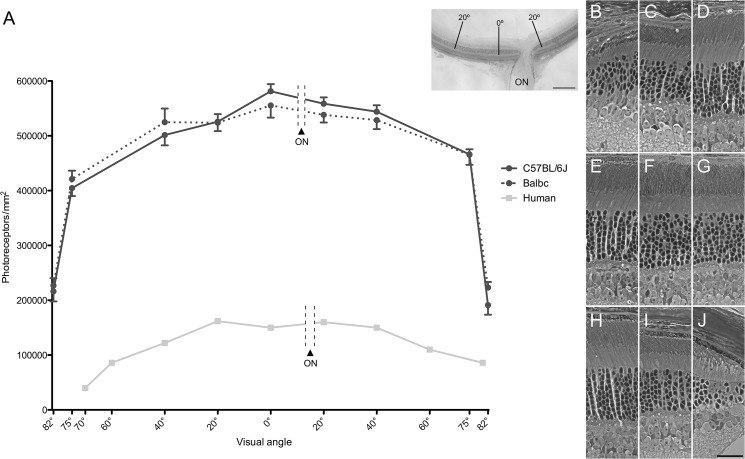
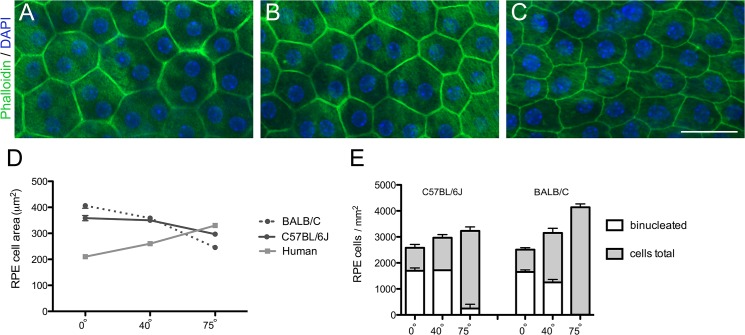
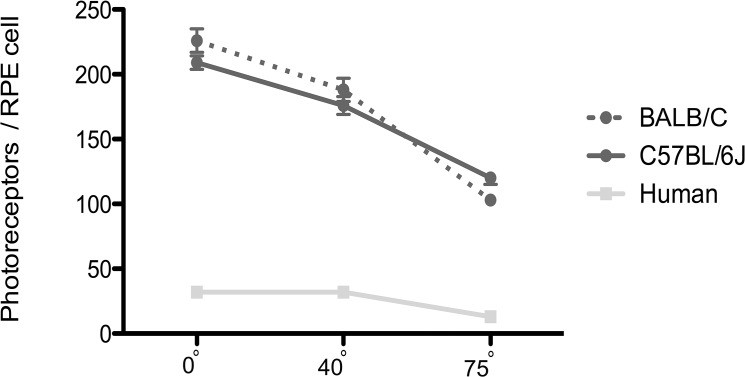
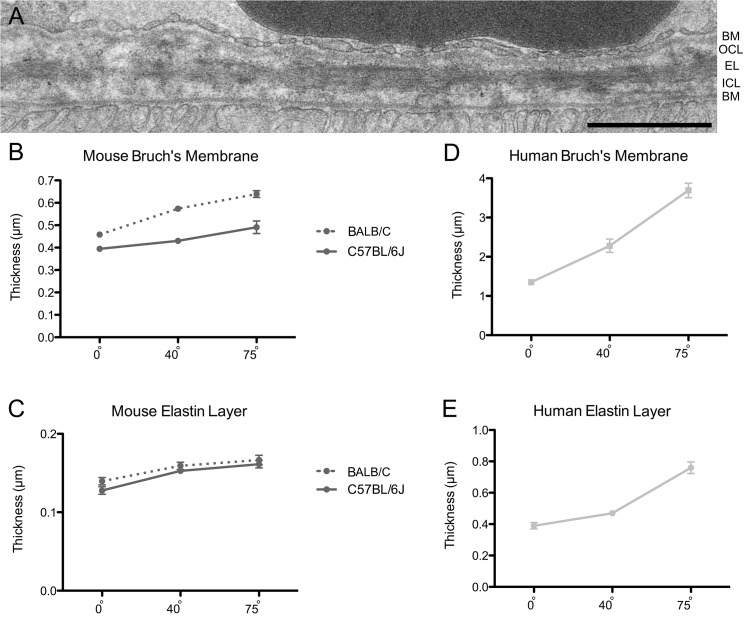
Mouse models have greatly assisted our understanding of retinal degenerations. However, the mouse retina does not have a macula, leading to the question of whether the mouse is a relevant model for macular degeneration. In the present study, a quantitative comparison between the organization of the central mouse retina and the human macula was made, focusing on some structural characteristics that have been suggested to be important in predisposing the macula to stresses leading to degeneration: photoreceptor density, phagocytic load on the RPE, and the relative thinness of Bruch's membrane. Light and electron microscopy measurements from retinas of two strains of mice, together with published data on human retinas, were used for calculations and subsequent comparisons. As in the human retina, the central region of the mouse retina possesses a higher photoreceptor cell density and a thinner Bruch's membrane than in the periphery; however, the magnitudes of these periphery to center gradients are larger in the human. Of potentially greater relevance is the actual photoreceptor cell density, which is much greater in the mouse central retina than in the human macula, underlying a higher phagocytic load for the mouse RPE. Moreover, at eccentricities that correspond to the peripheral half of the human macula, the rod to cone ratio is similar between mouse and human. Hence, with respect to photoreceptor density and phagocytic load of the RPE, the central mouse retina models at least the more peripheral part of the macula, where macular degeneration is often first evident.


Conflict of interest statement

Competing Interests: The authors have declared that no competing interests exist.

Figures

Fig 1
Fig 1. Comparison of photoreceptor distribution in mouse and human retinas.
(A) Graph showing the photoreceptor density per mm2 in mouse and human. Data from the visual angles of 0°, 20° and 40° were collected at distances of 0, 0.6 and 1.2 mm, respectively, from the center of the mouse retina, along the dorso-ventral axis (shown left to right; ON indicates the location of the optic nerve head, which is just ventral from the center). Data from the visual angles of 75° and 82° were collected from regions centered at distances of 250 and 50 μm from the ora serrata, which approximated to 2.3 and 2.5 mm from the center. Error bars indicate SEM. Inset shows a low power micrograph of a dorso-ventral section passing through the optic nerve head and the center of the retina (0°); scale bar = 0.3 mm. The human data are from temporal to nasal, as reported by Osterberg [38]. Visual angles of 20°, 40°, 60° and 70° correspond to distances of 6, 12, 18 and 20 mm from the fovea. (B-J) Representative light microscopic images of the regions sampled along the dorsoventral axis of the mouse retinas. Examples from both the BALB/C and C57BL/6J strains are included. (B) 82° dorsal, (C) 75° dorsal, (D) 40° dorsal, (E) 20° dorsal, (F) center, (G) 20° ventral, (H) 40° ventral, (I) 75° ventral, (J) 82° ventral. Scale bar = 25 μm.
Fig 2
Fig 2. RPE cell size and relative abundance of binucleate RPE cells across the mouse and human retina.
(A-C) Confocal images of a flatmount of a BALB/C mouse RPE, showing cells at retinal eccentricities of 0° (A), 40° (B), and 75° (C). Scale bar = 50 μm. (D) Graph of RPE cell cross-sectional area in relation to eccentricity in the mouse and human retinas. RPE cell size was significantly different between eccentricities in both mouse strains (P < 0.0001; Tukey’s test). (E) Graph of RPE cell density in relation to eccentricity in the mouse retinas, illustrating the proportion of binucleate cells, which was different between eccentricities in both mouse strains (P < 0.0001; Tukey’s test). Error bars in D and E indicate SEM. The human data are from Ts’o and Friedman [39].
Fig 3
Fig 3. The number of photoreceptors per RPE cell in mouse and human eyes.
This cell ratio differed at different eccentricities in both mouse strains (P < 0.0001; Tukey’s test). The human data are from Osterberg [38] and Ts’o and Friedman [39].
Fig 4
Fig 4. Bruch’s membrane and elastin layer thickness.
(A) EM micrograph of Bruch’s membrane in a BALB/C mouse retina at an eccentricity of 40°. BM, Basement membrane; OC, Outer collagenous layer; EL, Elastin layer; ICL, Inner collagenous layer. Scale bar = 1 μm. (B, D) Graphs of the thickness of the entire Bruch’s membrane in relation to eccentricity in mouse and human retinas. (C, E) Graphs of the thickness of the elastin layer of Bruch’s membrane in relation to eccentricity in mouse and human retinas. The thickness of Bruch's membrane as well as the elastin layer varied very significantly between retinal eccentricities in both mouse strains (P < 0.0001; Tukey’s test). Error bars indicate SEM. The human data, shown in D and E, are from Newsome et al. [18].

References

    1. Keeler CE. The Inheritance of a Retinal Abnormality in White Mice. Proc Natl Acad Sci U S A. 1924;10(7):329–33. Epub 1924/07/01. - PMC - PubMed
    1. Baehr W, Frederick JM. Naturally occurring animal models with outer retina phenotypes. Vision Res. 2009;49(22):2636–52. Epub 2009/04/21. 10.1016/j.visres.2009.04.008 - DOI - PMC - PubMed
    1. Dalke C, Graw J. Mouse mutants as models for congenital retinal disorders. Exp Eye Res. 2005;81(5):503–12. Epub 2005/07/20. 10.1016/j.exer.2005.06.004 . - DOI - PubMed
    1. Klein R, Klein BE, Tomany SC, Meuer SM, Huang GH. Ten-year incidence and progression of age-related maculopathy: The Beaver Dam eye study. Ophthalmology. 2002;109(10):1767–79. Epub 2002/10/03. . - PubMed
    1. Friedman DS, O'Colmain BJ, Munoz B, Tomany SC, McCarty C, de Jong PT, et al. Prevalence of age-related macular degeneration in the United States. Arch Ophthalmol. 2004;122(4):564–72. Epub 2004/04/14. 10.1001/archopht.122.4.564 . - DOI - PubMed

Publication types