Meta-Analysis
. 2015 Apr 29;10(4):e0124967.
doi: 10.1371/journal.pone.0124967. eCollection 2015.

Gene-gene and gene-environment interactions in meta-analysis of genetic association studies

Affiliations
Meta-Analysis

Gene-gene and gene-environment interactions in meta-analysis of genetic association studies

Chin Lin et al. PLoS One. .

Abstract

Extensive genetic studies have identified a large number of causal genetic variations in many human phenotypes; however, these could not completely explain heritability in complex diseases. Some researchers have proposed that the "missing heritability" may be attributable to gene-gene and gene-environment interactions. Because there are billions of potential interaction combinations, the statistical power of a single study is often ineffective in detecting these interactions. Meta-analysis is a common method of increasing detection power; however, accessing individual data could be difficult. This study presents a simple method that employs aggregated summary values from a "case" group to detect these specific interactions that based on rare disease and independence assumptions. However, these assumptions, particularly the rare disease assumption, may be violated in real situations; therefore, this study further investigated the robustness of our proposed method when it violates the assumptions. In conclusion, we observed that the rare disease assumption is relatively nonessential, whereas the independence assumption is an essential component. Because single nucleotide polymorphisms (SNPs) are often unrelated to environmental factors and SNPs on other chromosomes, researchers should use this method to investigate gene-gene and gene-environment interactions when they are unable to obtain detailed individual patient data.


Conflict of interest statement

Competing Interests: The authors have declared that no competing interests exist.

Figures

Fig 1
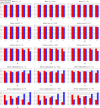
Fig 1. Confidence interval coverage rate of the allele effect in people without a moderator (β 1) and people with a moderator (β 1 + β 3) using our proposed method.
The model names, “Basic,” “Minor rare,” “Serious rare,” “Minor independence,” and “Serious independence” indicate the models, “Basic,” “Minor violation of rare disease assumption,” “Serious violation of rare disease assumption,” “Minor violation of independence assumption,” and “Serious violation of independence assumption,” respectively. F st is the parameter of frequency difference among various studies. The X-axis represents the confidence interval of the moderator effect (β 3); the Y-axis represents the 95% confidence interval coverage rate. The red bar represents the 95% confidence interval coverage rate of the allele effect in people without a moderator (β 1); the blue bar represents the 95% confidence interval coverage rate of the allele effect in people with a moderator (β 1 + β 3).
Fig 2
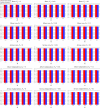
Fig 2. Confidence interval coverage rate of the allele effect in people without a moderator (β 1) and people with a moderator (β 1 + β 3) in individual patient data regression analysis.
The model names, “Basic,” “Minor rare,” “Serious rare,” “Minor independence,” and “Serious independence” indicate the models, “Basic,” “Minor violation of rare disease assumption,” “Serious violation of rare disease assumption,” “Minor violation of independence assumption,” and “Serious violation of independence assumption,” respectively. F st is the parameter of frequency difference among various studies. The X-axis represents the confidence interval of the moderator effect (β 3); the Y-axis represents the 95% confidence interval coverage rate. The red bar represents the 95% confidence interval coverage rate of the allele effect in people without a moderator (β 1); the blue bar represents the 95% confidence interval coverage rate of the allele effect in people with a moderator (β 1 + β 3).

References

    1. Manolio TA, Collins FS, Cox NJ, Goldstein DB, Hindorff LA, Hunter DJ, et al. Finding the missing heritability of complex diseases. Nature. 2009;461(7265):747–53. 10.1038/nature08494 - DOI - PMC - PubMed
    1. Storey JD. A direct approach to false discovery rates. J R Statist Soc B. 2002;64(3):479–98.
    1. McClelland GH, Judd CM. Statistical difficulties of detecting interactions and moderator effects. Psychological bulletin. 1993;114(2):376–90. - PubMed
    1. Brookes ST, Whitely E, Egger M, Smith GD, Mulheran PA, Peters TJ. Subgroup analyses in randomized trials: risks of subgroup-specific analyses; power and sample size for the interaction test. Journal of clinical epidemiology. 2004;57(3):229–36. 10.1016/j.jclinepi.2003.08.009 - DOI - PubMed
    1. Thompson SG, Higgins JP. How should meta-regression analyses be undertaken and interpreted? Statistics in medicine. 2002;21(11):1559–73. 10.1002/sim.1187 - DOI - PubMed

Publication types

LinkOut - more resources