. 2015 Apr 29:6:7064.
doi: 10.1038/ncomms8064.

Crystalline silica-induced leukotriene B4-dependent inflammation promotes lung tumour growth

Affiliations

Crystalline silica-induced leukotriene B4-dependent inflammation promotes lung tumour growth

Shuchismita R Satpathy et al. Nat Commun. .

Abstract

Chronic exposure to crystalline silica (CS) causes silicosis, an irreversible lung inflammatory disease that may eventually lead to lung cancer. In this study, we demonstrate that in K-ras(LA1) mice, CS exposure markedly enhances the lung tumour burden and genetic deletion of leukotriene B4 receptor-1 (BLT1(-/-)) attenuates this increase. Pulmonary neutrophilic inflammation induced by CS is significantly reduced in BLT1(-/-)K-ras(LA1) mice. CS exposure induces LTB4 production by mast cells and macrophages independent of inflammasome activation. In an air-pouch model, CS-induced neutrophil recruitment is dependent on LTB4 production by mast cells and BLT1 expression on neutrophils. In an implantable lung tumour model, CS exposure results in rapid tumour growth and decreased survival that is attenuated in the absence of BLT1. These results suggest that the LTB4/BLT1 axis sets the pace of CS-induced sterile inflammation that promotes lung cancer progression. This knowledge may facilitate development of immunotherapeutic strategies to fight silicosis and lung cancer.


Figures

Figure 1
Figure 1. CS-promoted lung tumor progression is abrogated in the absence of BLT1
Forty five days old BLT1+/+K-rasLA1 and BLT1−/−K-rasLA1 mice were exposed to CS by intra-tracheal instillation as described in methods. Sixty days post CS instillation; lungs from these mice were analyzed for CS particle deposition and tumor multiplicity. (a) Representative lung H&E sections showing deposited CS particles; scale bars, 100μm; insets show CS particles at higher magnification. (b) Lung CS exposure was determined based on semi-quantitative scoring (scale of 0-3) of CS particle deposition in sections; n=5 for both groups. (c) Representative lung lobe sections showing adenomas; scale bars, 1mm. (d) Quantification of adenomas from all serial lung sections of different groups of animals and treatments as indicated; V indicates vehicle (PBS) alone treatment. The number of mice in each group are, untreated BLT1+/+K-rasLA1 (n=7); PBS treated BLT1+/+K-rasLA1 (n=5); CS treated BLT1+/+K-rasLA1 (n=10); untreated BLT1−/−K-rasLA1 (n=7); CS treated BLT1−/−K-rasLA1 (n=10). Error bars in b and d denote mean ± SEM.*P < 0.025, ***P < 0.0003, n.s is non-significant; Mann Whitney U-test.
Figure 2
Figure 2. Absence of BLT1 attenuates lung inflammation in K-rasLA1 mice
Lungs from BLT1+/+K-rasLA1 and BLT1−/−K-rasLA1 mice exposed to CS for 60 days were assessed for inflammation and inflammatory cell recruitment. (a) Representative lung H&E sections show inflammation post CS treatment; scale bars, 100μm. (b) Lung inflammation was scored as the percentage of inflamed lung area to total lung area in H&E stained lung sections. The number of mice in each group are, PBS treated BLT1+/+K-rasLA1 (n=3); CS treated BLT1+/+K-rasLA1 (n=8); CS treated BLT1−/−K-rasLA1 (n=10). (c) CS exposure induced recruitment of neutrophils, macrophages and lymphocytes into airways was assessed in whole lung lavage by flow cytometry as described in methods. The number of mice in each group are, PBS treated BLT1+/+K-rasLA1 (n=3); CS treated BLT1+/+K-rasLA1 (n=4); CS treated BLT1−/−K-rasLA1 (n=5). Error bars in b, c denote mean ± SEM. *P < 0.04 Mann Whitney U-test.
Figure 3
Figure 3. Attenuation of CS-induced lung neutrophil recruitment in the absence of BLT1
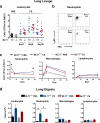
Eight weeks old BLT1+/+ and BLT1−/− mice were exposed to CS. Inflammatory cell recruitment into airways (a-c) and lung interstitium (d) was assessed by flow cytometry using surface staining for cell specific markers. Analysis of whole lung lavage at indicated times show (a) number of total leukocytes; each dot represents a single mouse, (b) neutrophils 2 days post CS exposure in the flow-cytometry scatter plots and (c) number of neutrophils, macrophages and lymphocytes. Data represent at least 11 mice per group; difference between CS treated BLT1+/+ and BLT1−/− group is indicated. (d) Analysis of unlavaged whole lung digests 2 days post CS exposure show number of total leukocytes, neutrophils, macrophages and lymphocytes. The number of mice in each group are, PBS treated BLT1+/+ (n=3); CS treated BLT1+/+ (n=5); PBS treated BLT1−/− (n=5); CS treated BLT1−/− (n=6). Error bars denote mean ± SEM. *P < 0.04 Mann Whitney U-test.
Figure 4
Figure 4. CS-induced neutrophil chemoattractants remain unaffected in the absence of BLT1
Mediators of CS-induced pulmonary inflammation were analyzed by accessing production of (a-b) LTB4 in whole lung lavage fluids and (c-d) cytokines and chemokines in total lung RNA. LTB4 levels in lung lavage fluids of (a) CS exposed BLT1+/+ and BLT1−/− mice at indicated times and (b) of BLT1+/+K-rasLA1 and BLT1−/−K-rasLA1 mice exposed to CS for 60 days. Data are from at least 5 mice per group. Quantitative real-time PCR analysis of total lung RNA showing fold increase of neutrophil-active cytokines and chemokines in (c) BLT1+/+ and BLT1−/− mice exposed to CS for 2 days and (d) BLT1+/+K-rasLA1 and BLT1−/−K-rasLA1 mice exposed to CS for 60 days. Fold change of mRNA levels over PBS treated BLT1+/+ samples are shown; differences in mRNA levels are not significant between the CS exposed BLT1+/+ and BLT1−/− groups. Data represent at least 5 mice per group; error bars denote mean ± SEM. *P < 0.03, **P < 0.009, ***P < 0.0007; Unpaired t-test.
Figure 5
Figure 5. Cell type specificity of CS-induced LTB4 and IL-1β production
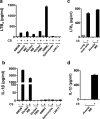
Lung epithelial cell line (LKR13) and primary cells: macrophages, mast cells, neutrophils, splenocytes from wild-type (WT) were assessed for production of LTB4 and IL-1β in vitro post CS stimulation. In triplicate cultures 0.3 × 10⁶ of the indicated cell types were stimulated with 100μg/cm2 of CS for six hours. (a) LTB4 levels in culture supernatants of CS exposed ex-vivo cultured immune cells and lung epithelial cell line (LKR13) as indicated; MØ is macrophage, PMN is neutrophil, BMDM is bone-marrow derived macrophages, BMMC is bone-marrow derived mast cells. (b) IL-1β levels in the same culture supernatants as in panel a. The CS-induced LTB4 (c) and IL-1β (d) production was determined in culture supernatants of alveolar macrophages and lung mast cells. Alveolar macrophages and lung mast cells were purified as described in methods and exposed to CS in vitro. Purity of the cell types were determined by flow cytometry. Thioglycollate elicited neutrophils and macrophages; resident peritoneal macrophages; lung mast cells were ≥ 95% pure, whereas BMMC, BMDM and alveolar macrophages were ≥ 99% pure. Error bars denote mean ± SEM. Data are representative of at least two independent experiments in triplicate cultures.
Figure 6
Figure 6. Independent regulation of LTB4 and IL-1β production in CS exposed cells
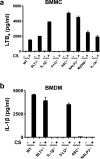
Interdependence of CS-induced LTB4 and IL-1β production was determined in cultured bone-marrow derived mast cells (BMMC) and bone-marrow derived macrophages (BMDM) from different gene knockout mice as indicated. In triplicate cultures 0.3 × 10⁶ of (a) BMMCs or (b) BMDMs were stimulated with 100μg/cm2 of CS for six hours and (a) LTB4 and (b) IL-1β levels were determined by EIA or ELISA, respectively. Purity of the cells was determined by flow cytometry. All cell types of indicated genotypes were ≥ 99% pure. Error bars denote mean ± SEM. Data are representative of at least two independent experiments performed in triplicate cultures.
Figure 7
Figure 7. CS-induced neutrophil recruitment into the air pouch is dependent on LTB4/BLT1 axis
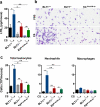
CS induced inflammation in an air pouch was analyzed. Six hours post CS particle exposure the air pouch was lavaged with 3ml of buffer to assess LTB4 levels and infiltrating immune cells. (a) LTB4 levels, (b) leukocytes on cytospin slides and (c) total leukocytes, neutrophils and macrophages as identified by flow cytometry of the air pouch lavage fluid from mice of the indicated genotypes. Data are representative of at least five mice per group. Error bars denote mean ± SEM. *P < 0.02, **P <0.009; Mann Whitney U-test.
Figure 8
Figure 8. Absence of BLT1 protects from CS- promoted growth of implanted lung tumors
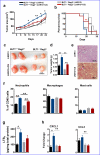
LKR13 cells along with CS particles were implanted subcutaneously into BLT1+/+Rag2−/− or BLT1−/−Rag2−/− mice and the kinetics of tumor growth, survival of mice and tumor inflammatory microenvironment was analyzed. (a) Tumor size in mice of indicated genotype and treatment are shown. The number of mice in each group are, LKR13 injected BLT1+/+Rag2−/− (n=12); LKR13 with CS injected BLT1+/+Rag2−/−(n=10); LKR13 injected BLT1−/−Rag2−/− (n=6); LKR13 with CS injected BLT1−/−Rag2−/−(n=7). (b) Kaplan-Meier survival curves of tumor bearing mice are shown. Data represent 8 mice per group; *** (black) indicates comparison between LKR13 and LKR13 with CS injected BLT1+/+Rag2−/− groups; ** (red) indicates comparison between LKR13 with CS injected BLT1+/+Rag2−/− and BLT1−/−Rag2−/− groups. (c) Representative images of tumors sixteen days post implantation for the indicated genotype and treatment are shown; scale bars, 1cm. (d) Tumor weights at day 16 of LKR13 injected BLT1+/+Rag2−/− (n=4); LKR13 with CS injected BLT1+/+Rag2−/−(n=6); LKR13 injected BLT1−/−Rag2−/− (n=5); LKR13 with CS injected BLT1−/−Rag2−/−(n=7). (e) Deposited CS particles in tumor sections viewed under polarized light; scale bars, 100 μm; insets show CS particles at higher magnification. (f) Neutrophils, macrophages and mast cells expressed as percent of total tumor infiltrating immune cells identified by flow cytometry are shown. (g) LTB4 levels measured in tumor homogenates and (h) quantitative real-time PCR analysis of total tumor RNA showing fold increase of neutrophil-active chemokines; fold change over BLT1+/+Rag2−/− injected with LKR13 cells is shown. In f-h the number of mice in each group are, LKR13 injected BLT1+/+Rag2−/− (n=4), LKR13 injected BLT1−/−Rag2−/− (n=4), LKR13 with CS injected BLT1+/+Rag2−/− (n=7) and LKR13 with CS injected BLT1/Rag2−/− (n=7). Error bars denote mean ± SEM. *P < 0.02, **P <0.009, ***P < 0.0007; Mann Whitney U-test.
Figure 9
Figure 9. A schematic model for the role of LTB4-BLT1 axis in CS accelerated lung tumor growth
Spontaneous activation of K-ras gene in the lungs induces an inflammatory microenvironment (intrinsic pathway) that promotes cancer-related inflammation and tumor growth. This study shows that exposure to crystalline silica particles induces chronic inflammation (extrinsic pathway) which likely accelerates lung tumor growth. LTB4 produced by mast cells and IL1β, LTB4, CXC/CC chemokines by macrophages and CXC/CC chemokines by lung epithelial cells in response to CS exposure leads to sustained neutrophil accumulation. LTB4/BLT1 axis sets the pace of CS induced sterile inflammation thereby promoting lung tumor progression.

References

    1. Mantovani A, et al. Cancer-related inflammation. Nature. 2008;454(7203):436–44. - PubMed
    1. Houghton AM. Mechanistic links between COPD and lung cancer. Nat Rev Cancer. 2013;13(4):233–45. - PubMed
    1. Colotta F, et al. Cancer-related inflammation, the seventh hallmark of cancer: links to genetic instability. Carcinogenesis. 2009;30(7):1073–81. - PubMed
    1. Russo M, Di Nicolantonio F, Bardelli A. Climbing RAS, the everest of oncogenes. Cancer Discov. 2014;4(1):19–21. - PubMed
    1. Ji H, et al. K-ras activation generates an inflammatory response in lung tumors. Oncogene. 2006;25(14):2105–12. - PubMed

Publication types

MeSH terms