

Allogeneic IgG combined with dendritic cell stimuli induce antitumour T-cell immunity
- PMID: 25924063
- PMCID: PMC4877172
- DOI: 10.1038/nature14424
Allogeneic IgG combined with dendritic cell stimuli induce antitumour T-cell immunity
Abstract
Whereas cancers grow within host tissues and evade host immunity through immune-editing and immunosuppression, tumours are rarely transmissible between individuals. Much like transplanted allogeneic organs, allogeneic tumours are reliably rejected by host T cells, even when the tumour and host share the same major histocompatibility complex alleles, the most potent determinants of transplant rejection. How such tumour-eradicating immunity is initiated remains unknown, although elucidating this process could provide the basis for inducing similar responses against naturally arising tumours. Here we find that allogeneic tumour rejection is initiated in mice by naturally occurring tumour-binding IgG antibodies, which enable dendritic cells (DCs) to internalize tumour antigens and subsequently activate tumour-reactive T cells. We exploited this mechanism to treat autologous and autochthonous tumours successfully. Either systemic administration of DCs loaded with allogeneic-IgG-coated tumour cells or intratumoral injection of allogeneic IgG in combination with DC stimuli induced potent T-cell-mediated antitumour immune responses, resulting in tumour eradication in mouse models of melanoma, pancreas, lung and breast cancer. Moreover, this strategy led to eradication of distant tumours and metastases, as well as the injected primary tumours. To assess the clinical relevance of these findings, we studied antibodies and cells from patients with lung cancer. T cells from these patients responded vigorously to autologous tumour antigens after culture with allogeneic-IgG-loaded DCs, recapitulating our findings in mice. These results reveal that tumour-binding allogeneic IgG can induce powerful antitumour immunity that can be exploited for cancer immunotherapy.
Figures
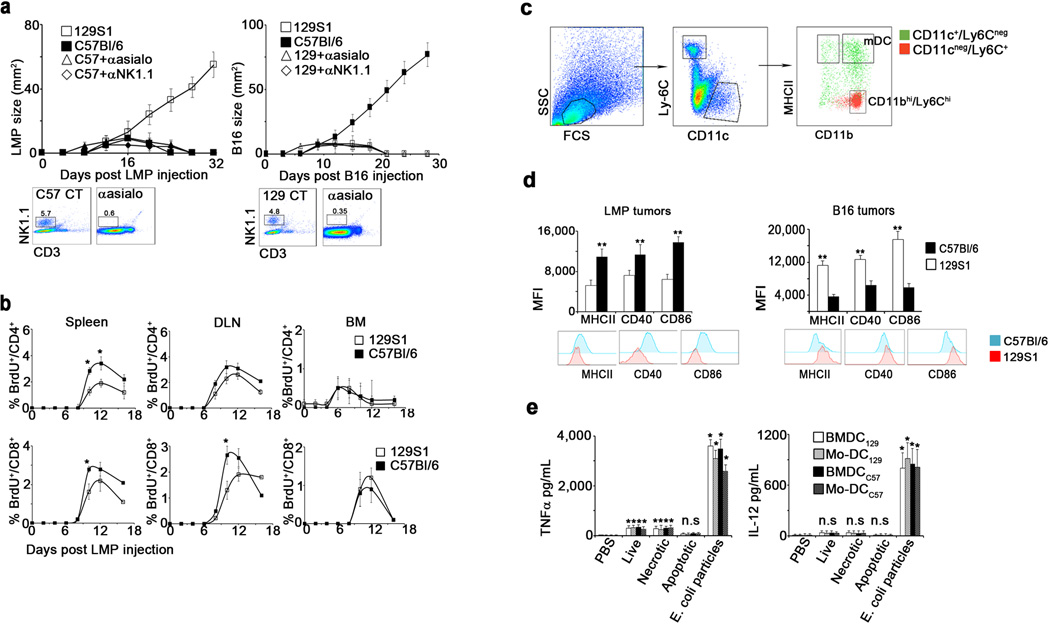
 ) C57Bl/6 (
 ), or allogeneic hosts pretreated with anti-asialo-GM1 (
 ) or anti-NK1.1 antibodies (
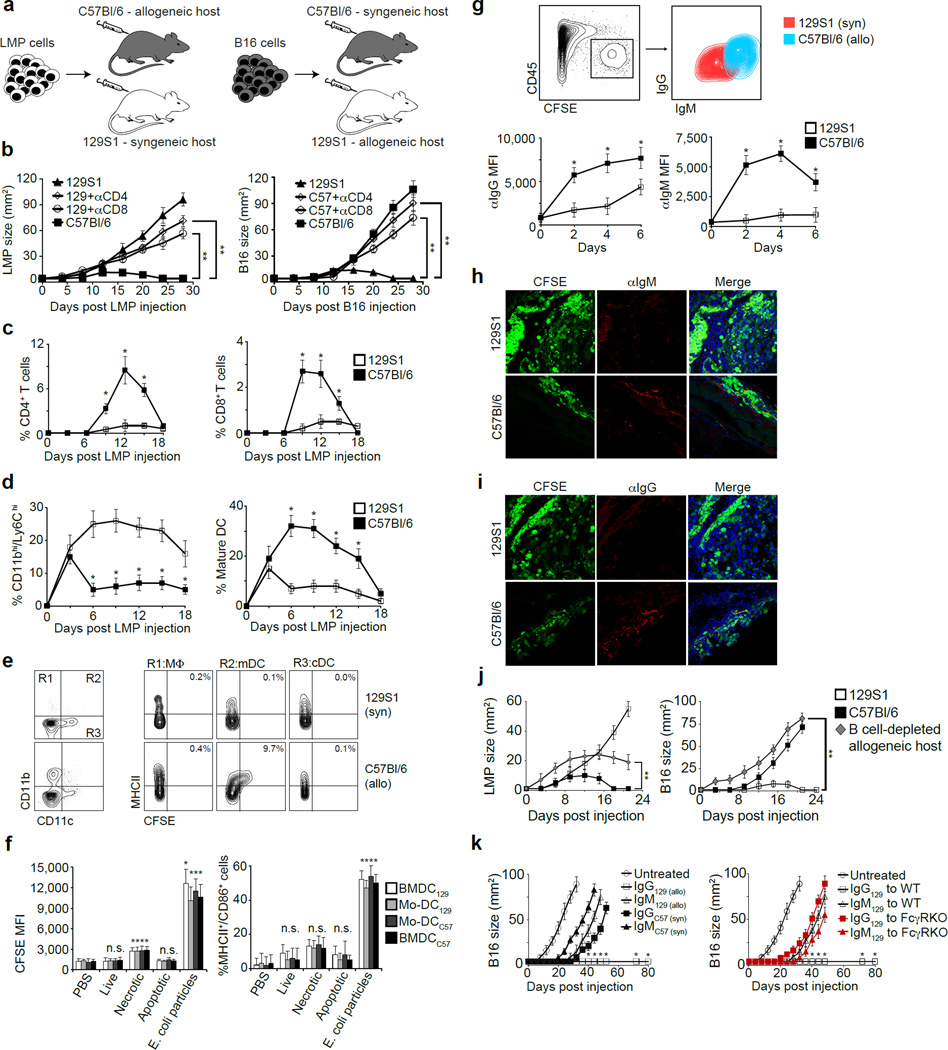
 ) (n=6). Shown are representative plots of NK cells in the blood prior to tumor challenge. b. BrdU incorporation by CD4+ T cells (top graphs) and CD8+ T cells (bottom graphs) in lymphoid organs of 129S1 () and C57Bl/6 () LMP-bearing mice (n=8). c. Representative flow cytometric analysis of CD11bhi/Ly6Chi myeloid cells and mature DC (mDC) on day 10 after C57Bl/6 mice were inoculated with B16 tumor cells. d. Flow cytometric analysis of Ly6Cneg/CD11c+/MHCII+ cells from LMP-bearing mice (left panel) and B16-bearing mice (right panel). Histograms show representative expression levels of co-stimulatory molecules on DC from C57Bl/6 (
 ) and 129S1 mice (
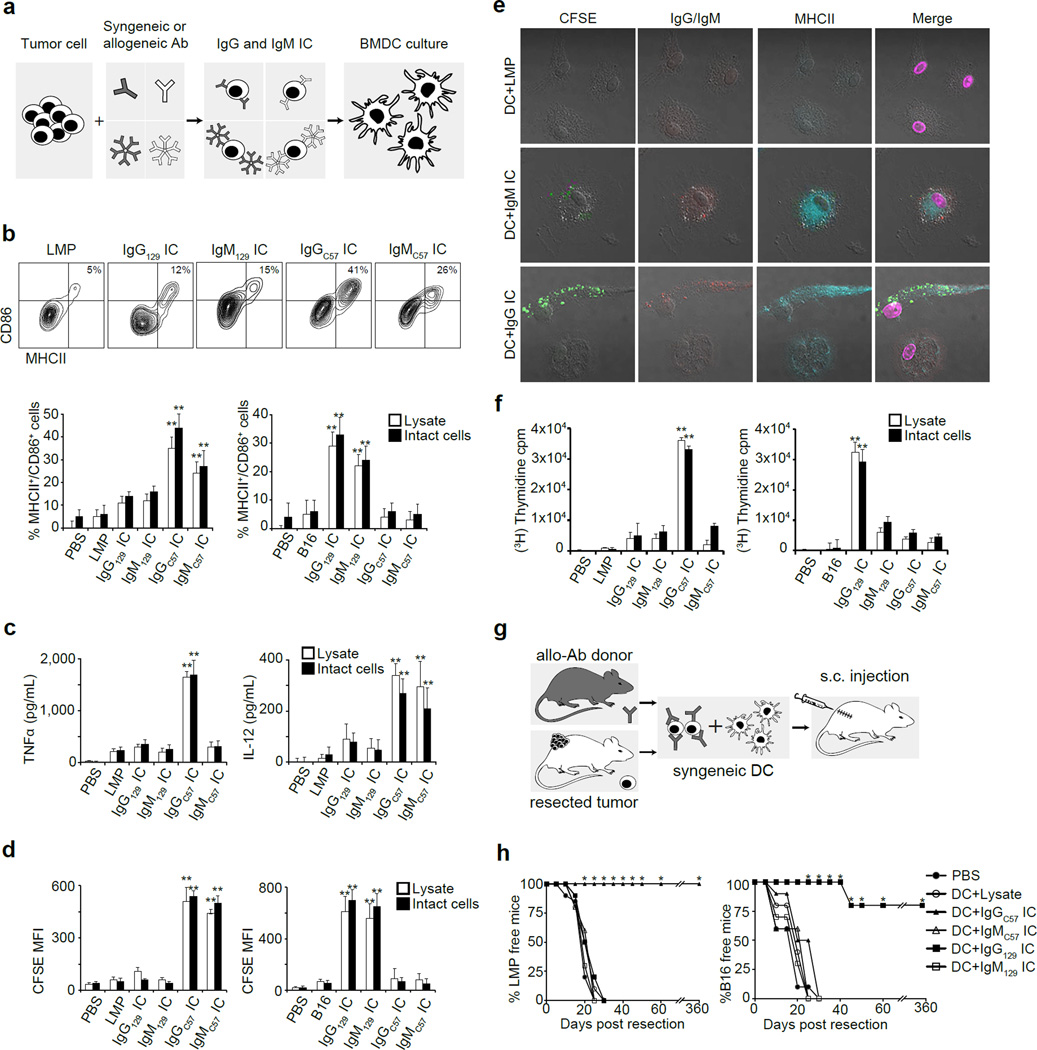
 ) (n=8). e. IL-12 (right) and TNFα (left) in the supernatants of syngeneic BMDC (), syngeneic blood monocyte-derived (Mo)-DC (
 ), allogeneic BMDC (
 ) or Mo-DC (
 ) incubated with live, frozen-thawed (necrotic), or mitomycin C-treated (apoptotic) LMP cells or E. coli BioParticles overnight (n=8). Shown are the mean values ±SEM from two independent experiments. Asterisk (*) denotes p<0.05 and two asterisks (**) denote p<0.01.
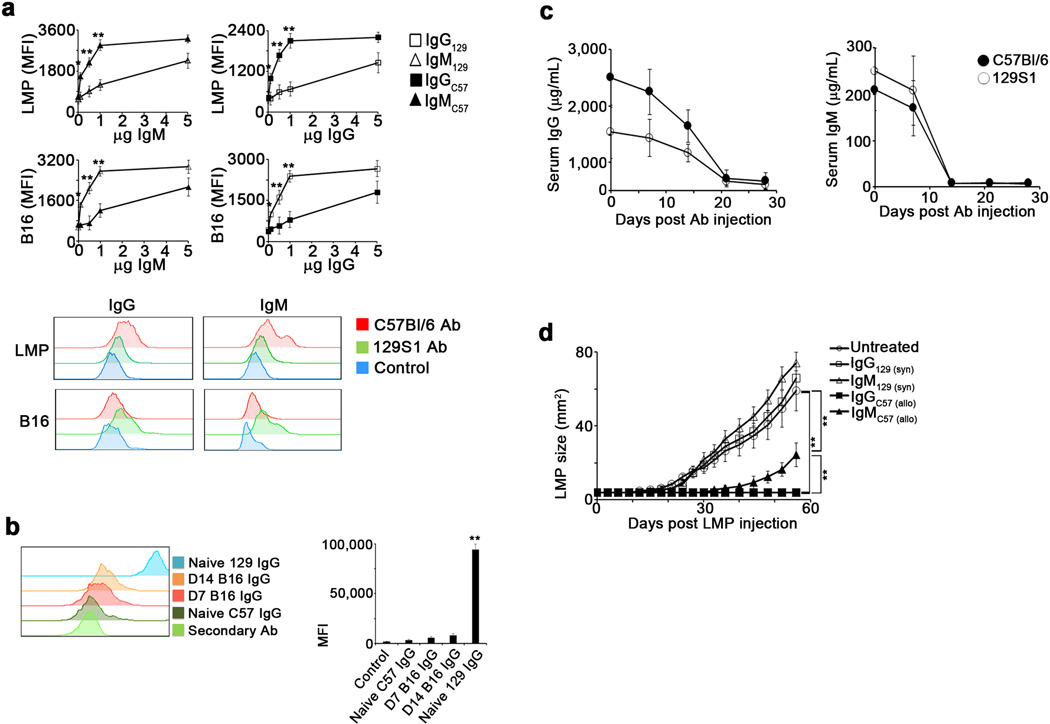 ), IgM from 129S1 (), IgG from C57Bl/6 () and IgM from C57Bl/6 mice (
 ) to LMP and B16 cells. The lower panel shows a representative histogram of IgG (left) or IgM (right) binding after incubation of 1µg of C57Bl/6 () or 129S1 (
 ) antibodies with 1x10⁵ LMP (upper) or B16 (lower) cells (n=8). b. The left panel shows a representative histogram of the MFI of IgG after incubation of 2µg of either control antibody () or IgG from the serum of naïve C57Bl/6 mice (
 ), B16-bearing C57Bl/6 mice on day 7 (), B16-bearing C57Bl/6 mice on day 14 (
 ) or naïve 129S1 mice () with 1x10⁵ B16 cells (n=6). Right graph shows MFI of the binding of 2µg of each IgG to 1x10⁵ B16 cells. c. Serum levels of IgG (left) and IgM (right) in C57Bl/6 () and 129S1 mice (
 ) following i.p injection with anti-B220 and anti-CD19 antibodies (n=8). d. LMP tumor size in naïve 129S1 mice injected with allogeneic IgG (), allogeneic IgM (), syngeneic IgG () or syngeneic IgM () on days −1 and 0 relative to tumor injection (n=6). Shown are the mean values ±SEM from two independent experiments. Asterisk (*) denotes p<0.05 and two asterisks (**) denote p<0.01.
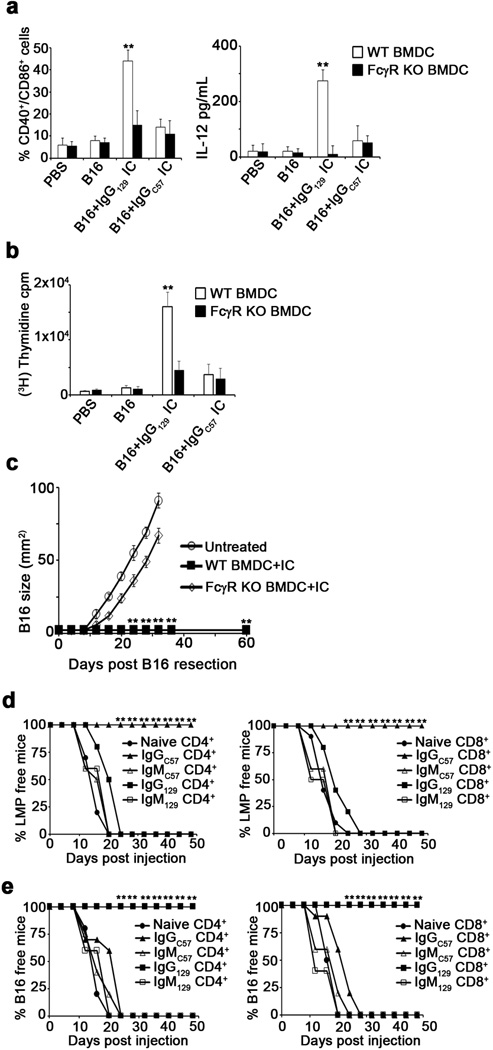 ) and FcγR KO mice () activated with IgG-IC overnight (n=6). b. Proliferation of CD4+ T cells cultured with BMDC from C57Bl/6 () and FcγR KO mice () loaded with IgG-IC (n=4). c. Tumor recurrence in untreated mice (), mice treated with WT BMDC loaded with IgG-IC (), or mice treated with FcγR KO BMDC loaded with IgG-IC (
 ) (n=8). d. and e. Percentages of tumor-free mice following adoptive transfer of 5x10⁶ splenic CD4+ T cells (left graph) or CD8+ T cells (right graph) from naïve mice (), or from LMP (d)- or B16 (e)-resected mice treated with DC+IgGC57 IC (), DC+IgMC57 IC (
 ), DC+IgG129 IC (), or DC+IgM129 IC (), and subsequently challenged with LMP (d) or B16 (e) (n=6). Shown are the mean values ±SEM from two independent experiments. Asterisks (**) denote p<0.01.
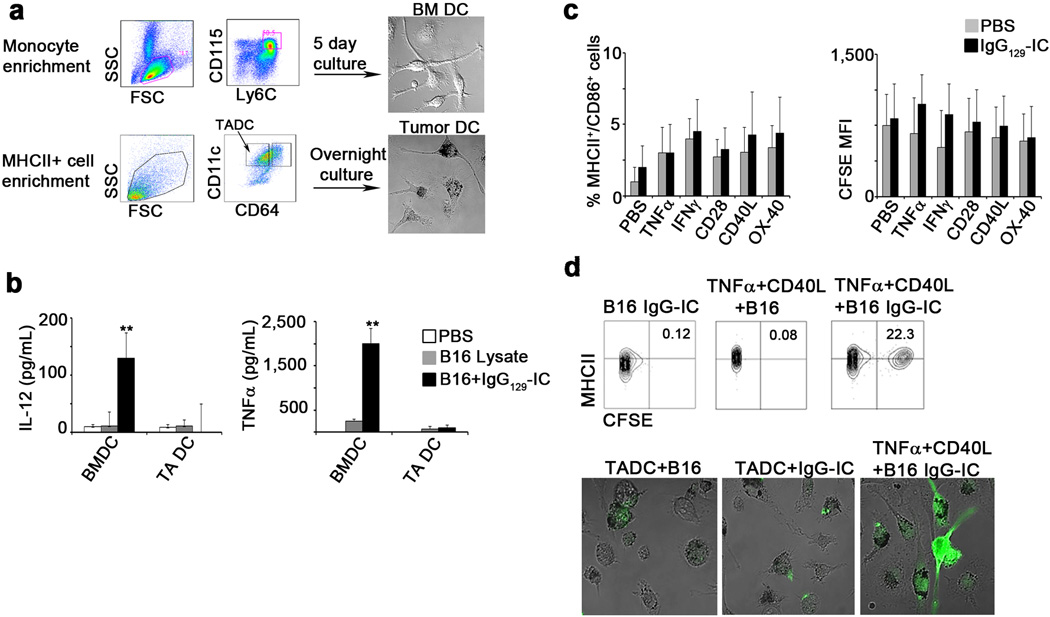
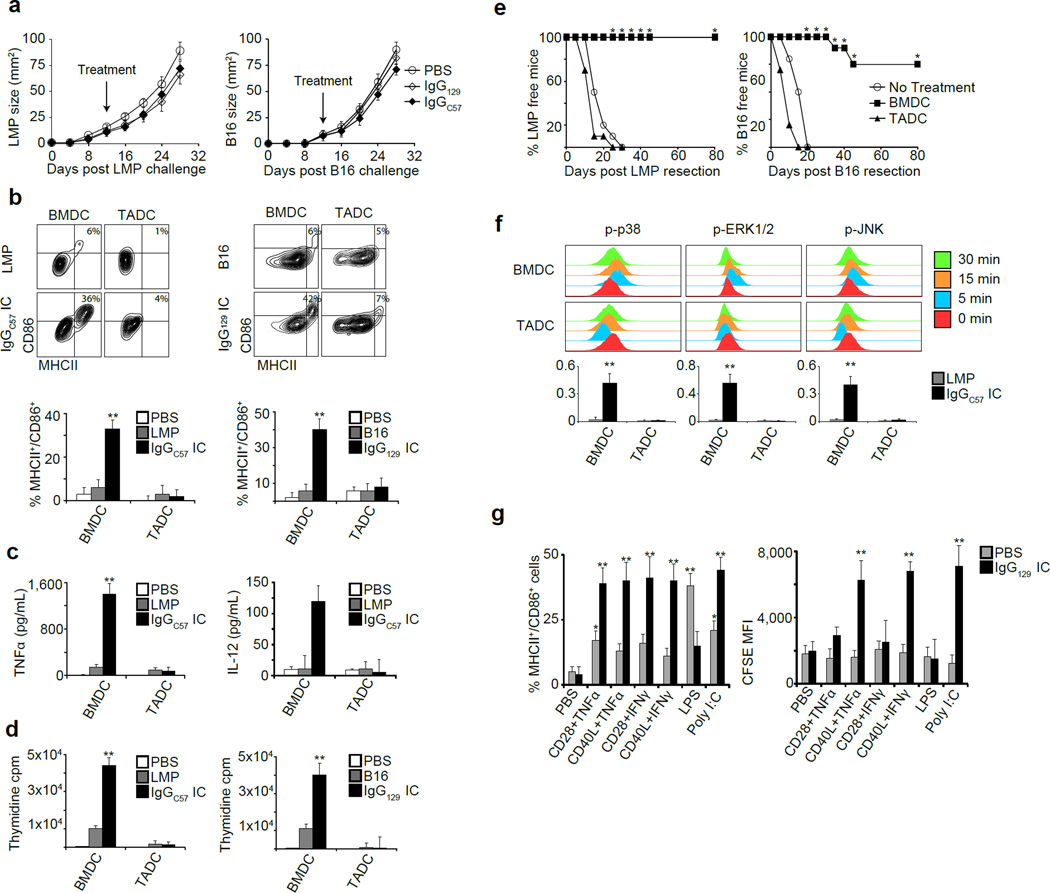
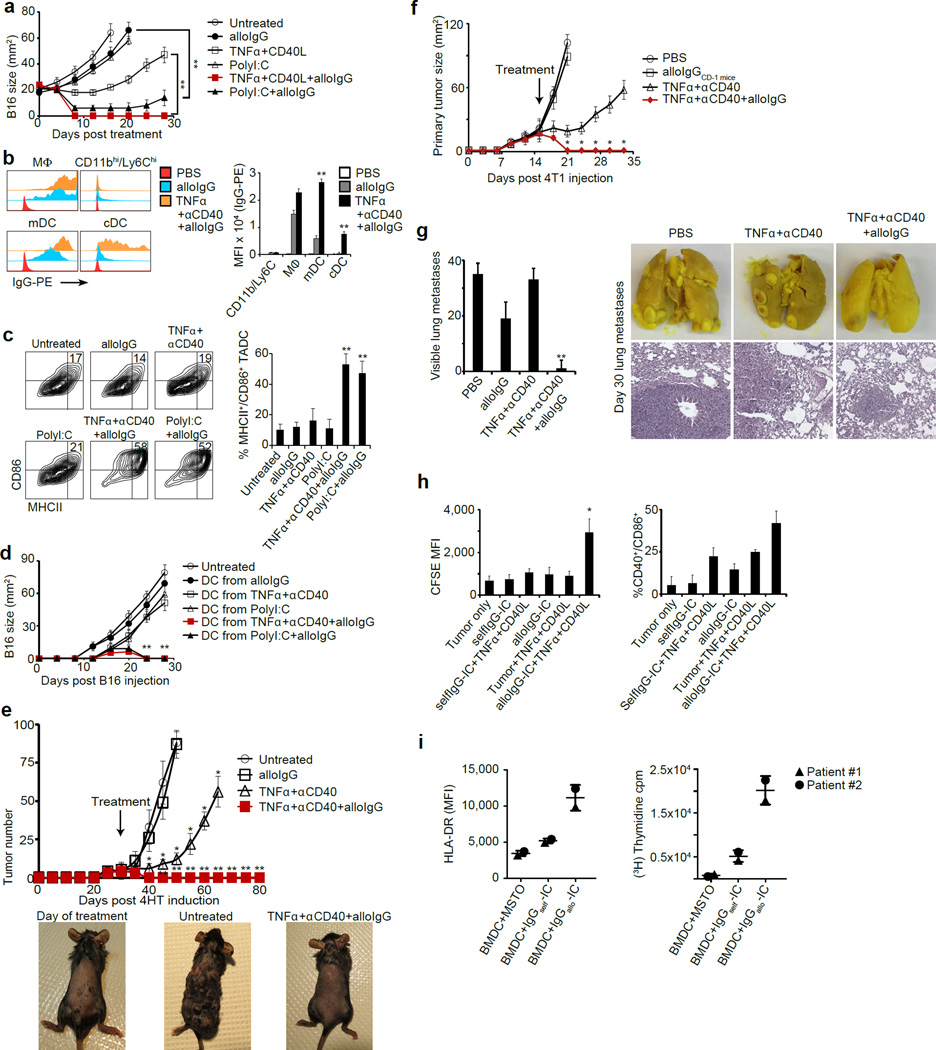
 ), or with alloIgG-IC () (n=6). c. Percentage of MHCII+/CD86+ cells (left panel) or CFSE levels (right panel) in tumor-associated DC following overnight activation with PBS () or CFSE-labeled alloIgG-IC () with or without stimulatory molecules (n=12). d. Representative flow cytometric analysis and confocal images from one out of three independent experiments of B16-derived DC cultured overnight with CFSE-labeled fixed B16 cells (n=8). Shown are the mean values ±SEM from three independent experiments Asterisk (*) denotes p<0.05 and two asterisks (**) denote p<0.01.
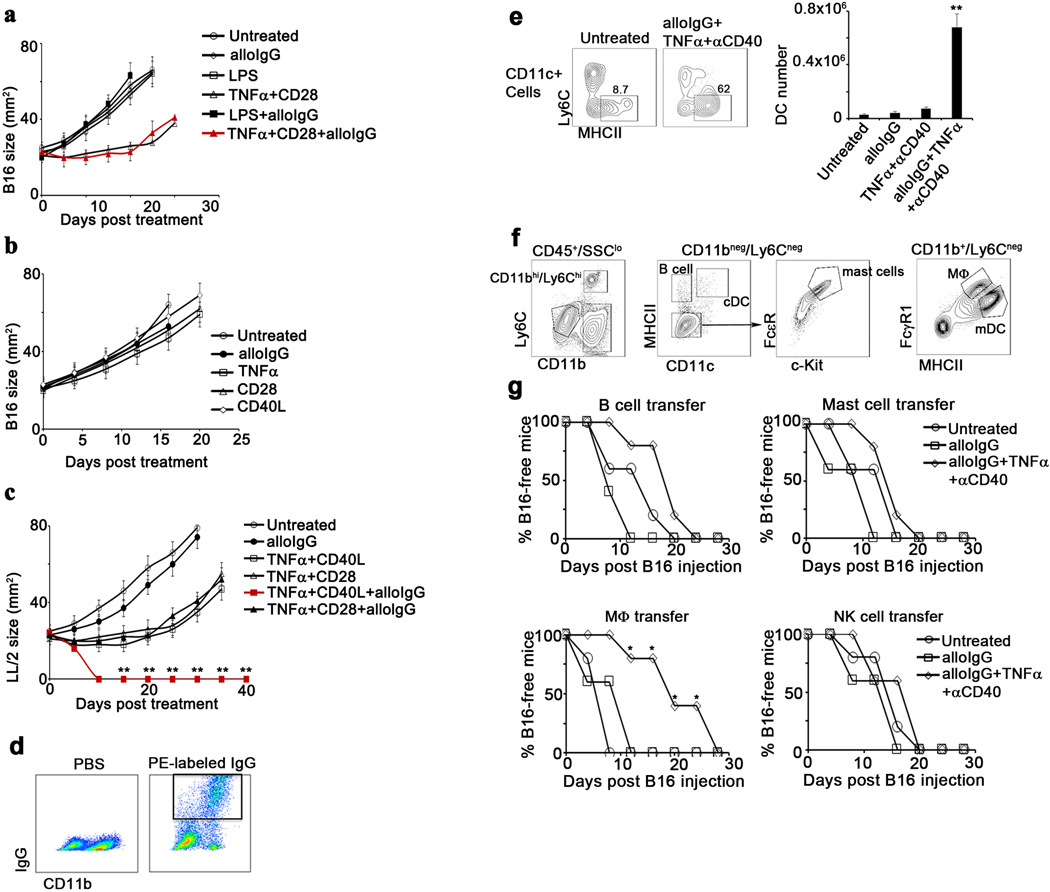 ) or injected intratumorally with 129S1 alloIgG (), LPS (), TNFα+CD28 (), LPS+alloIgG () or TNFα+CD28+alloIgG (
 ) (n=15). b. B16 tumor size in C57Bl/6 mice left untreated () or injected intratumorally with 129S1 alloIgG (), TNFα (), CD28 (), or CD40L () (n=12). c. LL/2 tumor size in C57Bl/6 mice left untreated (), or injected intratumorally with 129S1 alloIgG (), TNFα+CD40L (), TNFα+CD28 (), TNFα+CD40L+129S1 alloIgG (
 ) or TNFα+CD28+129S1 IgG () (n=8). d. Representative flow cytometric analysis from one out of three independent experiments of IgG binding total myeloid cells in B16 tumor-bearing mice 3 hours after intratumoral injection of PBS or 5µg PE-labeled alloIgG. e. Total numbers of CD11c+ cells in the draining lymph nodes of B16 tumor-bearing mice 4 days after treatment (n=6). f. Gating and sorting strategy of immune cell populations infiltrating B16 tumors. g. B16 growth in mice vaccinated with 2x10⁶ B cells, mast cells, macrophages or NK cells from B16 tumors untreated (), or injected with alloIgG () or alloIgG+TNFα+αCD40 () (n=6). Shown are the mean values ±SEM from two independent experiments. Asterisk (*) denotes p<0.05 and two asterisks (**) denote p<0.01.
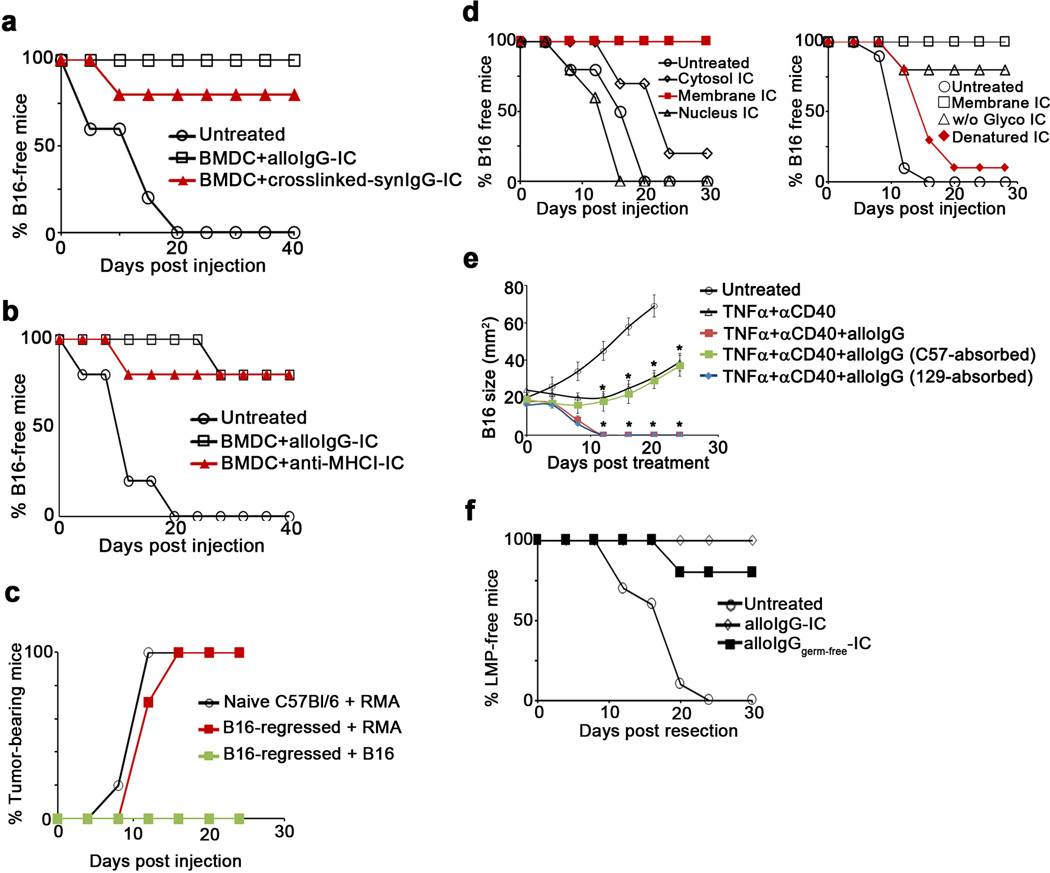 ), or treated with BMDC loaded with intact B16 cells coated with alloIgG (), or with intact B16 cells cross-linked to syngeneic IgG () (n=8). b. B16 tumor frequency in mice untreated () or treated with BMDC loaded with intact B16 cells coated with alloIgG () or with intact B16 coated with monoclonal IgG against MHC-I () (n=8). c. RMA tumor growth following inoculation with 2.5x10⁵ tumor cells in naïve C57Bl/6 mice (), or in C57Bl/6 mice in which B16 tumors had completely regressed following treatment with alloIgG+TNFα+αCD40 (). Also shown is the lack of B16 tumor growth in C57Bl/6 mice that were re-challenged with 2x10⁵ B16 tumor cells following the regression of this tumor after treatment with alloIgG+TNFα+αCD40 () (n=8). d. Left: Tumor frequency in mice untreated () or treated with DC loaded with IC formed with alloIgG and cytosolic tumor proteins (), nuclear tumor proteins () or membrane tumor proteins (). Right: Tumor frequency in mice untreated (), treated with DC loaded with IC formed from alloIgG and membrane proteins (), membrane proteins without O- and N-glycans (), or heat-denatured membrane proteins (
 ) (n=5). e. B16 tumor growth in C57Bl/6 mice untreated (), or injected with TNFα+αCD40 (), TNFα+αCD40+alloIgG (), or TNFα+αCD40 and alloIgG absorbed on normal cells of the IgG-donor background (
 ) or on normal cells of the tumor background () (n=6). f. Tumor recurrence rates following resection in mice left untreated (), treated with 2x10⁶ DC loaded with IgG-IC from conventionally-raised C57Bl/6 (), or with 2x10⁶ DC loaded with IgG-IC from gnotobiotic C57Bl/6 mice () (n=6). Shown are the mean values ±SEM from two independent experiments. Asterisk (*) denotes p<0.05 and two asterisks (**) denote p<0.01.
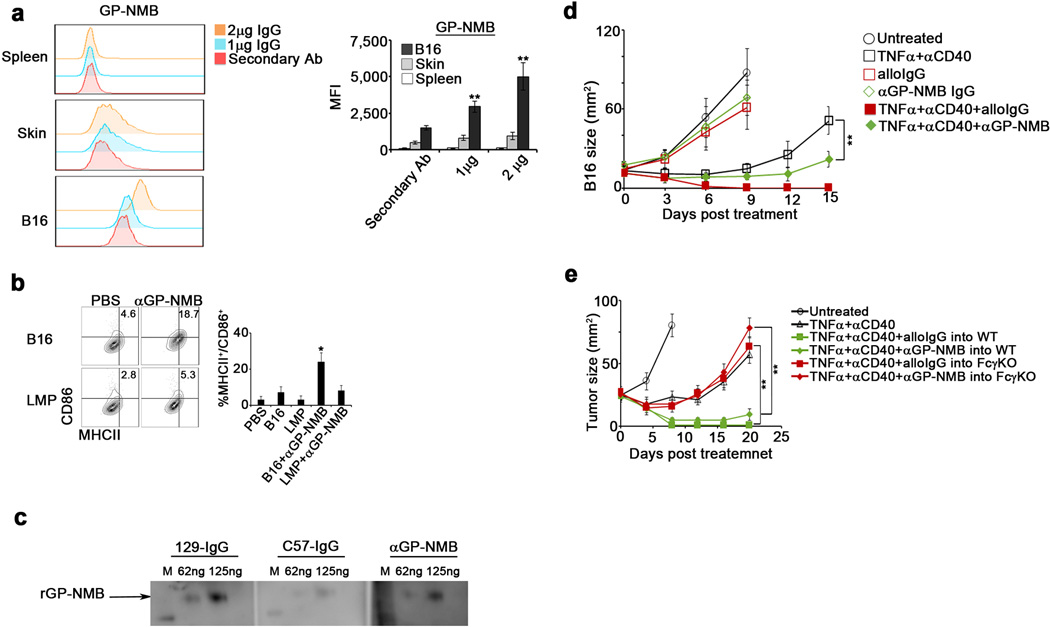 ), 1 µg anti-GP-NMB () or 2 µg GP-NMB () per 1x10⁵ B16 cells, normal skin cells, or normal spleen cells (n=6). b. Percentage of MHCII+/CD86+ BMDC following overnight activation with untreated LMP or B16 tumor cells, or with tumor cells coated with anti-GP-NMB (2µg/1x105 tumor cells) (n=8). c. Western blot of recombinant GP-NMB (62.5 ng and 125 ng) performed with 10µg/mL of IgG from naïve 129S1 mice, naïve C57Bl/6 mice, or 1µg/mL αGP-NMB. d. B16 tumor size in mice untreated () or treated with TNFα+αCD40 (), alloIgG (
 ), anti-GP-NMB IgG (
 ), TNFα+αCD40+alloIgG (), or with TNFα+αCD40+αGP-NMB (
 ) (n=8). e. B16 tumor size in C57Bl/6 WT mice untreated () or treated with TNFα+αCD40 (), TNFα+αCD40+alloIgG (), or with TNFα+αCD40+anti-GP-NMB (), or in FcγR KO mice treated with TNFα+αCD40+alloIgG (), or with TNFα+αCD40+anti-GP-NMB () (n=8). Shown are the mean values ±SEM from two independent experiments. Asterisk (*) denotes p<0.05 and two asterisks (**) denote p<0.01.
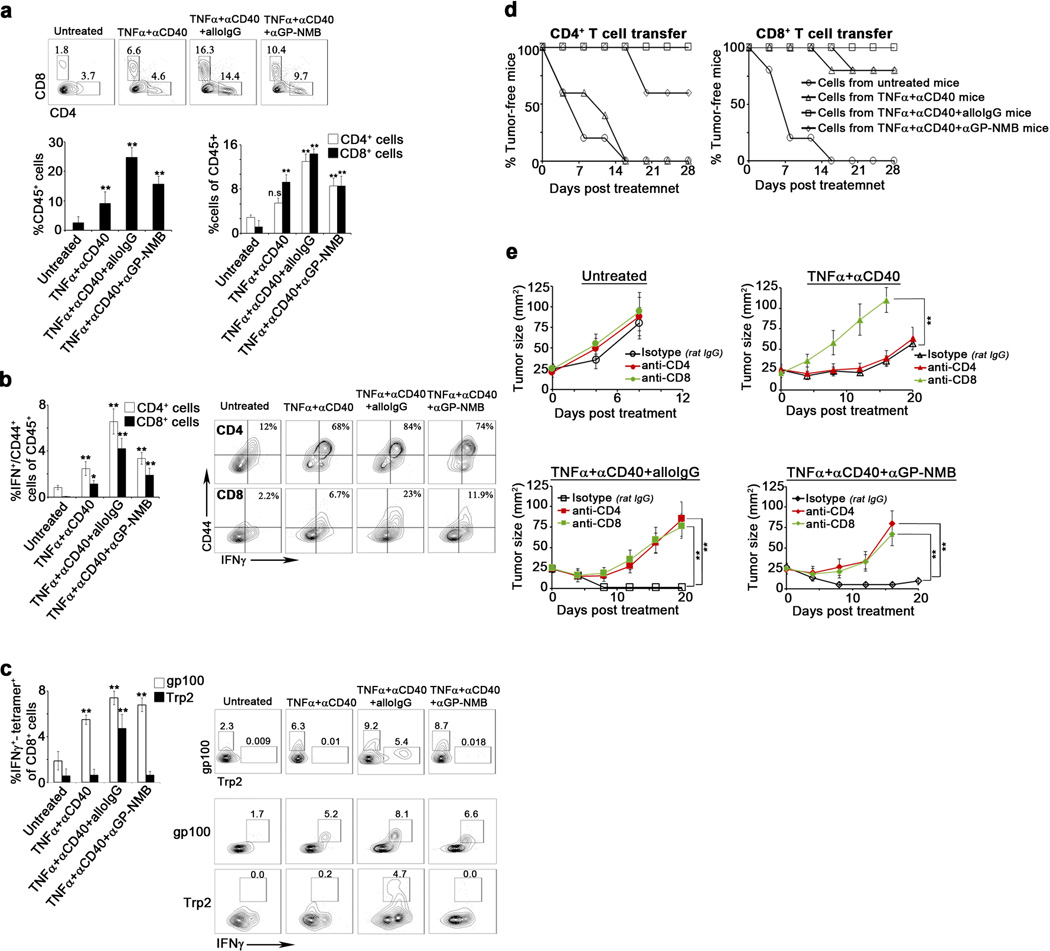 ) and CD8+ cells () among tumor-infiltrating CD45+ cells (n=10). b. Percentages of CD44 and IFNγ co-expressing CD4+ () and CD8+ cells () among tumor-infiltrating CD45+ cells 6 days following treatment or 15 days following s.c. inoculation (n=10) c. Frequency of IFNγ-expressing T cells that recognize gp100 () and Trp2 () among day 6 post-treatment tumor-infiltrating CD8+ cells. Gate shown: CD8+ T cells (n=10). d. Percentage of tumor-free mice following adoptive transfer of T cells from day 6 post-treatment B16 tumor-bearing mice untreated (), treated with TNFα+αCD40 (), with TNFα+αCD40+alloIgG (), or with TNFα+αCD40+αGP-NMB (). (n=9). e. Upper left: B16 tumor growth in untreated C57Bl/6 mice injected with rat IgG (), with rat anti-CD4 (
 ), or with rat-CD8 (
 ). Upper right: B16 tumor growth in C57Bl/6 mice treated with TNFα+αCD40 and injected with rat IgG (), with rat anti-CD4 (
 ), or with rat-CD8 (
 ). Lower left: B16 growth in C57Bl/6 mice treated with TNFα+αCD40+alloIgG and injected with rat IgG (), with rat anti-CD4 (), or with rat-CD8 (). Lower right: B16 growth in C57Bl/6 mice treated with TNFα+αCD40+αGP-NMB and injected with rat IgG (), with rat anti-CD4 (), or with rat-CD8 () (n=9). Shown are the mean values ±SEM from three independent experiments. Asterisk (*) denotes p<0.05 and two asterisks (**) denote p<0.01.
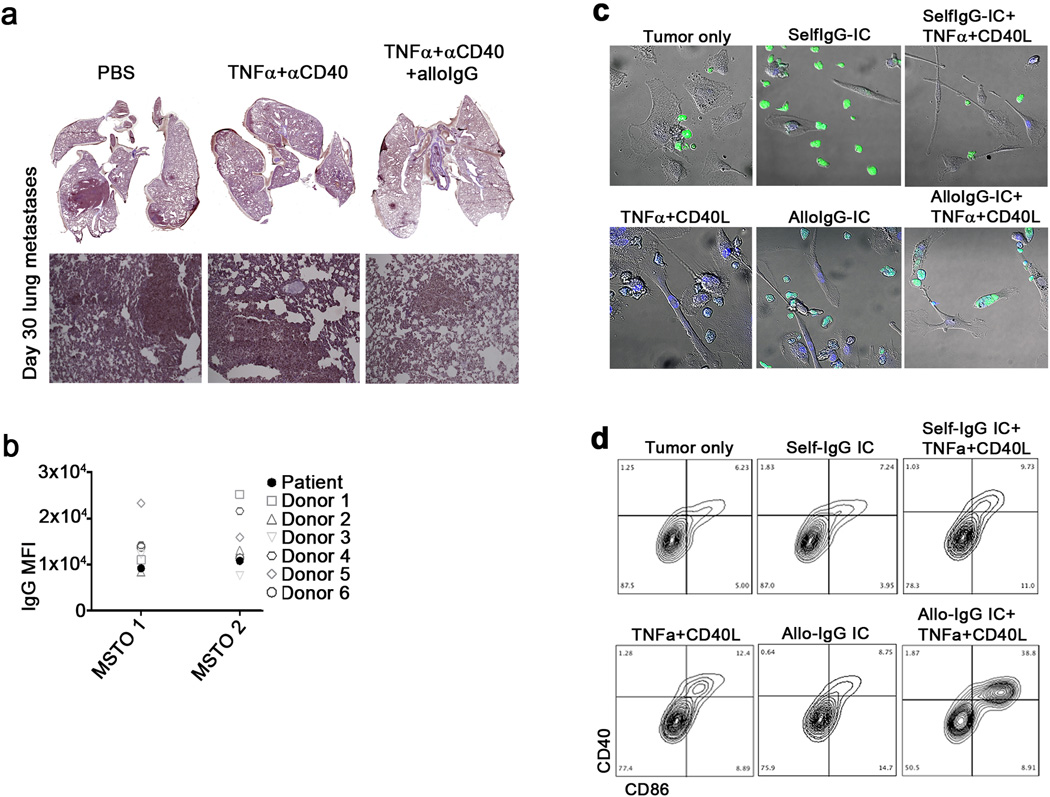
Comment in
-
Immunotherapy: Put your coat on!Nat Rev Cancer. 2015 Jun;15(6):319. doi: 10.1038/nrc3964. Nat Rev Cancer. 2015. PMID: 25998707 No abstract available.
References
-
- Hanahan D, Coussens LM. Accessories to the crime: functions of cells recruited to the tumor microenvironment. Cancer cell. 2012;21:309–322. - PubMed
-
- Schreiber RD, Old LJ, Smyth MJ. Cancer immunoediting: integrating immunity’s roles in cancer suppression and promotion. Science. 2011;331:1565–1570. - PubMed
-
- Vesely MD, Kershaw MH, Schreiber RD, Smyth MJ. Natural innate and adaptive immunity to cancer. Annual review of immunology. 2011;29:235–271. - PubMed
Publication types
MeSH terms
Substances
Grants and funding
LinkOut - more resources
Full Text Sources
Other Literature Sources
