

When do confounding by indication and inadequate risk adjustment bias critical care studies? A simulation study
- PMID: 25925165
- PMCID: PMC4432515
- DOI: 10.1186/s13054-015-0923-8
When do confounding by indication and inadequate risk adjustment bias critical care studies? A simulation study
Abstract
Introduction: In critical care observational studies, when clinicians administer different treatments to sicker patients, any treatment comparisons will be confounded by differences in severity of illness between patients. We sought to investigate the extent that observational studies assessing treatments are at risk of incorrectly concluding such treatments are ineffective or even harmful due to inadequate risk adjustment.
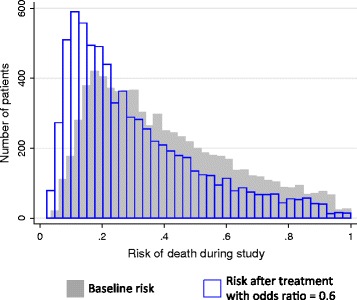
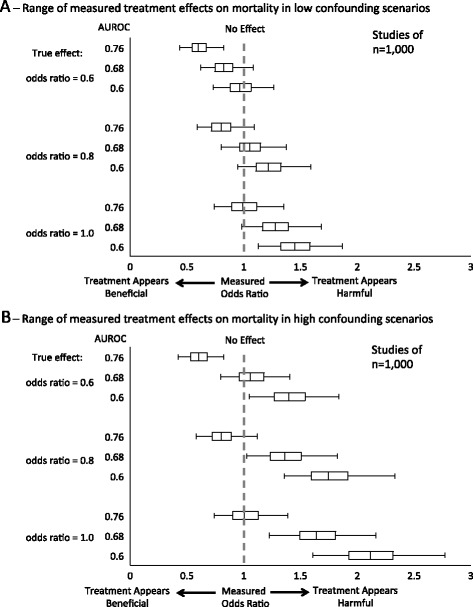
Methods: We performed Monte Carlo simulations of observational studies evaluating the effect of a hypothetical treatment on mortality in critically ill patients. We set the treatment to have either no association with mortality or to have a truly beneficial effect, but more often administered to sicker patients. We varied the strength of the treatment's true effect, strength of confounding, study size, patient population, and accuracy of the severity of illness risk-adjustment (area under the receiver operator characteristics curve, AUROC). We measured rates in which studies made inaccurate conclusions about the treatment's true effect due to confounding, and the measured odds ratios for mortality for such false associations.
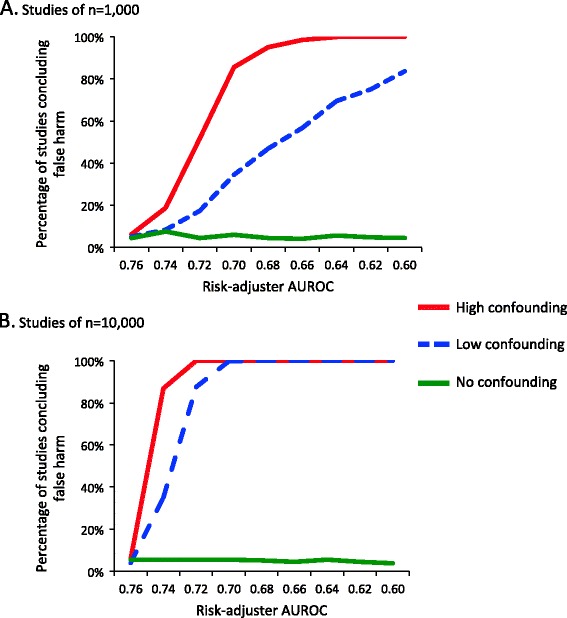
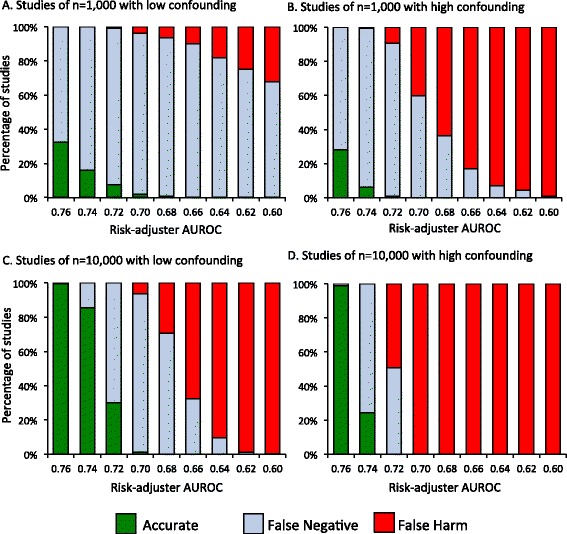
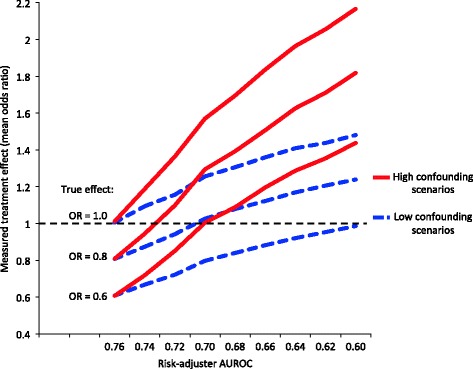
Results: Simulated observational studies employing adequate risk-adjustment were generally able to measure a treatment's true effect. As risk-adjustment worsened, rates of studies incorrectly concluding the treatment provided no benefit or harm increased, especially when sample size was large (n = 10,000). Even in scenarios of only low confounding, studies using the lower accuracy risk-adjustors (AUROC < 0.66) falsely concluded that a beneficial treatment was harmful. Measured odds ratios for mortality of 1.4 or higher were possible when the treatment's true beneficial effect was an odds ratio for mortality of 0.6 or 0.8.
Conclusions: Large observational studies confounded by severity of illness have a high likelihood of obtaining incorrect results even after employing conventionally "acceptable" levels of risk-adjustment, with large effect sizes that may be construed as true associations. Reporting the AUROC of the risk-adjustment used in the analysis may facilitate an evaluation of a study's risk for confounding.
Figures
References
-
- Rubenfeld GD, Angus DC, Pinsky MR, Curtis JR, Connors AF, Jr, Bernard GR. Outcomes research in critical care: results of the American Thoracic Society Critical Care Assembly Workshop on Outcomes Research. The Members of the Outcomes Research Workshop. Am J Respir Crit Care Med. 1999;160:358–67. doi: 10.1164/ajrccm.160.1.9807118. - DOI - PubMed
-
- Biologic Specimen and Data Repository Information Coordinating Center. https://biolincc.nhlbi.nih.gov/home/. Accessed November 24, 2014.
Publication types
MeSH terms
Grants and funding
LinkOut - more resources
Full Text Sources
Other Literature Sources
Medical
