. 2015 Apr 30;520(7549):675-8.
doi: 10.1038/nature14366.

A circuit mechanism for differentiating positive and negative associations

Affiliations

A circuit mechanism for differentiating positive and negative associations

Praneeth Namburi et al. Nature. .

Abstract

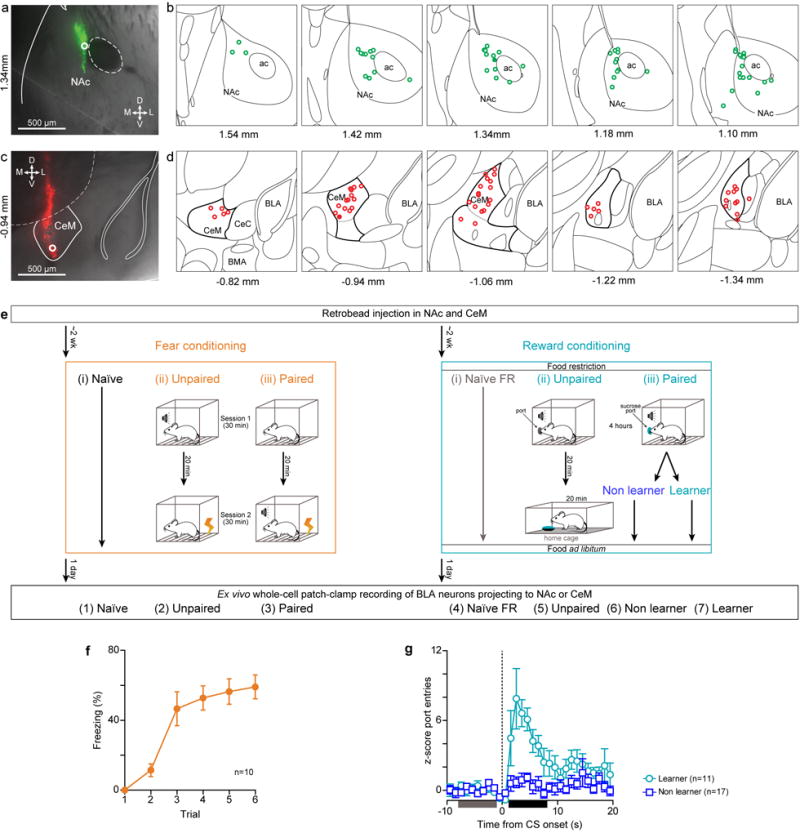
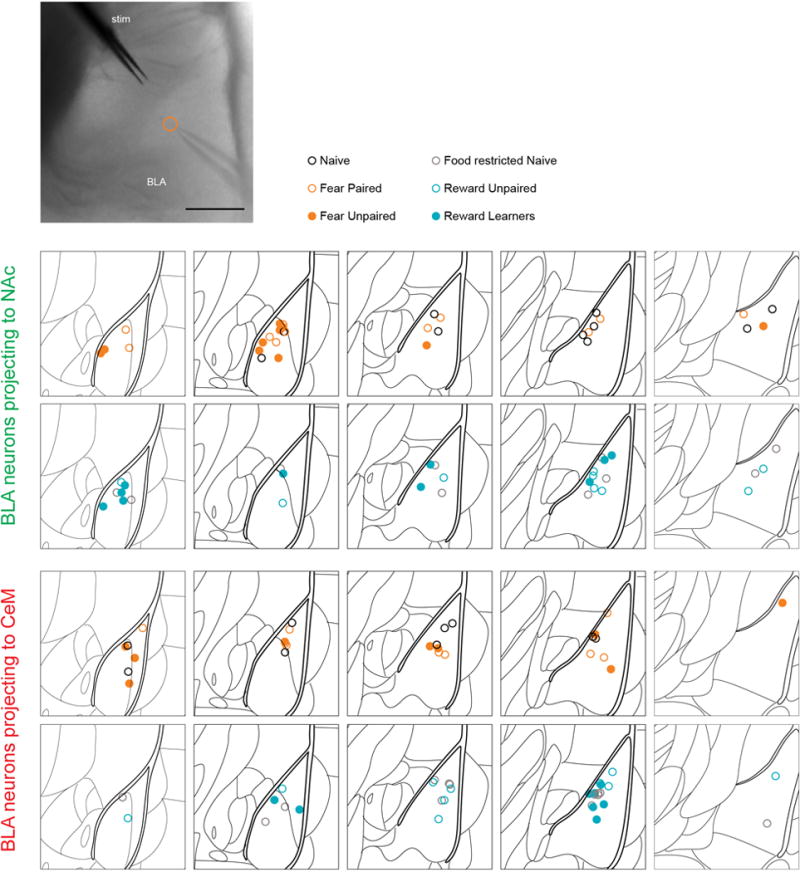
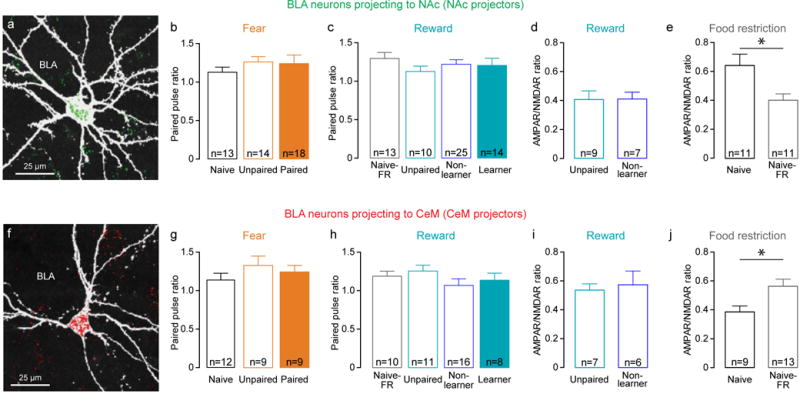
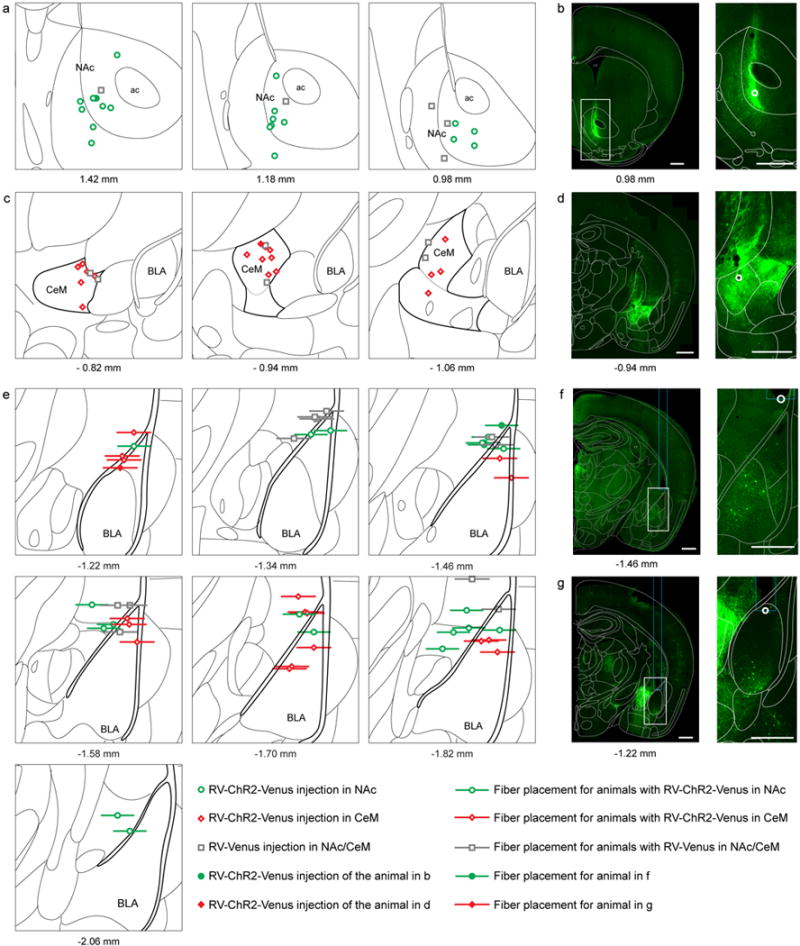
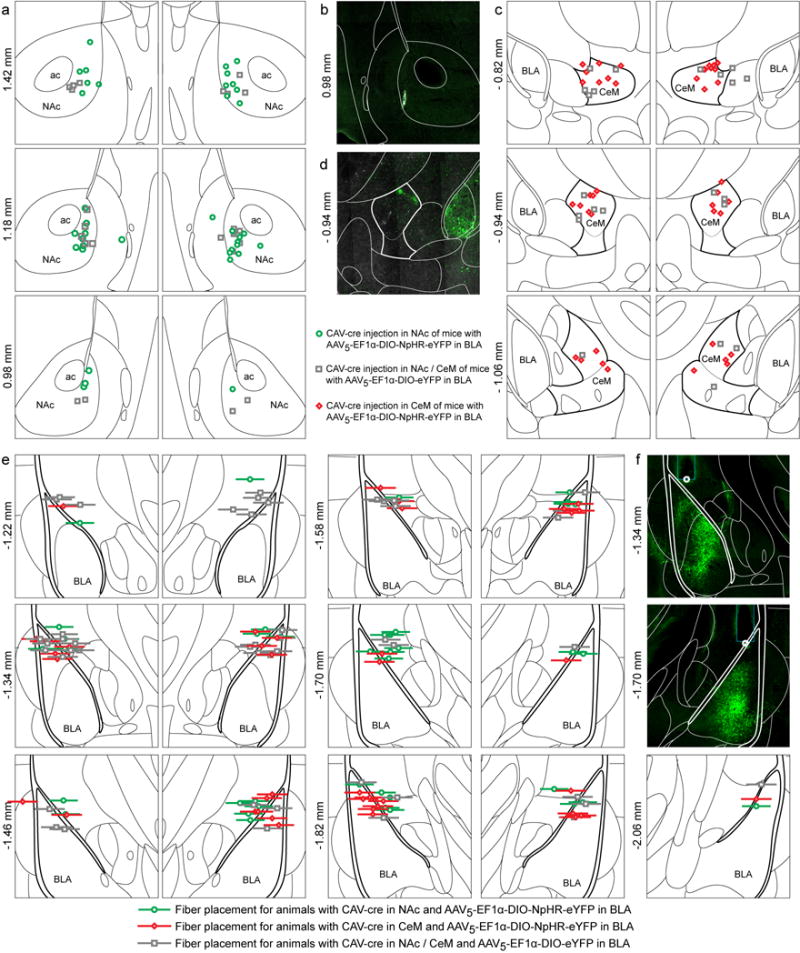
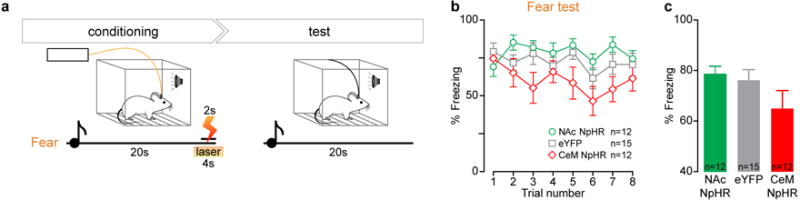
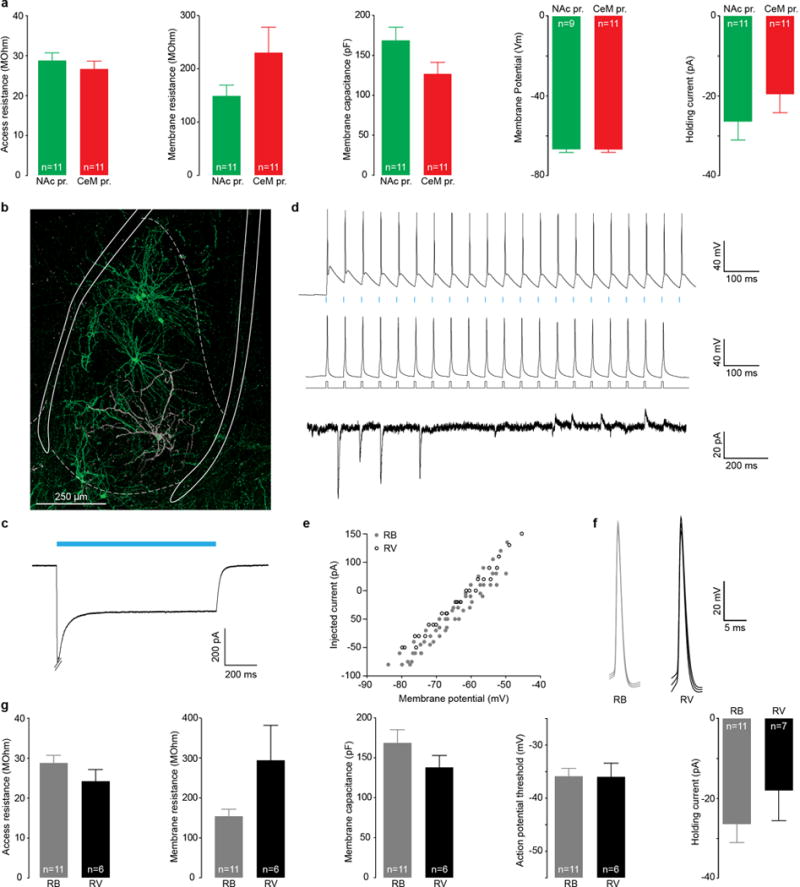
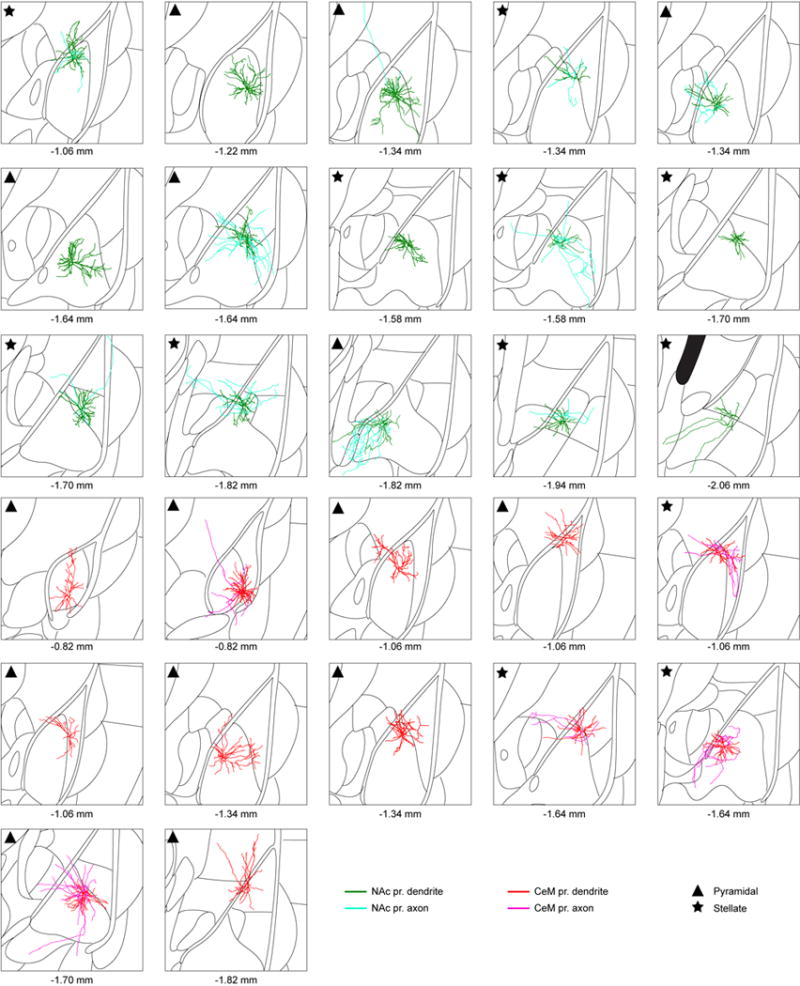
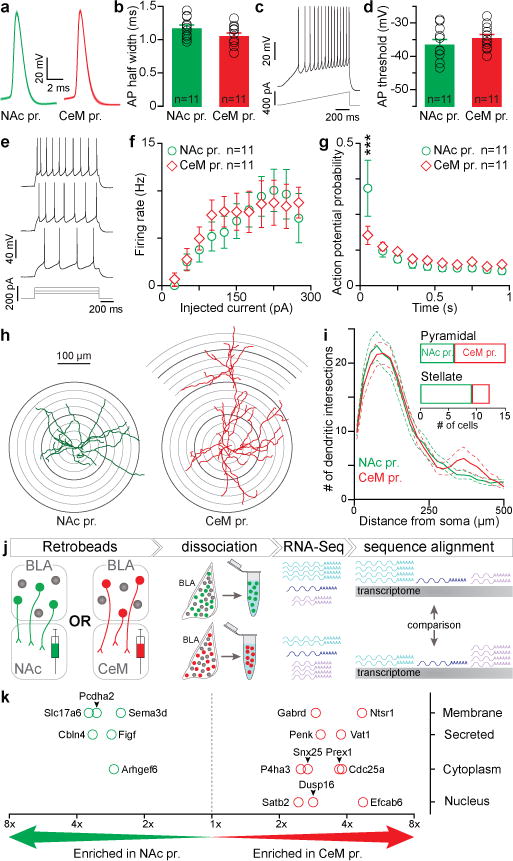
The ability to differentiate stimuli predicting positive or negative outcomes is critical for survival, and perturbations of emotional processing underlie many psychiatric disease states. Synaptic plasticity in the basolateral amygdala complex (BLA) mediates the acquisition of associative memories, both positive and negative. Different populations of BLA neurons may encode fearful or rewarding associations, but the identifying features of these populations and the synaptic mechanisms of differentiating positive and negative emotional valence have remained unknown. Here we show that BLA neurons projecting to the nucleus accumbens (NAc projectors) or the centromedial amygdala (CeM projectors) undergo opposing synaptic changes following fear or reward conditioning. We find that photostimulation of NAc projectors supports positive reinforcement while photostimulation of CeM projectors mediates negative reinforcement. Photoinhibition of CeM projectors impairs fear conditioning and enhances reward conditioning. We characterize these functionally distinct neuronal populations by comparing their electrophysiological, morphological and genetic features. Overall, we provide a mechanistic explanation for the representation of positive and negative associations within the amygdala.


Figures

Extended Data Figure 1
Extended Data Figure 1. Histological verification of retrobead injection sites and behavioral quantification of fear and reward conditioning for mice used in Figure 1
a, Representative differential interference contrast (DIC) image of a 300 μm thick coronal slice containing the center of the retrobead injection in NAc. The white circle is over the most ventral point at which fluorescence is brightest and corresponds to the filled green circle in (b). b, Location of all retrobead injection sites (green circles) in the NAc for all mice used in Fig. 1. Each atlas schematic represents 1.5 mm × 1.5 mm region of the atlas and the corresponding antero-posterior (AP) stereotaxic coordinate relative to Bregma is indicated below c, Representative DIC image of a 300 μm thick coronal slice containing the center of the retrobead injection in CeM.d, Retrobead injection sites in CeM (red circles) for all mice used in Fig. 1. e, Experimental design for AMPAR/NMDAR ratios from Figure 1. Either red or green retrobeads were injected in the NAc and the other color in the contralateral CeM. Two weeks after injection, the retrobeads had travelled back to the cell bodies of the BLA neurons projecting NAc and CeM. Animals were conditioned one day prior to ex-vivo whole cells patch clamp recordings. Each mouse received one of 6 conditioning protocols, 3 protocols categorized under Fear conditioning and 3 protocols categorized under Reward conditioning. Fear conditioning protocols: (i) Naïve: Animals were naïve to the operant chamber. (ii) Unpaired: Animals were exposed to the conditioning chamber in 2 sessions. Animals received 6 tones in the first session and they received 6 foot shocks in the second session. Animals were returned to their home cage for 20 minutes between the two sessions. (iii) Paired: Animals were exposed to operant chamber in two sessions. Animals did not receive any tone or shock stimuli in the first session, and received shocks co-terminating with tones in the second session. Animals were returned to their home cage for 20 minutes between the two sessions. Protocols for Unpaired and Paired fear groups were adapted from Clem and Huganir (2010). Reward conditioning protocols: (i) Naïve Food Restricted (FR): Animals naïve to the operant chamber were food restricted two days prior to ex vivo experiments and had free access to food for one day before ex vivo experiments. We used this group to control for changes in synaptic strength caused by food restriction which was necessary in reward conditioning groups to expedite task acquisition, adapted from rats as in Tye et al., 2008 and 2010,. (ii) Unpaired: Animals received tones in the operant chamber, returned to their home cage for 20 minutes after which they had free access to 1.8 mL of sucrose, followed by free access to food until ex vivo experiments. (iii) Paired: Sucrose was delivered into a port 1 s after the onset of a tone, and the tone was terminated 400 ms after the animal entered the port to claim sucrose. The tone lasted for a maximum length of 30 s. If there was sucrose in the port during the onset of a tone (indicated by the absence of a port entry after the previous tone), then no sucrose was delivered in that trial. Mice could receive up to 120 sucrose deliveries and the conditioning session lasted about 4 hours after which they had free access to food until ex vivo experiments. Behavioral performance from the second half of the conditioning session was used to assess performance and mice that met learning criterion (see Methods) were categorized in the Learner group and the rest of the mice were categorized in the Non learner group. One day after conditioning, BLA neurons identified as either NAc or CeM projectors (retrobead positive) were recorded in whole-cell patch-clamp in ex vivo brain slices. Ex vivo data from both NAc and CeM projectors were collected from the following 7 groups: (1) Naïve, (2) Unpaired and (3) Paired after fear conditioning, (4) Naïve FR, (5) Unpaired, (6) Non learner and (7) Learner groups after reward conditioning. Data from groups (1)–(5) and (7) are shown in Fig. 1 and Extended Data Fig. 1,2,3. Data from group (6) is shown only in Extended Data Fig. 3. f, Time course of percentage freezing for the Paired fear group. Percentage freezing was estimated during the shock-predictive tone (excluding the 2 last seconds, where the foot shock was delivered). g, Average normalized histogram of port entries relative to the onset of the tone predicting sucrose delivery for mice that learned the CS-US association (Learners, n=11) and mice that did not (Non learners, n=17; see Extended Data Fig. 3). Mice in the Paired reward conditioning group were deemed Learners if the number of port entries in the post-CS period (1 to 8 s relative to CS onset, black line) were determined as significantly higher than the number of port entries in the pre-CS period (−8 to −1 s relative to CS onset, grey line) using a one-sided Wilcoxon Rank Sum Test (P < 0.001).
Extended Data Figure 2
Extended Data Figure 2. Location of BLA projectors recorded and analyzed for each experimental group of Figure 1
Top, Representative DIC image showing the location of the stimulation electrode around a bundle of fibers of the internal capsule and a neuron recorded in the BLA (at the tip of the micropipette). The location of the recorded cell is indicated by an orange open circle. Scale bar reflects 200 μm. Bottom, Atlas schematics (1.5 mm × 1.5 mm) showing BLA at various antero-posterior (AP) positions relative to Bregma. Each circle represents the location of a neuron from which AMPDAR/NMDAR ratio was acquired (Figure 1). NAc projector locations are summarized in rows 1 and 2 and CeM projector locations are summarized in rows 3 and 4. Color of the circle represents the conditioning group of the animal from which AMPDAR/NMDAR ratio was acquired.
Extended Data Figure 3
Extended Data Figure 3. Paired Pulse Ratio and AMPAR/NMDAR ratio in non-learners and food restricted naïve animals
a, Confocal image of a representative retrobead positive neuron recorded in BLA after injection of retrobeads into NAc. This cell was recorded in an ex vivo slice, filled with biocytin and stained with streptavidin-CF405, pseudocolored white. b, In NAc projectors, the ratio of EPSC amplitude in response to paired-pulse stimulation (50 ms inter-pulse interval) of internal capsule inputs to the BLA was not related to experimental conditions of fear (one-way ANOVA, F2,44=0.5209, P=0.5978). c, Paired-pulse ratio of EPSC amplitude was not related to experimental condition of reward (one-way ANOVA, F3,61=0.5868, P=0.6261). d, AMPAR/NMDAR ratio of internal capsule inputs onto NAc projectors in mice with unpaired tone and sucrose presentations (Unpaired) and mice that did not learn the cue-reward association (Non-learner). Both groups of mice received the same amount of total sucrose. e, AMPAR/NMDAR ratio onto NAc projectors is significantly decreased by food restriction in naïve mice (unpaired t-test, t20=2.626, *P=0.0162). f, Confocal image of a representative retrobead positive neuron recorded in BLA after retrobead injection in CeM. g, Paired-pulse ratio of EPSC amplitude onto CeM projectors is not related to experimental conditions of fear (one-way ANOVA, F2,29=0.9040, P=0.4169). h, Paired-pulse ratio of EPSC amplitude is not related to experimental conditions of reward (one-way ANOVA, F3,41=0.9770, P=0.4129). i, AMPAR/NMDAR ratio onto CeM projectors is similar in unpaired reward and paired reward non learner mice. j, AMPAR/NMDAR ratio of internal capsule inputs onto CeM projectors is significantly increased by food restriction in naïve mice (unpaired t-test t20=2.526, *P=0.0201).
Extended Data Figure 4
Extended Data Figure 4. Histological verification of viral injection site and fiber placement for photostimulation experiments used in Figure 2
a, Center of the rabies virus injection in NAc for the animals tested in intra-cranial self-stimulation (ICSS) and real time place aversion (RTPA) paradigms (Figure 2a–e). Rabies virus (RV)-ChR2-Venus injections are denoted with green circles, and RV-Venus injections are indicated with gray squares. b, Representative confocal image of viral expression in a mouse 6 days after RV-ChR2-Venus injection in NAc. Right panel: zoom on the brightest fluorescence point (white circle), corresponding to the filled green circle in (a). c, Center of RV-ChR2-Venus (red diamonds) and RV-Venus (gray squares) injections in CeM of animals analyzed in Figure 2. d, Example of viral expression six days after RV-ChR2-Venus injection in CeM. Right panel: zoom on the brightest fluorescence point (white circle), corresponding to the filled red diamond in (c). e, Optical fiber tip placements over BLA of animals with RV-ChR2-Venus injected in NAc (green circles), CeM (red diamonds), or RV-Venus in NAc or CeM (gray squares). Horizontal lines represent the thickness of the implanted fiber (300 μm). f, Representative confocal image showing optical fiber tip from a RV-ChR2-Venus injection in NAc, corresponding to the filled green circle in (e). Region in the white rectangle is magnified in the right panel and shows RV expressing NAc projectors. g, Representative optic fiber placement for RV-ChR2-Venus injection in CeM, corresponding to the filled diamond in (e). Right panel: Zoom on the BLA, containing RV expressing CeM projectors. Atlas schematic in (a), (c), and (e) represent 1.5 mm × 1.5 mm of the brain and the corresponding antero-posterior (AP) coordinates relative to Bregma are specified below. Scale bars in (b), (d), (f) and (g) correspond to 500 μm.
Extended Data Figure 5
Extended Data Figure 5. Histological verification of viral injection site and fiber placement for photoinhibition experiments used in Figure 3
a, Center of canine adenovirus (CAV)-cre injection into bilateral NAc of mice with AAV5-EF1α-DIO-NpHR-eYFP (green circles) or AAV5-EF1α-DIO-eYFP (gray squares) injected bilaterally into the BLA. This approach allows for selective expression of NpHR-eYFP / eYFP, in NAc projecting BLA neurons. b, Representative confocal image of the CAV-cre injection site in NAc. c, Center of CAV-cre injection into CeM from both hemispheres of mice with AAV5-EF1α-DIO-NpHR-eYFP (red diamonds) or AAV5-EF1α-DIO-eYFP (gray squares) injected bilaterally into BLA. In these animals, CeM projecting BLA neurons express NpHR-eYFP or eYFP, respectively. d, Confocal image of a representative CeM injection and NpHR-eYFP expressing cells bodies in the BLA. e, Optical fiber tip placements over BLA from both hemispheres in animals injected with AAV5-EF1α-DIO-NpHR-eYFP in BLA and CAV-cre in NAc (green circles) or CeM (red diamonds), or AAV5-EF1α-DIO-eYFP in BLA and CAV-cre in NAc/CeM (gray squares). Horizontal lines represent thickness of the implanted fiber (300 μm). f, Representative confocal images of optic fiber placements over BLA from both hemispheres of an animal injected with CAV-cre in NAc and AAV5-EF1α-DIO-NpHR-eYFP in BLA. Note NpHR-eYFP-expressing NAc projectors in the BLA. Each atlas diagram and confocal image in (a-f) represents an area of 1.5 mm × 1.5 mm; antero-posterior stereotaxic coordinates relative to Bregma are specified to the left of each image.
Extended Data Figure 6
Extended Data Figure 6. Tone-evoked freezing behavior following inhibition of CeM or NAc projectors during auditory fear conditioning
a, Experimental design: Mice were trained in an auditory fear conditioning paradigm, during which NAc or CeM projectors were selectively inhibited using a dual virus recombination approach (Figure 3). On the day following conditioning, mice were exposed to 8 presentations of the CS alone. They were tethered to a patch cable but no light was delivered. b, Time course of percentage freezing in mice expressing NpHR in NAc projectors (green circles), CeM projectors (red diamonds), or expressing eYFP in NAc or CeM projectors (gray squares) was quantified for each trial. c, There was no significant difference in freezing behavior in response to the CS among the three groups of mice on test day (1-way ANOVA, F2,38=2.010, P=0.1488).
Extended Data Figure 7
Extended Data Figure 7. Membrane properties of retrobead positive NAc/CeM projecting BLA neurons and rabies virus expressing BLA neurons
a, Access resistance, membrane resistance, and membrane capacitance were estimated from the current response of the cell to a 4 mV square voltage pulse using the Q-method (Novák and Zahradník, 2006). Access and membrane resistance as well as the membrane capacitance and membrane potential were not significantly different between the 2 populations (unpaired t-tests: t20=0.788, P=0.4400; t20=1.599, P=0.1256; t20=1.847, P=0.0796; and t20=0.2521, P=0.8038, respectively). The decay time constant was significantly smaller in CeM projectors (unpaired t-test, t20=2.532, *P=0.0198). The holding current corresponds to the current injected to clamp the cell at −70 mV. This value was not significantly different between NAc and CeM projectors (unpaired t-test, t20=1.046, P=0.3079). b, Confocal image of a BLA-NAc projectors expressing ChR2-eYFP transduced by rabies virus (RV) and recorded ex vivo in whole-cell patch-clamp. The cell was filled with biocytin during recording and stained with Sterptavidin-CF405 (in gray). c, Current response to a 1 second blue light pulse in a cell expressing RV, 5 days after injection. d, Five days after viral injection, RV-expressing cells were able to reliably follow 20 Hz light stimulation (5 ms pulses, top trace), as well as to 20 Hz depolarizing current steps (middle trace). RV-expressing cells also showed spontaneous post-synaptic excitatory and inhibitory currents (EPSC and IPSC) when clamped at −70mV (bottom trace, 0 pA holding for this cell). e, Current/Voltage (I/V) curves are similar in retrobead (RB, gray circles, n=5 cells) and RV expressing cells (black circles, n=3 cells). f, Average action potential for 11 RB positive BLA-NAc projectors (gray) and 6 BLA-NAc projectors expressing RV. g, Membrane properties of RB vs. RV expressing neurons. None of them were significantly altered in RV expressing neurons (unpaired t-tests: access resistance: t15=1.299, P=0.2135, membrane resistance: t15=2.057, P=0.0575, membrane capacitance: t15=1.215, P=0.2430, decay time constant: t15=1.677, P=0.1143, action potential threshold: t15=0.0756, P=0.9407, holding current: t15=1.002, P=0.3314).
Extended Data Figure 8
Extended Data Figure 8. Morphological reconstructions of individual BLA neurons projecting to NAc or CeM
Morphological reconstructions of all neurons used for Sholl analysis performed by Imaris software (Fig. 4k). Classification of each neuron as pyramidal or stellate is indicated in the top left corner of each reconstructed neuron (triangle or star, respectively). Each atlas schematic represents 1.5 mm × 1.5 mm area and the corresponding antero-posterior stereotaxic coordinates (relative to Bregma) are shown below.
Extended Data Figure 9
Extended Data Figure 9. RNA-Seq identification of candidate genes differentially expressed in NAc and CeM projecting BLA neurons
a, Candidate differentially expressed genes were required to be enriched in only one group (either CeM or NAc projectors) in two independent experiments (NAc projectors collected from n=8 mice; CeM projectors collected from n=9 mice, total) at the indicated quantile fold change threshold (light blue column). One of the chance estimates (“flip-flopped”) is taken from genes that passed the quantile thresholds but were enriched in the opposite groups in the two experiments. Another chance estimate (“permuted”) is determined based on an analysis in which fold differences for each gene were permuted across genes within each of the two experiments before determining differential expression. A 0.02 quantile threshold was chosen to identify candidate differentially expressed genes (light blue columns) in order to balance specificity and sensitivity, resulting in an estimated false discovery rate of 41.5%: [expected by chance (flip-flopped)]/Differentially expressed genes (see Extended Data Fig. 9c for candidate gene list). In Fig. 4k, a 0.01 quantile threshold was chosen to identify a more conservative list of differentially expressed candidate genes at a lower false discovery rate of 26.2%. b, Distribution of differentially expressed genes between NAc and CeM projectors from RNA-Seq experiments 1 and 2. Light blue shaded areas represent the 2nd and 98th percentiles of the distributions. c, RNA-Seq heatmap showing normalized expression levels of differentially expressed genes in NAc and CeM projecting BLA neurons. Differentially expressed genes were required to be enriched in either NAc or CeM projectors in two independent experiments (samples used in experiment 1 are indicated in black text below the heatmap; experiment 2 samples are indicated in blue text) at a 0.02 quantile threshold (Extended Data Fig. 9a). Each RNA-Seq library was prepared from 35–60 manually sorted retrobead-labeled cells taken from the BLA.
Figure 1
Figure 1. Opposite changes in AMPAR/NMDAR following fear or reward conditioning in BLA neurons projecting to NAc or CeM
a, After injecting retrobeads into NAc or CeM, animals underwent either fear or reward conditioning. b, Confocal image of retrobead labeled BLA neurons, with schematic of stimulation and recording sites (left); region in white square is enlarged (right). DAPI is shown in blue. c–f, One-way ANOVAs were performed on AMPAR/NMDAR ratios after conditioning. Open circles reflect individual data points, number of neurons are shown in each bar and representative traces for each group are below the bar. Results show mean and s.e.m. c, AMPAR/NMDAR ratio was related to training condition during fear conditioning (F2,33=5.844, **P=0.0070) and significantly lower in the Paired group relative to the Unpaired group (t31=2.21, *P<0.05). d, AMPAR/NMDAR ratio was related to training condition during reward conditioning (F2,31= 6.53, **P=0.0046) and Learners showed a greater AMPAR/NMDAR ratio than mice in the Unpaired group (t29=3.20, **P<0.01). e, In CeM projectors, AMPAR/NMDAR ratio was related to fear conditioning (F2,29=8.72, **P=0.0012) and was greater in the Paired group relative to the Unpaired group (t27=3.99, ***P<0.001). f, In CeM projectors, AMPAR/NMDAR ratio was altered by reward learning (F2,32= 3.63, *P=0.039), and was greater in Learners relative to the Unpaired group (t30=2.57, *P<0.05). g, Proposed model, arrow thickness represents relative synaptic strength.
Figure 2
Figure 2. Within the BLA, photostimulation of NAc or CeM projectors causes positive and negative reinforcement, respectively
a, After rabies virus injection into NAc or CeM, animals were tested using intracranial self-stimulation (ICSS) and real time place aversion (RTPA) assays. b, Representative traces of nose poke responses during ICSS. c, The relative number of active nose pokes was related to the experimental group (one-way ANOVA, F2,18=10.50, **P=0.0012), and was significantly increased by photostimuation of NAc projectors in comparison to controls (t16=4.00, **P<0.01). d, Representative locomotor trace from an animal receiving CeM projector photostimulation during RTPA. e, The percentage of time spent in the photostimulation-paired zone was related to the experimental group (one-way ANOVA F2,45=4.38, *P=0.019) and was significantly decreased by photostimulation of CeM projectors in comparison to controls (t43=2.25, *P<0.05). Results show mean and s.e.m.
Figure 3
Figure 3. Photoinhibition of CeM projectors impairs fear learning and enhances reward learning
a, Halorhodopsin (NpHR) was expressed bilaterally either in NAc or CeM projecting BLA neurons using a dual-virus recombination strategy. Mice underwent fear or reward conditioning, and yellow light was delivered to the BLA during the US. b, Time course of percentage freezing and average freezing in trials 6–8 (inset). Average freezing was related to experimental condition (one-way ANOVA, F2,40=6.68, **P=0.0033) and was significantly reduced by photoinhibition of CeM projectors, relative to controls (t38=3.46, **P<0.01; see inset). c, Time course of normalized number of port entries, relative to cue presentation during reward conditioning and average number of normalized port entries (< 8 s latency, inset). Z-score of port entries was related to the experimental condition (one-way ANOVA, F2,31=9.23, ***P=0.0008) and was significantly increased by photoinhibition of CeM projectors, relative to controls (t29=4.11, ***P<0.001). Results show mean and s.e.m.
Figure 4
Figure 4. Electrophysiological, morphological, and transcriptional profiles of NAc and CeM projectors
a, Population average of action potential (AP) traces. b, No detectable difference in AP half-width (unpaired t-test, t20=1.82, P=0.085). c, Representative trace from AP threshold detection protocol. d, No detectable difference in AP threshold between NAc and CeM projectors (unpaired t-test, t20=1.05, P=0.31). e–g, Representative trace from current injection protocol to determine firing rate responses (f) and action potential probability (g) over time, which was different between NAc and CeM projectors (Interaction, two-way ANOVA F9,180=2.32, **P=0.0017) in the first 100 ms of current injection (t200=4.55, ***P<0.001). h–i, Representative reconstructions (h) and population data (i) from Scholl analysis. j, Schematic of transcriptome profiling. k, Candidate genes identified as differentially expressed between NAc and CeM projectors at 0.01 quantile fold-change threshold (Extended Fig. 9a) across two independent repetitions of RNA-Seq. Results show mean and s.e.m.

Comment in

  • Neural circuits: Pain or pleasure?
    Whalley K. Whalley K. Nat Rev Neurosci. 2015 Jun;16(6):316. doi: 10.1038/nrn3975. Nat Rev Neurosci. 2015. PMID: 25991440 No abstract available.

References

    1. Tye KM, Stuber GD, De Ridder B, Bonci A, Janak PH. Rapid strengthening of thalamo-amygdala synapses mediates cue–reward learning. Nature. 2008;453:1253–1257. - PMC - PubMed
    1. Tye KM, et al. Methylphenidate facilitates learning-induced amygdala plasticity. Nat Neurosci. 2010;13:475–481. - PMC - PubMed
    1. McKernan MG, Shinnick-Gallagher P. Fear conditioning induces a lasting potentiation of synaptic currents in vitro. Nature. 1997;390:607–611. - PubMed
    1. Rogan MT, Stäubli UV, LeDoux JE. Fear conditioning induces associative long-term potentiation in the amygdala. Nature. 1997;390:604–607. - PubMed
    1. Rumpel S, LeDoux J, Zador A, Malinow R. Postsynaptic Receptor Trafficking Underlying a Form of Associative Learning. Science. 2005;308:83–88. - PubMed

Publication types

Associated data