. 2015 Jul 1;43(W1):W576-9.
doi: 10.1093/nar/gkv402. Epub 2015 Apr 29.

NGL Viewer: a web application for molecular visualization

Affiliations

NGL Viewer: a web application for molecular visualization

Alexander S Rose et al. Nucleic Acids Res. .

Abstract

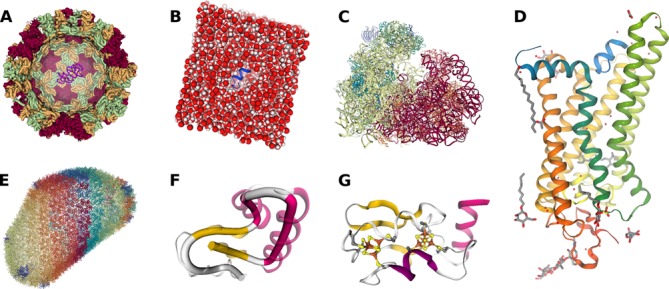
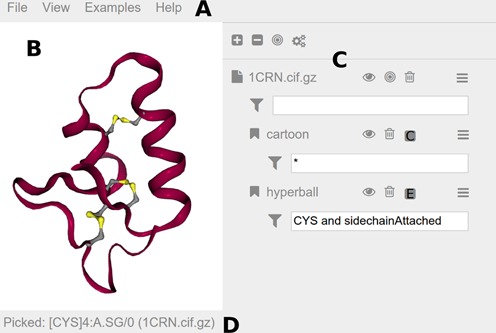
The NGL Viewer (http://proteinformatics.charite.de/ngl) is a web application for the visualization of macromolecular structures. By fully adopting capabilities of modern web browsers, such as WebGL, for molecular graphics, the viewer can interactively display large molecular complexes and is also unaffected by the retirement of third-party plug-ins like Flash and Java Applets. Generally, the web application offers comprehensive molecular visualization through a graphical user interface so that life scientists can easily access and profit from available structural data. It supports common structural file-formats (e.g. PDB, mmCIF) and a variety of molecular representations (e.g. 'cartoon, spacefill, licorice'). Moreover, the viewer can be embedded in other web sites to provide specialized visualizations of entries in structural databases or results of structure-related calculations.


Figures

Figure 1.
Figure 1.
Gallery of molecular visualizations showing various representations of differently sized macromolecules. (A) Structure of the Noro virus capsid (PDB entry 1IHM) that forms the outer shell of the virus, colored by chainindex. The front of the capsid is clipped away and depicted inside the virus capsid is, for size comparison, the structure of a conserved retroviral RNA packaging element from the Moloney murine leukemia virus (PDB entry 2LIF). (B) System of a peptide derived from the C-terminus of ‘transducin’ (blue cartoon) surrounded by a box of water molecules (spacefill representation) in preparation for a molecular dynamics simulation. (C) Structure of a mammalian 80S ‘ribosome’ (PDB entry 4UJD) colored by chainindex. (D) Structure of light-activated ‘rhodopsin’ in complex with a peptide derived from the C-terminus of ‘transducin’ (PDB entry 3PQR), colored by residueindex. (E) HIV-1 capsid structure (PDB entry 3J3Y) showing the backbone colored by chainindex. (F) Example usage of the rope representation (solid tube) to display the protein fold in a more abstract way as compared to the cartoon representation (translucent). The structure shown is that of ‘crambin’ (PDB entry 1CRN) colored by secondary structure with magenta alpha-helices and yellow beta-strands. (G) The secondary structure of ‘ferredoxin’ (PDB entry 1BLU) and its two [4Fe–4S] clusters highlighted with the ‘HyperBall’ representation.
Figure 2.
Figure 2.
Screenshot of the ‘NGL Viewer’ GUI, magnified for clarity. A more detailed description of the GUI can be found in the online documentation. (A) The menu bar at the top provides access to general commands. The ‘File’ menu includes commands to load files or export images. Buttons to change the theme or to go fullscreen are in the ‘View’ menu. The ‘Examples’ menu includes various possible use cases. Help-related items like a preferences section and a link to the documentation can be found in the ‘Help’ menu. (B) Molecular visualizations are rendered to the viewport at the center. Here the structure of ‘crambin’ (PDB entry 1CRN) is shown highlighting the three disulfide bridges. (C) The sidebar hosts an interface element for each loaded structure and added representations. A number of buttons are available to quickly access commands: hide/show (eye icon), center (bulls eye icon), delete (trash bin icon) and parameters menu (stacked bars icon). Input fields for atom selections (funnel icon) restrict the display of representations. Here the ‘hyperball’ representation is limited to CYS and sidechainAttached. (D) The status bar at the bottom notes the last picked atom, in this case the ‘SG’ atom in the ‘cysteine’ with residue number ‘4’ in chain ‘A’ of model ‘0’.

References

    1. O'Donoghue S.I., Goodsell D.S., Frangakis A.S., Jossinet F., Laskowski R.A., Nilges M., Saibil H.R., Schafferhans A., Wade R.C., Westhof E., et al. Visualization of macromolecular structures. Nat. Methods. 2010;7:S42–S55. - PMC - PubMed
    1. Mura C., McCrimmon C.M., Vertrees J., Sawaya M.R. An introduction to biomolecular graphics. PLoS Comput. Biol. 2010;6:e1000918. - PMC - PubMed
    1. Ashkenazy H., Erez E., Martz E., Pupko T., Ben-Tal N. ConSurf 2010: calculating evolutionary conservation in sequence and structure of proteins and nucleic acids. Nucleic Acids Res. 2010;38:529–533. - PMC - PubMed
    1. Ismer J., Rose A.S., Tiemann J.K.S., Goede A., Rother K., Hildebrand P.W. Voronoia4RNA—a database of atomic packing densities of RNA structures and their complexes. Nucleic Acids Res. 2013;41:D280–D284. - PMC - PubMed
    1. Gutmanas A., Alhroub Y., Battle G.M., Berrisford J.M., Bochet E., Conroy M.J., Dana J.M., Fernandez Montecelo M.A., Van Ginkel G., Gore S.P., et al. PDBe: protein data bank in Europe. Nucleic Acids Res. 2014;42:285–291. - PMC - PubMed

Publication types

Substances