. 2015 Apr 30:13:135.
doi: 10.1186/s12967-015-0480-6.

Comprehensive molecular characterization of human adipocytes reveals a transient brown phenotype

Affiliations

Comprehensive molecular characterization of human adipocytes reveals a transient brown phenotype

Andrea Guennoun et al. J Transl Med. .

Abstract

Background: Functional brown adipose tissue (BAT), involved in energy expenditure, has recently been detected in substantial amounts in adults. Formerly overlooked BAT has now become an attractive anti-obesity target.

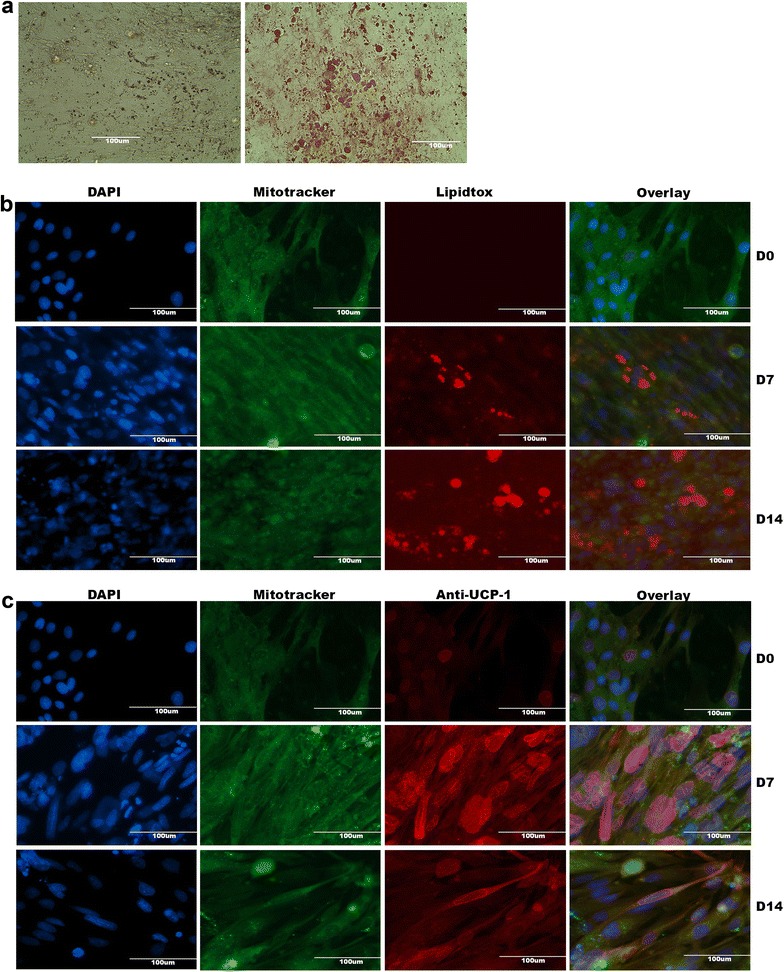
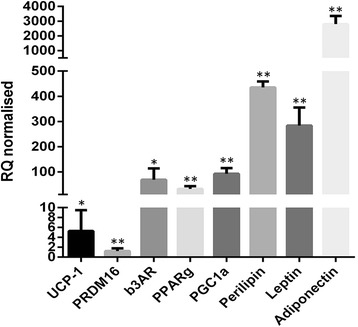
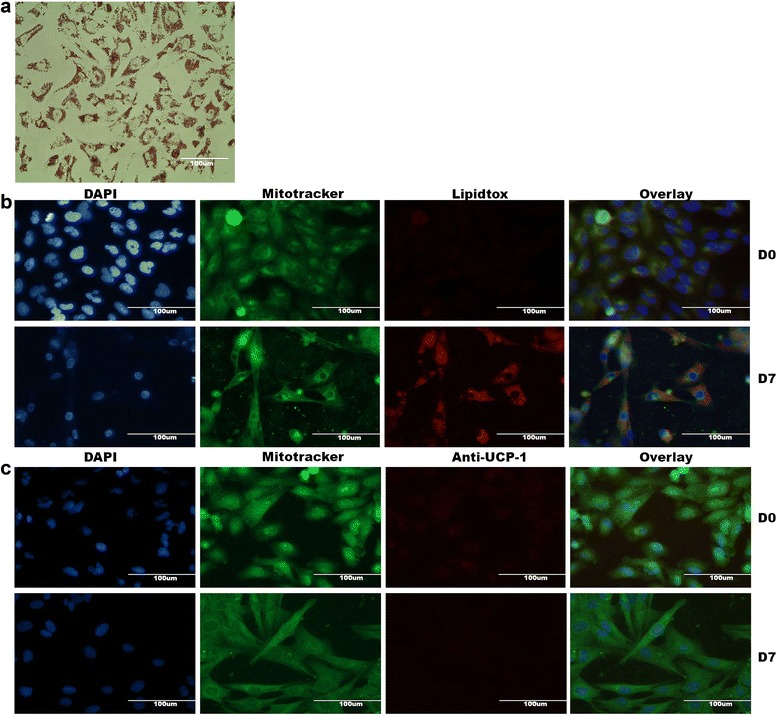
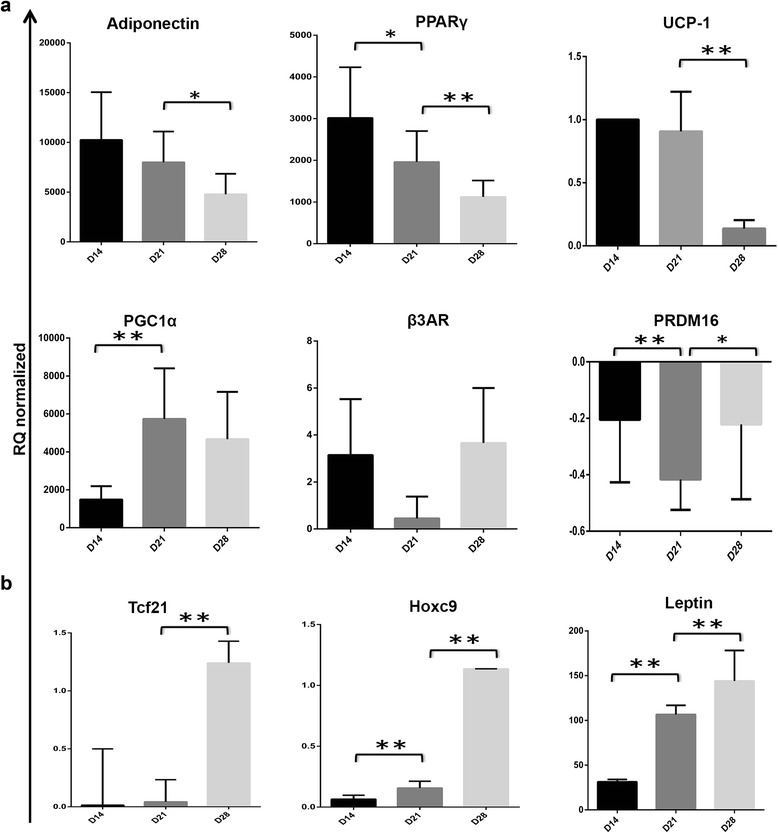
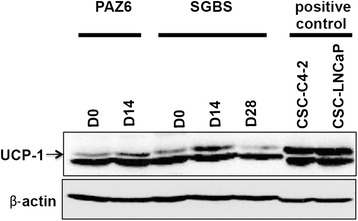
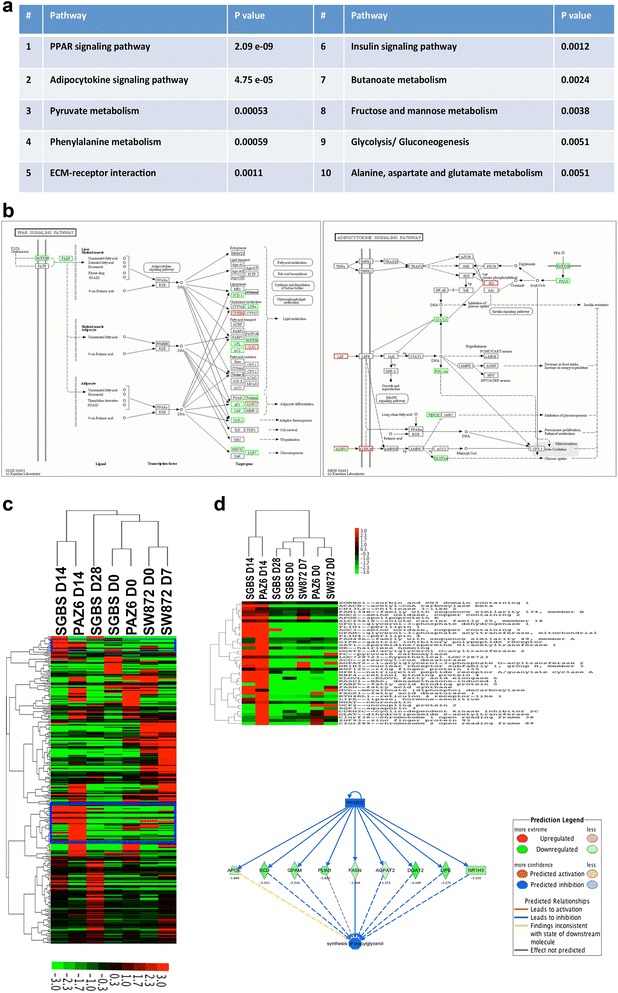
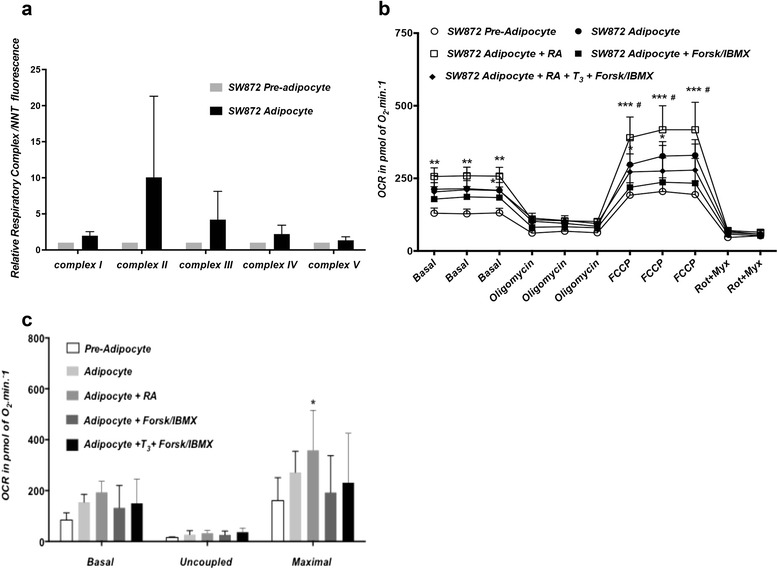
Methods and results: Molecular characterization of human brown and white adipocytes, using a myriad of techniques including high-throughput RNA sequencing and functional assays, showed that PAZ6 and SW872 cells exhibit classical molecular and phenotypic markers of brown and white adipocytes, respectively. However, the pre-adipocyte cell line SGBS presents a versatile phenotype. A transit expression of classical brown markers such as UCP1 and PPARγ peaked and declined at day 28 post-differentiation initiation. Conversely, white adipocyte markers, including Tcf21, showed reciprocal behavior. Interestingly, leptin levels peaked at day 28 whereas the highest adiponectin mRNA levels were detected at day 14 of differentiation. Phenotypic analysis of the abundance and shape of lipid droplets were consistent with the molecular patterns. Accordingly, the oxidative capacity of SGBS adipocytes peaked on differentiation day 14 and declined progressively towards differentiation day 28.

Conclusions: Our studies have unveiled a new phenotype of human adipocytes, providing a tool to identify molecular gene expression patterns and pathways involved in the conversion between white and brown adipocytes.


Figures

Figure 1
Figure 1
Human brown PAZ6 adipocytes accumulate multiple small lipid droplets upon differentiation and express peri-nuclear and cytoplasmatic UCP1 at high levels. PAZ6 cells were differentiated for 14 days and cell monolayers were stained and examined by microscopy. (a) Oil Red staining was carried out as described above and the presence of stained lipid droplets at D7 (left) and D14 (right) was assessed at a magnification of 20×. (b and c) Premature and differentiated PAZ6 cells were co-stained with mitotracker (green) to test the abundance of mitochondria, lipidtox (red, in b) for neutral lipid droplets or anti-UCP1 antibodies (red, in c) and DAPI (blue) to visualize nuclei. Single-channel images were overlayed and processed by Photoshop software. All scale bars are reported.
Figure 2
Figure 2
Differentiated PAZ6 cells overexpress adipokines and brown adipocyte markers. PAZ6 cells were cultured in monolayers and differentiated for 14 days. RNA was isolated using the Qiagen lipid tissue mini kit and cDNA synthesis was carried out. Quantitative real-time PCR was performed by SYBR green detection method and values are reported as RQ normalized referring to the relative quantification compared to HPRT expression and normalized for D0 baseline expression levels for each gene. All experiments were done in triplicates and data are derived from at least three independent experiments. (* p <0.01, ** p < 0.001).
Figure 3
Figure 3
Differentiated SW872 adipocytes depict a high abundance of lipid droplets but no UCP1 expression. (a) Oil Red staining was carried out as described above and the presence of stained lipid droplets at D7 was assessed at a magnification of 20×. (b and c) Premature and differentiated SW872 cells were co-stained with mitotracker (green) to test the abundance of mitochondria, lipidtox (red, in b) for neutral lipid droplets or anti-UCP1 antibodies (red, in c) and DAPI (blue) to visualize nuclei. Single-channel images were overlayed and processed by Photoshop software. All scale bars are reported.
Figure 4
Figure 4
Human SGBS adipocytes display features of white and brown adipocytes respectively. (a) Oil Red staining was carried out as described above and the presence of stained lipid droplets at D14, D21 and D28 was assessed at a magnification of 20×. (b and c) Premature and differentiated SGBS cells were co-stained with mitotracker (green) to test the abundance of mitochondria, lipidtox (red, in b) for neutral lipid droplets or anti-UCP1 antibodies (red, in c) and DAPI (blue) to visualize nuclei. Single-channel images were overlayed and processed by Photoshop software. All scale bars are reported.
Figure 5
Figure 5
Molecular analysis of adipokine expression in undifferentiated and mature SGBS cells confirms phenotypic findings. SGBS cells were cultured in monolayers and upon reaching confluency, cells were differentiated for 28 days. RNA was isolated using the Qiagen lipid tissue mini kit and cDNA synthesis was carried out. Quantitative real-time PCR was performed by SYBR green detection method and values are reported as RQ normalized referring to the relative quantification compared to HPRT expression and normalized for D0 baseline expression levels for each gene. All experiments were done in triplicates and data are derived from at least three independent experiments. (a) Gene expression of markers of brown adipocytes and general fat cell markers were assessed. (b) In order to elucidate the versatile phenotype of SGBS cells, expression levels of white adipocyte markers were tested. All experiments were done in triplicates and data are derived from at least three independent experiments. (* p <0.01, ** p < 0.001).
Figure 6
Figure 6
UCP1 protein levels in SGBS adipocytes peak at Day 14 and are comparable to levels detected in differentiated PAZ6 cells. Lysates of SGBS and PAZ6 cells were prepared at D0, D14 and D28 (SGBS only) and immunoblotted with antibodies against UCP1. Equal protein loading was confirmed with antibodies against β-actin. CSC-C4-2 and CSC-LNCaP lysates are shown as positive control. CSC = cancer stem cells.
Figure 7
Figure 7
Next-generation whole genome RNA sequencing elucidates the activation of key pathways in three human adipocytes upon differentiation. RNA was isolated as described above and subjected to next generation sequencing analysis. Comparison of SGBS cells at D14 and D28 revealed 485 DEGs with fold change >2 and FDR <0.001. Genes were queried against know annotation databases and gene ontology analysis was performed. (a) 10 top-involved pathways are shown; among those PPARγ and adipocytokine signaling are the two most significantly involved pathways (b). (c) Expression levels of 284 DEGs with no absence calls between SGBS S14 and D28 samples were clustered for all three human adipocytes and visualized by Treeview software. Two clusters highlighted in blue are characteristic for SGBS D14, representative of the brownish stage, and differentiated, brown PAZ6 cells on D14. (d) 41 DEGs are displayed separately using Treeview software (upper panel). PPARγ gene interaction networks were generated with Ingenuity Pathway analysis software (lower panel). Log2 ratios are reported based on the comparison between SGBS D14 vs. SBGS D28.
Figure 8
Figure 8
Metabolic characterization of undifferentiated and differentiated PAZ6 cells. (a) Expression of mitochondrial respiratory complexes I, II, III, IV and V in PAZ6 pre-adipocytes and adipocytes. Differentiation is associated with an overall increase in the expression of mitochondrial electron transfer chain complexes. Treatment of PAZ6 adipocytes with retinoic acid (1 μM), T3 (2nM) and Forskolin (2 μM)/IBMX (125 μM) further increases the expression of complexes II, III and IV. Values are presented as the fluorescent units ratio between each respiratory complex protein and the nuclear encoded NNT protein ± SEM. (b) OCR of PAZ6 pre-adipocytes and adipocytes in unbuffered DMEM containing 5 mM pyruvate and 2.5 mM glucose. (c) Basal, uncoupled and maximal respiratory capacities are robustly increased in the adipocyte relative to the pre-adipocyte state (* p < 0.0001). (d) OCR in PAZ6 adipocytes under various treatments (24 hrs).. FCCP-dependent (State3u) respiration is mildly increased in adipocytes treated with retinoic-acid (RA) plus T3 (**p < 0.05 vs. adipocyte). Forskolin/IBMX had a synergistic effect upon State3u respiration when given in combination with RA (***p < 0.0001 vs. adipocyte; # p < 0.05 vs. adipocyte + RA). (e) Basal, uncoupled and maximal respiration were calculated. Maximal respiratory capacity is increased in adipocytes treated with RA plus T3 (*p < 0.05 vs. adipocyte) and RA plus T3 plus forskolin/IBMX (**p < 0.05 vs. adipocyte). (f) Glycolysis, shown as the rate of extracellular acidification (ECAR) in PAZ6 pre-adipocytes and adipocytes under several conditions. Rates are significantly increased in adipocytes treated with RA, RA plus T3 (**p < 0.01 vs. adipocyte) and RA plus T3 plus forskolin/IBMX (***p < 0.001 vs. adipocyte). Results expressed as mean ± SEM.
Figure 9
Figure 9
Metabolic characterization of undifferentiated and differentiated SGBS cells. Where noted rosiglitazone (rosi) was added during the first initial days of differentiation at a final concentration of 2 μM. (a) SGBS respiratory complexes expression. An overall increase in expression results from differentiation in the presence of rosiglitazone (*p < 0.02). Values are presented as the fluorescent units ratio between each respiratory complex protein and the nuclear encoded NNT protein ± SEM. (b) Oxygen consumption rate (OCR) by SGBS pre-adipocytes and adipocytes in unbuffered DMEM containing 5 mM pyruvate and 2.5 mM glucose. Basal and FCCP-dependent State3u respiration peaked at D14 in a rosi-dependent manner. (c) Basal, uncoupled and maximal respiration are shown. Basal respiration is increased in adipocytes at D14 in the presence of rosi (*p < 0.05 vs. adipocyte D14 – rosi; & p < 0.01 vs. pre-adipocyte). Maximal respiratory capacity is increased in the adipocytes differentiated in the presence of rosi at D14 and D28 (*** p < 0.0001 vs. pre-adipocyte, # p <0.0001 vs. adipocyte D14 or D28– rosi; @ p < 0.0001 vs adipocyte D28 + rosi). Results are expressed as mean ± SEM.
Figure 10
Figure 10
Metabolic characterization of undifferentiated and differentiated SW872 cells. (a) SW872 respiratory complexes expression. Differentiation in oleate increases the expression of the mitochondrial respiratory complexes. Values are presented as the fluorescent units ratio between each respiratory complex protein and the nuclear encoded NNT protein ± SEM. (b) OCR by SW872 pre-adipocytes and adipocytes in unbuffered DMEM containing 5 mM pyruvate and 2.5 mM glucose. Basal and FCCP-dependent State3u respiration are increased in the RA-treated adipocyte relative to the pre-adipocyte state (** p < 0.001; ***p <0.0001 versus pre-adipocyte; # p <0.05 vs. adipocyte + RA + T3 + forskolin/IBMX)). (c) Basal, uncoupled and maximal respiration are calculated. RA increased the maximal respiratory capacity of the adipocytes relative to the pre-adipocytes (*p < 0.05). Results expressed as mean ± SEM.
Figure 11
Figure 11
Cold exposure of SGBS adipocytes activates BAT markers and leads to an enhanced brown adipocyte phenotype. SGBS cells were cultured at 30°C for either 10 days or 4-6 h and objected to phenotypic or molecular assessment of BAT and WAT markers. (a) SGBS cells were transferred to cold environment after the first 4 days of initial differentiation and compared to control cells which were kept at 37°C for the duration of the two week differentiation process. Oil Red staining was carried out as described above and the presence of stained lipid droplets at D14 was assessed. (b) 10 day cold-exposed and control SGBS cells were co-stained with mitotracker (green) to test the abundance of mitochondria, lipidtox (red) for neutral lipid droplets and DAPI (blue) to visualize nuclei. Single-channel images were overlayed and processed by Photoshop software. All scale bars are reported. (c) RNA from SGBS cells, which were subjected to cold-environment for 4-6 h, was isolated using the Qiagen lipid tissue mini kit and cDNA synthesis was carried out. Quantitative real-time PCR was performed by SYBR green detection method and expression levels are normalized for D0 baseline expression levels. All experiments were done in triplicates and data are derived from at least three independent experiments. (* p <0.01, ** p < 0.001).

References

    1. Finucane MM, Stevens GA, Cowan MJ, Danaei G, Lin JK, Paciorek CJ, et al. National, regional, and global trends in body-mass index since 1980: systematic analysis of health examination surveys and epidemiological studies with 960 country-years and 9.1 million participants. Lancet. 2011;377:557–67. doi: 10.1016/S0140-6736(10)62037-5. - DOI - PMC - PubMed
    1. Alberti KG, Zimmet P, Shaw J. The metabolic syndrome–a new worldwide definition. Lancet. 2005;366:1059–62. doi: 10.1016/S0140-6736(05)67402-8. - DOI - PubMed
    1. Jahangir E, De Schutter A, Lavie CJ. The relationship between obesity and coronary artery disease. Transl Res. 2014;164:336–344. doi: 10.1016/j.trsl.2014.03.010. - DOI - PubMed
    1. Tchernof A, Despres JP. Pathophysiology of human visceral obesity: an update. Physiol Rev. 2013;93:359–404. doi: 10.1152/physrev.00033.2011. - DOI - PubMed
    1. Murdolo G, Herder C, Wang Z, Rose B, Schmelz M, Jansson PA. In situ profiling of adipokines in subcutaneous microdialysates from lean and obese individuals. Am J Physiol Endocrinol Metab. 2008;295:E1095–105. doi: 10.1152/ajpendo.90483.2008. - DOI - PubMed

Publication types

MeSH terms