

Phosphorylation of the exchange factor DENND3 by ULK in response to starvation activates Rab12 and induces autophagy
- PMID: 25925668
- PMCID: PMC4467855
- DOI: 10.15252/embr.201440006
Phosphorylation of the exchange factor DENND3 by ULK in response to starvation activates Rab12 and induces autophagy
Abstract
Unc-51-like kinases (ULKs) are the most upstream kinases in the initiation of autophagy, yet the molecular mechanisms underlying their function are poorly understood. We report a new role for ULK in the induction of autophagy. ULK-mediated phosphorylation of the guanine nucleotide exchange factor DENND3 at serines 554 and 572 upregulates its GEF activity toward the small GTPase Rab12. Through binding to LC3 and associating with LC3-positive autophagosomes, active Rab12 facilitates autophagosome trafficking, thus establishing a crucial role for the ULK/DENND3/Rab12 axis in starvation-induced autophagy.
Keywords: 14‐3‐3; DENN domain; GEF; LC3; guanine nucleotide exchange factor.
© 2015 The Authors.
Figures
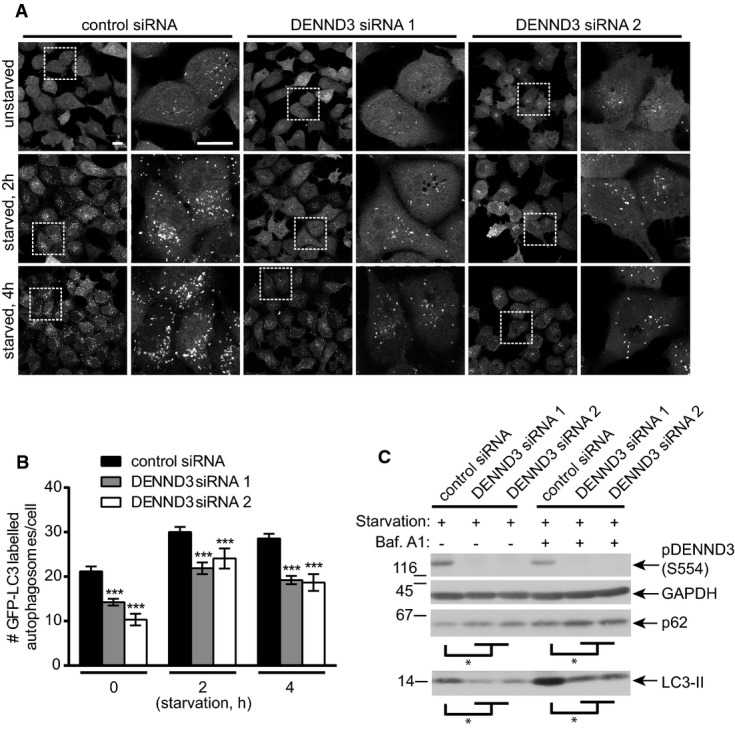
H1299 cells stably expressing GFP-LC3 were transfected with control siRNA or two DENND3 siRNAs and were subsequently left unstarved or were starved with Earle's balanced salt solution (EBSS) for 2 or 4 h. Cells were then processed for cytochemical detection of GFP. The images on the right of each treatment are magnified views of the areas indicated by the white boxes on the image to the left. The scale bars represent 20 μm.
The number of GFP-positive autophagosomes from images as in (A) was counted from n > 400 cells for each treatment over 3 repeats. The bars represent mean ± SEM. Statistical analysis employed one-way ANOVA followed by Dunnett's post-test. ***P < 0.001.
Cells were transfected with control siRNA or two siRNAs targeting DENND3 and were subsequently starved with EBSS for 6 h in the presence or absence of bafilomycin A1 (Baf. A1, 100 nM). Lysates were immunoblotted with antibodies recognizing the indicated proteins (n = 3 repeats). The levels of LC3-II and p62 normalized to GAPDH level. Statistical analysis employed one-way ANOVA followed by Dunnett's post-test. *P < 0.05.
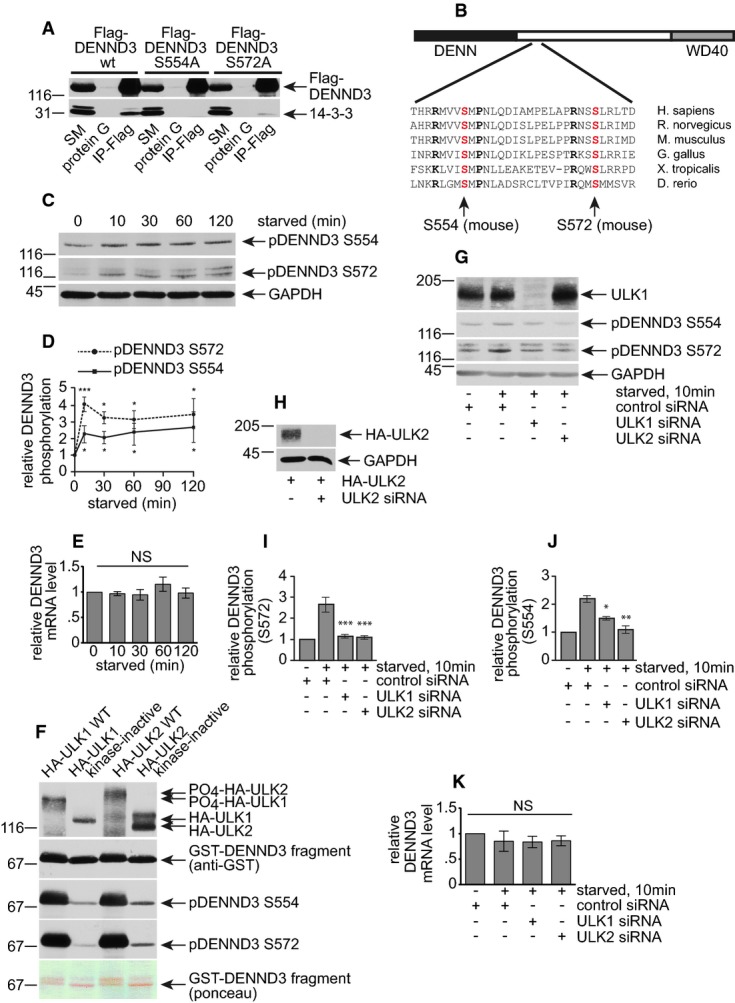
A Lysates from HEK-293T cells transfected with Flag-DENND3 wild-type (WT), S554A or S572A mutant were incubated with protein G beads alone or protein G beads coupled to anti-Flag monoclonal antibody (IP-Flag). Proteins bound specifically to the beads were processed for Western blot with anti-Flag and anti-pan-14-3-3 antibodies. An aliquot of the cell lysate (starting material, SM) equal to 10% of that added to the beads was analyzed in parallel (n = 3 repeats).
B Schematic diagram of DENND3 with a N-terminal DENN domain, a C-terminal WD40 domain, and a presumably weakly structured linker region (white box). The aligned sequences are from a region of the linker and indicate the high degree of conservation across various vertebrate species. S554 and S572 (position based on the mouse sequence) are indicated.
C HeLa cells were left unstarved (0 min) or were starved with EBSS for the indicated time periods. Lysates were immunoblotted with antibodies recognizing the indicated proteins.
D Relative DENND3 phosphorylation at serine 554 and serine 572 was determined from 3 experiments as in (C). Points represent mean ± SEM. Statistical analysis employed one-way ANOVA followed by Dunnett's post-test. ***P < 0.001, *P < 0.05.
E HeLa cells were processed as in (C), followed by quantitative real-time PCR (n = 4 repeats). Bars represent mean ± SEM. Statistical analysis employed one-way ANOVA followed by Dunnett's post-test. NS = not significant.
F Purified GST-DENND3 (538–973) was subjected to in vitro phosphorylation by purified HA-ULKs (n = 3 repeats). Note that the WT ULK1 and ULK2 run higher on SDS–PAGE than the kinase-inactive forms, due to autophosphorylation, and a shift of the phosphorylated GST-DENND3 can also be seen on a Ponceau-stained transfer.
G HeLa cells were transfected with control siRNA or siRNA targeting ULK1 or ULK2 and were subsequently left unstarved or starved with EBSS for 10 min. Lysates were immunoblotted with the indicated antibodies (n = 3 repeats).
H For validating the ULK2 siRNA knockdown efficiency without workable antibody, HeLa cells were transfected with HA-tagged ULK2 with or without siRNA for ULK2 and lysates were immunoblotted with the indicated antibodies (n = 3 repeats).
I, J Relative DENND3 phosphorylation at S572 (H) and S554 (I) was determined from three repeats as in (F). Bars represent mean ± SEM. Statistical analysis employed one-way ANOVA followed by Tukey's post-test. ***P < 0.001, **P < 0.01. *P < 0.05.
K HeLa cells were processed as in (G), followed by qPCR (n = 4 repeats). Bars represent mean ± SEM. Statistical analysis employed one-way ANOVA followed by Tukey's post-test. NS = not significant.
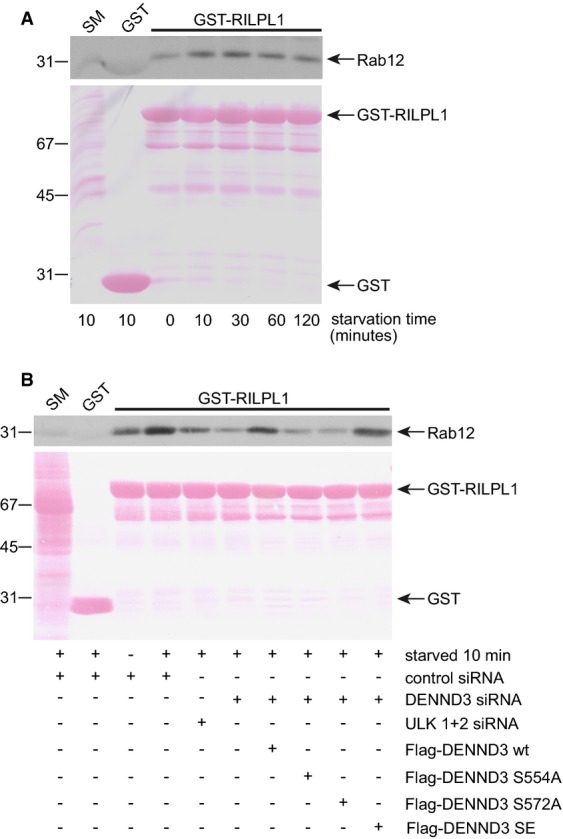
HeLa cells were left unstarved or were starved with EBSS for the indicated time. Lysates were then prepared and incubated with GST or GST-RILPL1 coupled to glutathione-Sepharose beads. Protein specifically bound to the beads was processed for Western blot with antibody recognizing Rab12. GST and GST-RILPL1 are indicated in the Ponceau-stained transfer. An aliquot of the lysate (starting material, SM) equal to 5% of that added to the beads was analyzed in parallel (n = 3 repeats).
HeLa cells were treated with control siRNA or with siRNA for DENND3 or ULK1 and ULK2. Additionally, cells that were treated with DENND3 siRNA were subsequently transfected with wild-type (WT) DENND3 or DENND3 with S554A, S572A, or S to E double mutations. The cells were subsequently starved with EBSS for 10 min, and then, lysates were prepared and incubated with GST or GST-RILPL1 coupled to glutathione-Sepharose beads. Protein specifically bound to the beads was processed for Western blot with antibody recognizing Rab12. GST and GST-RILPL1 are indicated in the Ponceau-stained transfer. An aliquot of the lysate (starting material, SM) equal to 2.5% of that added to the beads was analyzed in parallel (n = 3 repeats).
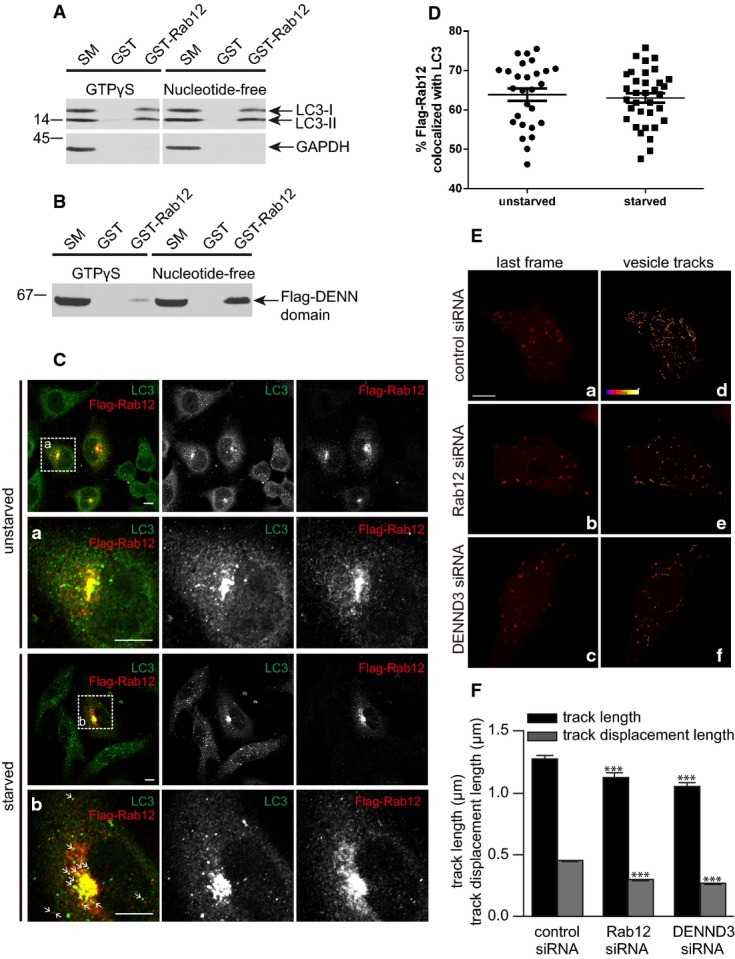
Lysates prepared from HeLa cells starved with EBSS for 4 h were incubated with GST or GST-Rab12 pre-bound to glutathione-Sepharose beads. GST-Rab12 was loaded with GTPγS and stabilized with the addition of MgCl2 or was rendered nucleotide-free by the addition of EDTA. GST was processed in the same manner. Proteins specifically bound to the beads were processed for Western blot with antibodies against the indicated proteins. An aliquot of the cell lysate (starting material, SM) equal to 1% of that added to the beads was analyzed in parallel (n = 3 repeats).
Lysates from HEK-293T cells transfected with Flag-tagged DENN domain of DENND3 were incubated with GST or GST-Rab12 pre-bound to glutathione-Sepharose beads and treated as described in (A). Proteins bound specifically to the beads were processed for Western blot with anti-Flag antibody. An aliquot of the cell lysate (starting material, SM) equal to 10% of that added to the beads was analyzed in parallel (n = 3 repeats).
HeLa cells transfected with Flag-Rab12 were left unstarved or were starved with EBSS for 40 min and were subsequently processed for immunocytochemistry with antibodies recognizing Flag and LC3. The second rows of panels under each condition are a magnified view of the region labeled by the white boxes on the lower magnification image on the top. The scale bar represents 5 μm.
Co-localization of overexpressed Flag-Rab12 and LC3 was quantified using Imaris. Experiments were repeated 3 times, n = 61 cells. Bars represent mean ± SEM. Statistical analysis employed unpaired t-test.
HeLa cells, transfected with control siRNA or siRNAs targeting Rab12 or DENND3, were subsequently transfected with mCherry-LC3, starved with EBSS for 1 h and imaged live. Panels a–c (with increased brightness to highlight the puncta) show the last frames of image sequences from cells treated with control siRNA, Rab12 siRNA, and DENND3 siRNA, respectively. The scale bar represents 5 μm. Panels d–f show the same images as in a–c, respectively, overlaid with mCherry-LC3 vesicle tracks recorded during 1 min of imaging. The color of the tracks represents the time when the tracks occurred, as indicated in the color scale bar in d, which represents a time line from 0 to 60 s. The images shown here correspond to Supplementary Videos S2, S3 and S4.
LC3 vesicle track length and track displacement length were quantified from over 40 cells and 9,000 tracks. The experiments were repeated 3 times. The bars represent mean ± SEM. Statistical analysis employed one-way ANOVA followed by Dunnett's post-test. ***P < 0.001.
Comment in
-
DENND3: a signaling/trafficking interface in autophagy.Cell Cycle. 2015;14(17):2717-8. doi: 10.1080/15384101.2015.1071136. Epub 2015 Jul 15. Cell Cycle. 2015. PMID: 26177209 Free PMC article. No abstract available.
References
-
- Mizushima N, Komatsu M. Autophagy: renovation of cells and tissues. Cell. 2011;147:728–741. - PubMed
Publication types
MeSH terms
Substances
Grants and funding
LinkOut - more resources
Full Text Sources
Other Literature Sources
Molecular Biology Databases
Research Materials
