. 2015 Apr 29;35(17):6654-66.
doi: 10.1523/JNEUROSCI.4667-14.2015.

A network of visual motion-sensitive neurons for computing object position in an arthropod

Affiliations

A network of visual motion-sensitive neurons for computing object position in an arthropod

Violeta Medan et al. J Neurosci. .

Abstract

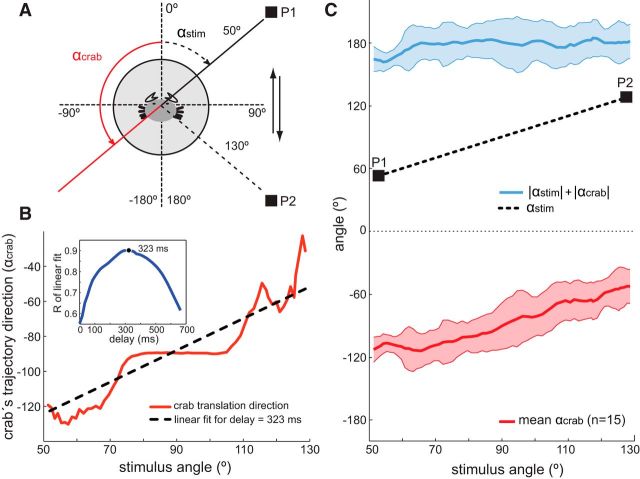
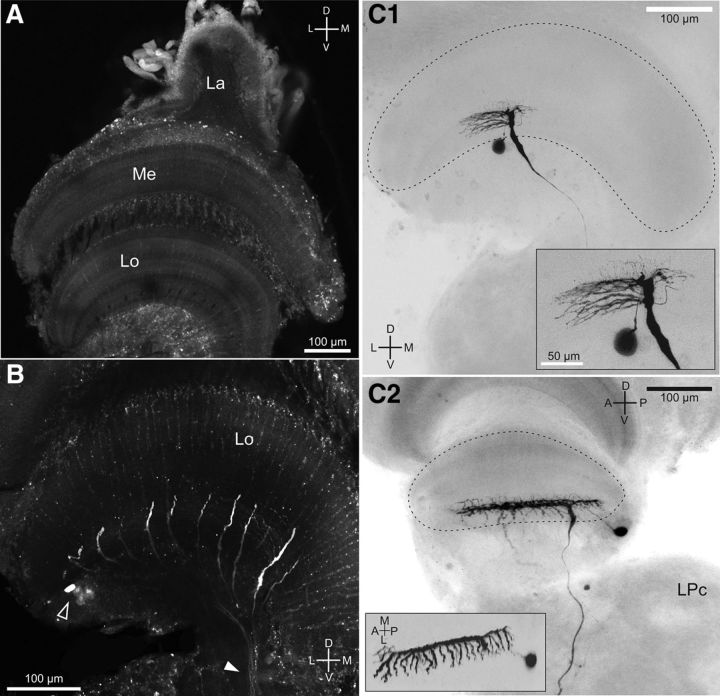
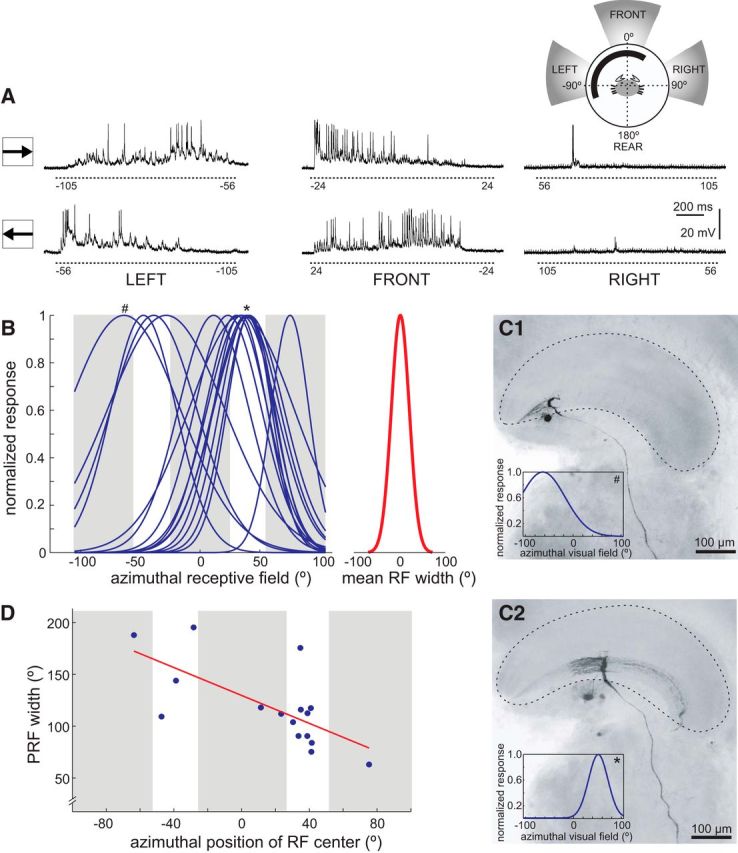
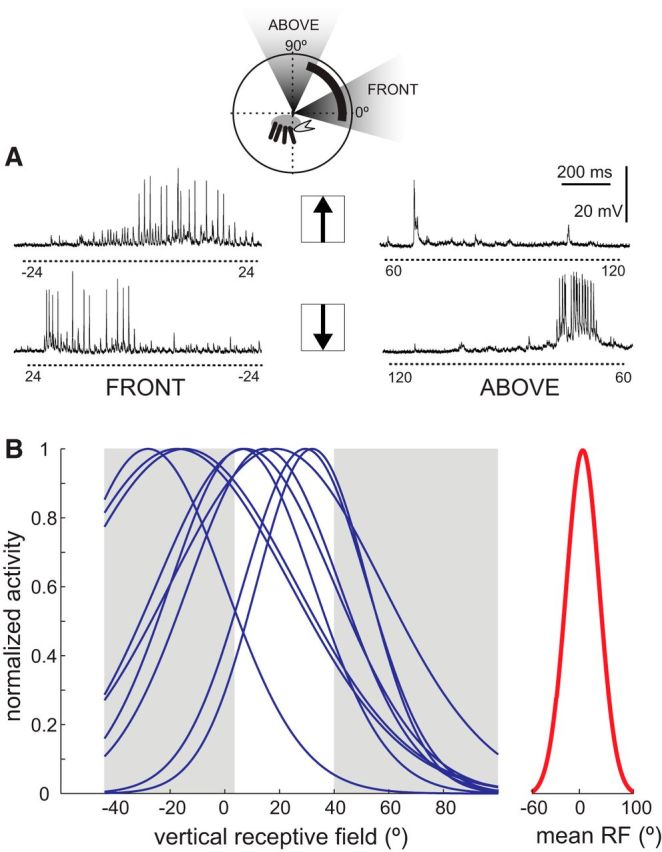
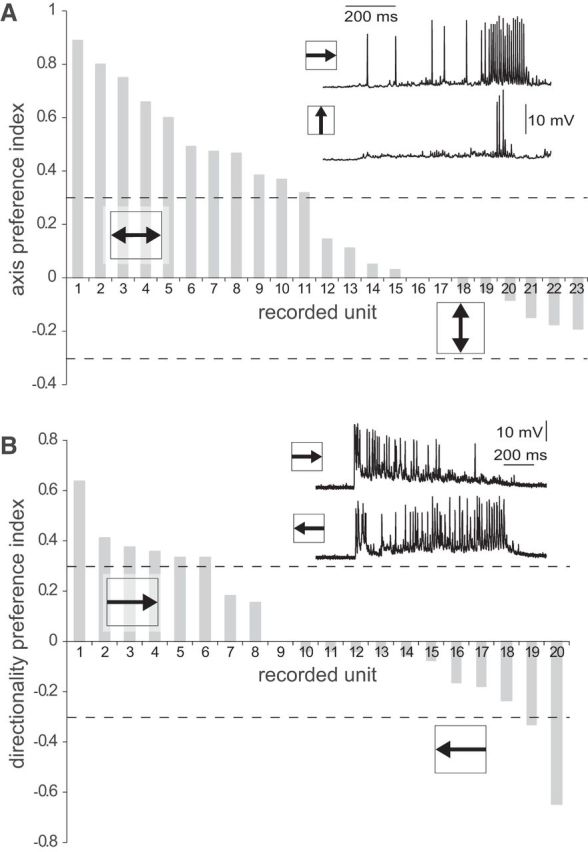
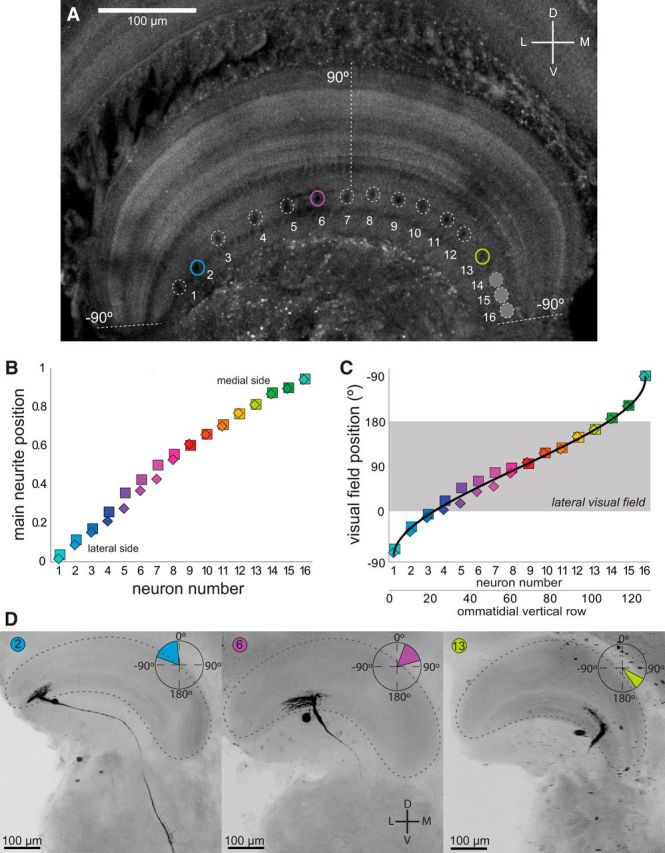
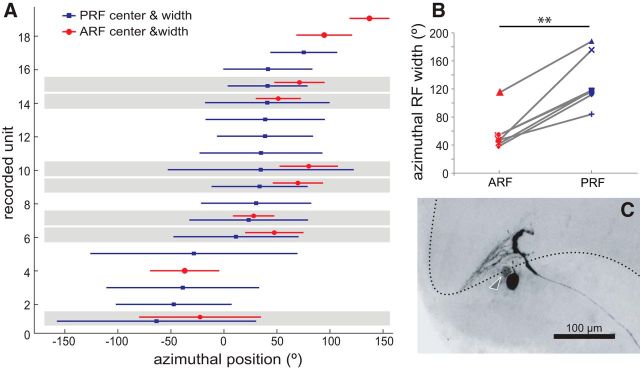
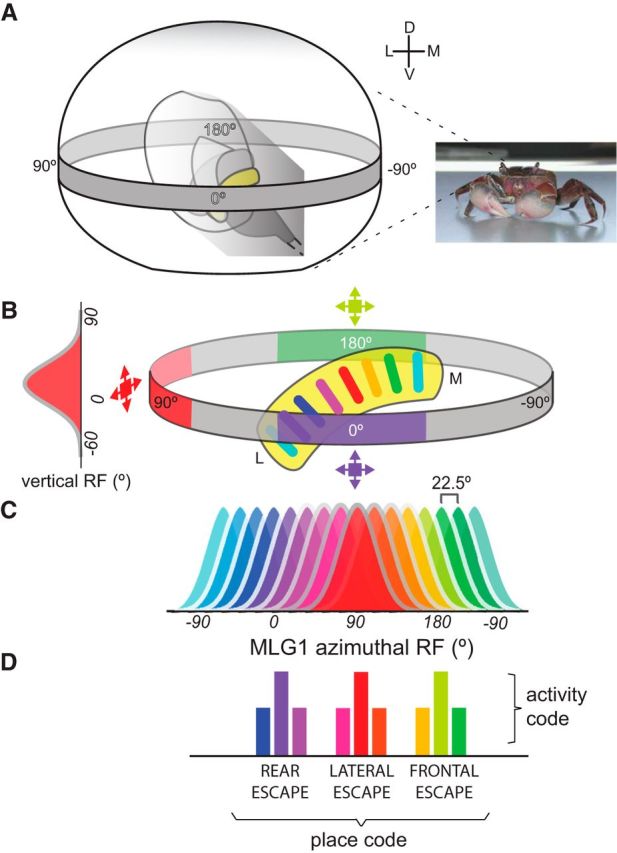
Highly active insects and crabs depend on visual motion information for detecting and tracking mates, prey, or predators, for which they require directional control systems containing internal maps of visual space. A neural map formed by large, motion-sensitive neurons implicated in processing panoramic flow is known to exist in an optic ganglion of the fly. However, an equivalent map for processing spatial positions of single objects has not been hitherto identified in any arthropod. Crabs can escape directly away from a visual threat wherever the stimulus is located in the 360° field of view. When tested in a walking simulator, the crab Neohelice granulata immediately adjusts its running direction after changes in the position of the visual danger stimulus smaller than 1°. Combining mass and single-cell staining with in vivo intracellular recording, we show that a particular class of motion-sensitive neurons of the crab's lobula that project to the midbrain, the monostratified lobula giants type 1 (MLG1), form a system of 16 retinotopically organized elements that map the 360° azimuthal space. The preference of these neurons for horizontally moving objects conforms the visual ecology of the crab's mudflat world. With a mean receptive field of 118°, MLG1s have a large superposition among neighboring elements. Our results suggest that the MLG1 system conveys information on object position as a population vector. Such computational code can enable the accurate directional control observed in the visually guided behaviors of crabs.

Keywords: cell ensemble; crab; escape direction; giant lobula neurons; insect; population coding.


Figures

Figure 1.
Figure 1.
Directionality of the behavioral visual escape response. A, Locomotor activity was studied in a walking simulator that recorded the trajectory of the crab. Activity in the x and y-axis was convolved to obtain the directional vector of the crab's trajectory (αcrab, solid red) in response to back and forth motion of a black square (12 × 12 cm). The computer-generated visual stimulus moved along an horizontal trajectory (between point P1 and P2) covering an arc of 80° in the lateral visual field of the animal (from 50° to 130°, αstim, dashed black) at 18 cm/s (details in Materials and Methods). B, Individual relationship between stimulus direction and crab's escape direction (trajectories back and forth averaged). Example of an individual crab escape direction versus stimulus angle (solid red) and linear fit (dashed black) considering a stimulus-response latency of 323 ms. The individual latency was calculated, finding the highest correlation coefficient between crab's and stimulus direction for delays between 0 and 700 ms (inset, see Materials and Methods). C, Crabs keep their escape direction directly away from the visual stimulus. Mean crab response ± SD (αcrab, solid red and shaded red area, n = 15 crabs) to movement of a visual stimulus between P1 and P2 (αstim, dashed black,). The sum of αcrab and αstim absolute values (mean ± SD, solid blue and shaded area) shows that crabs keep their escape direction 180° away from the stimulus.
Figure 2.
Figure 2.
Anatomical properties of the MLG1 ensemble. A, Confocal stack of optic neuropils from N. granulata as seen by autofluorescence. Below the retina (data not shown), three retinotopic neuropiles, the lamina (La), medulla (Me), and lobula (Lo) map the entire crab's visual field. B, Mass staining with dextran–Alexa Fluor 488 reveals the main neurites of MLG1s, as well as their somata (empty arrowhead) and the axonal tract leaving the lobula toward midbrain centers (solid arrowhead). C, Intracellular staining of MLG1s. C1, Tangential view of the lobula revealing fine details of MLG1 secondary dendrites (projecting long lateral and shorter medial neurites), soma, and axon, which thins as it exits the lobula. The inset shows an enlarged image were dorsally projecting tertiary dendrites are apparent. C2, Transversal section of another MLG1 showing that MLG1 dendrites cover the whole anteroposterior extent of the lobula. Note that the cluster of MLG1 somata is located between the lobula and the lateral protocerebrum (LPc). Inset, Dorsal projection of the same neuron where the fork-like secondary neurites are clearly seen. D, Dorsal; V, ventral; L, lateral; M, medial; A, anterior; P, posterior.
Figure 3.
Figure 3.
Azimuthal receptive field of the MLG1s. A, Representative responses of an MLG1 to a black square stimulus (5 × 5 cm) moved clockwise (top traces) and counterclockwise (bottom traces) across left, front, and right screens (inset in the upper right shows the stimulated area in gray). Numbers below dashed lines indicate the stimulus angular position at the beginning and end of motion. Note that initial angular positions of clockwise motion correspond to final positions of counterclockwise motion. B, Azimuthal PRF width of 16 recorded units. To estimate the width of each MLG1, clockwise and counterclockwise activity were aligned, normalized, and fitted to a Gaussian distribution. The peak ± 2 SDs indicates the center and width of the PRF. Left, PRF distribution of 16 MLG1s (blue lines). Right (red trace), Mean fit width (mean ± SD: 118.44° ± 38.9°). Fits indicated by # and * correspond to neurons shown in C1 and C2. C, Intracellularly stained neurons and their PRF fit (inset). Both images correspond to frontal views of right lobula neuropils. The neuron in C1 is located toward the lateral pole of the lobula and its PRF center (−64°, #) is oriented toward the left (i.e., to the contralateral visual field for the right eye, see inset of A). The neuron in C2 is located near the middle of the lobula and its PRF center (41°, *) is oriented to the front-right visual field. D, Relationship between PRF width and position of PRF center. Within the azimuthal region evaluated, there is a negative linear relationship between PRF width and position of the PRF center; that is, neurons mapping the lateral visual field (PRF >0°) have narrower PRFs than those mapping the frontal and left visual fields (PRF <0°; data corresponding to right eyes). Abbreviations are as in Figure 2.
Figure 4.
Figure 4.
Vertical receptive field of the MLG1s. A, Individual vertical PRF characterization. Example of responses to upward (top traces) and downward (lower traces) movement of the visual stimulus in the front and upper screens (inset shows the stimulated area). Numbers below dashed lines indicate the stimulus angular position at the beginning and end of motion (other considerations are as in Fig. 3). B, Vertical PRF was analyzed following the procedures described in Figure 3. Left, Receptive field fits of 9 MLG1s. Right, Average of these fits (solid red trace, mean ± SD elevation: 5.37° ± 21.21°; mean ± SD width: 124.12° ± 31.49°).
Figure 5.
Figure 5.
Axis and direction preference. A, Distribution of the API (see Materials and Methods) of 23 MLG1 neurons. The majority of these units showed stronger responses to motion along the horizontal than the vertical axis (exemplified in the inset). Neurons with absolute API values >0.33 (dashed lines) are considered to have axis motion preference. Although 11 of 23 showed a preference for horizontal motion, none reached the criteria for vertical preference. B, Distribution of the DI (see Materials and Methods) of 20 MLG1 neurons. Neurons are considered to have directional preference when their DI absolute value is >0.33 (dashed lines). From 20 MLG1s evaluated, 12 showed no directional preference (exemplified in the inset), six showed a weak preference (DI just above criteria), and only two exhibited a clear preference (one for each direction).
Figure 6.
Figure 6.
ARFs of the MLG1s. A, Transversal confocal section of an unstained lobula in which the profiles of the main neurite (surrounded by dashed circles) of 13 MLG1 neurons can be observed (three additional profiles at the medial side of the lobula faint in this focal plane are also indicated). The lateromedial lobula axis contains a representation of the 360° azimuthal space (Berón de Astrada et al., 2011). Dashed lines indicate region of the lobula where the lateral visual pole of the eye (90°) and the medial visual pole (−90°, the side looking toward the other eye) are represented. B, Distribution of MLG1 primary neurites along the normalized lateromedial length of the lobula. The relative distance of each profile to the lateral end of the lobula was calculated. Squares and diamonds correspond to data from two animals. C, Replot of the relative position of each neuron within the lobula (y-axis in Fig. 6B) as the visual field position represented across the lobula. The data were adjusted taking into account the nonlinear representation of the azimuthal space across the lobula (see Results). Most MLG1s (10 of 16) reside within the lobula region that maps the lateral visual hemisphere (0° to 180°, gray box). D, Representative examples of intracellular stained neurons located (from left to right) in the lateral, central, and medial regions of the lobula. Following the ordering shown in AC, these neurons would correspond to element numbers 2, 6, and 13, respectively (identified by a single color code throughout the figure panels). Insets show the ARF of each neuron. Abbreviations are as in Figure 2.
Figure 7.
Figure 7.
Anatomical and physiological estimates of the MLG1s receptive field. A, Anatomical (red) and physiological (blue) receptive field center and width (symbols and lines, respectively) of recorded and stained units are represented along the azimuthal visual axis. In seven of these neurons, both the ARFs and PRFs could be positively determined (shaded data pairs). PRFs are consistently wider and left shifted compared with their corresponding ARFs. B, PRF width exceeds the width predicted by the anatomical calculations by ∼70° (**p < 0.001, n = 7). C, Example of dye coupling between neighbor MLG1s. Shown is the detail of the same neuron of Figure 3C1 showing a second soma faintly stained (arrowhead).
Figure 8.
Figure 8.
The MLG1 system for computing azimuthal positions of moving objects. A, Diagram showing a frontal view of the right eye of the crab containing the optic neuropils (the lobula is in yellow) within a representation of the visual space where the azimuthal coordinates are indicated at level of the horizontal gray band. The omatidial array collects visual information from 360° in the azimuthal plane. Information about object motion is conveyed through the retinotopic neuropils to MLG1 neurons in the lobula, which send it to the midbrain. B, Color-coded diagram showing the correspondence between the position occupied by different MLG1 neurons within the lobula and the sectors of visual space to which they are sensitive. The activation of a particular MLG1 provides information on a specific stimulus location, which would be used for organizing the directional control of escaping from visual stimuli, as shown in Figure 1. Therefore, an object approaching the crab from its frontal, lateral, or rear side (blue, red, or green expanding squares, respectively) will correspondingly activate the bluish, reddish, or greenish units represented in C, which would determine the rear, lateral, or frontal escape direction of the crab (D). The vertical PRF represented in the left side of B shows that the peak of MLG1 vertical sensitivity is near the equator of the eye. C, Color bells representing the receptive field distribution of the 16 MLG1 units across the 360° azimuthal space (for simplicity, the nonlinear representation of the azimuthal space across the lobula was omitted). The scheme highlights the large degree of superposition among the MLG1 units. D, Bluish, reddish, and greenish bars represent the response level of three different sets of neurons to a stimulus approaching the animal from different sites (the representation of three neurons per set is arbitrary and is for illustration purposes only). The activity of MLG1 neurons are known to finely encode the dynamic of stimulus expansion (Oliva and Tomsic, 2014), but for each particular dynamic, the three sets of neurons would show the same activity profile (represented by similar bar heights). Therefore, the MLG1 system may operate with a double code: an activity code to convey information on stimulus dynamic and a place code to convey information on stimulus position.

References

    1. Barnes WJP, Nalbach H-O. Eye movements in freely moving crabs: their sensory basis and possible role in flow-field analysis. Comparative Biochemistry and Physiology Part A: Physiology. 1993;104:675–693.
    1. Berón de Astrada M, Tomsic D. Physiology and morphology of visual movement detector neurons in a crab (Decapoda: Brachyura) J Comp Physiol A Neuroethol Sens Neural Behav Physiol. 2002;188:539–551. doi: 10.1007/s00359-002-0328-4. - DOI - PubMed
    1. Berón de Astrada M, Medan V, Tomsic D. How visual space maps in the optic neuropils of a crab. J Comp Neurol. 2011;519:1631–1639. doi: 10.1002/cne.22612. - DOI - PubMed
    1. Berón de Astrada M, Bengochea M, Medan V, Tomsic D. Regionalization in the eye of the grapsid crab Neohelice granulata (Chasmagnathus granulatus): variation of resolution and facet diameters. J Comp Physiol A Neuroethol Sens Neural Behav Physiol. 2012;198:173–180. doi: 10.1007/s00359-011-0697-7. - DOI - PubMed
    1. Berón de Astrada M, Bengochea M, Sztarker J, Delorenzi A, Tomsic D. Behaviorally related neural plasticity in the arthropod optic lobes. Curr Biol. 2013;23:1389–1398. doi: 10.1016/j.cub.2013.05.061. - DOI - PubMed

Publication types

LinkOut - more resources