. 2015 Apr 29;35(17):6667-88.
doi: 10.1523/JNEUROSCI.4662-14.2015.

Prototypic and arkypallidal neurons in the dopamine-intact external globus pallidus

Affiliations

Prototypic and arkypallidal neurons in the dopamine-intact external globus pallidus

Azzedine Abdi et al. J Neurosci. .

Abstract

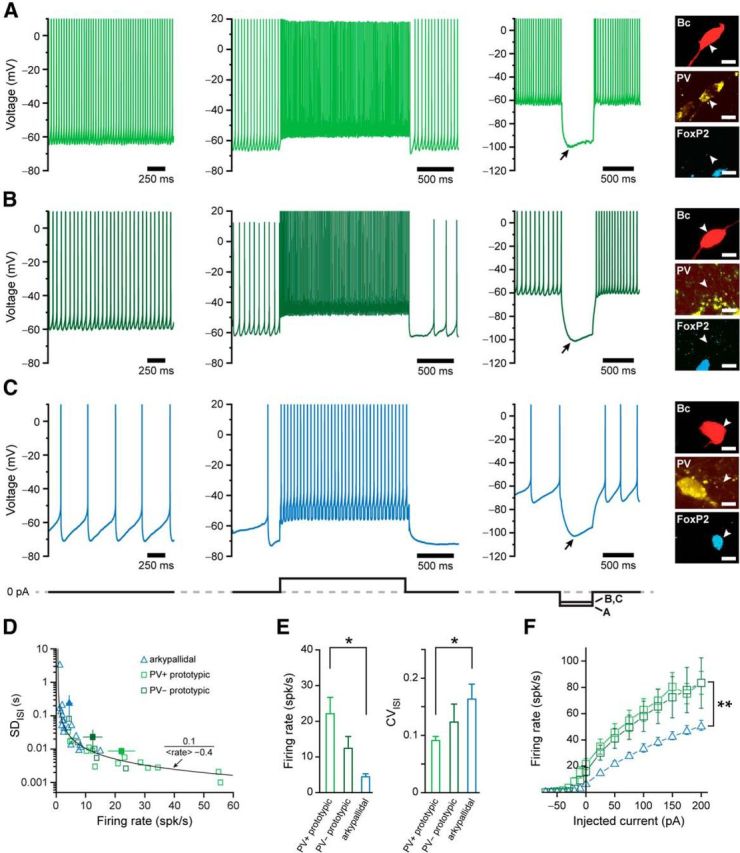
Studies in dopamine-depleted rats indicate that the external globus pallidus (GPe) contains two main types of GABAergic projection cell; so-called "prototypic" and "arkypallidal" neurons. Here, we used correlative anatomical and electrophysiological approaches in rats to determine whether and how this dichotomous organization applies to the dopamine-intact GPe. Prototypic neurons coexpressed the transcription factors Nkx2-1 and Lhx6, comprised approximately two-thirds of all GPe neurons, and were the major GPe cell type innervating the subthalamic nucleus (STN). In contrast, arkypallidal neurons expressed the transcription factor FoxP2, constituted just over one-fourth of GPe neurons, and innervated the striatum but not STN. In anesthetized dopamine-intact rats, molecularly identified prototypic neurons fired at relatively high rates and with high regularity, regardless of brain state (slow-wave activity or spontaneous activation). On average, arkypallidal neurons fired at lower rates and regularities than prototypic neurons, and the two cell types could be further distinguished by the temporal coupling of their firing to ongoing cortical oscillations. Complementing the activity differences observed in vivo, the autonomous firing of identified arkypallidal neurons in vitro was slower and more variable than that of prototypic neurons, which tallied with arkypallidal neurons displaying lower amplitudes of a "persistent" sodium current important for such pacemaking. Arkypallidal neurons also exhibited weaker driven and rebound firing compared with prototypic neurons. In conclusion, our data support the concept that a dichotomous functional organization, as actioned by arkypallidal and prototypic neurons with specialized molecular, structural, and physiological properties, is fundamental to the operations of the dopamine-intact GPe.

Keywords: anatomy; arkypallidal; basal ganglia; electrophysiology; globus pallidus; transcription factor.


Figures

Figure 1.
Figure 1.
Most neurons of the dopamine-intact GPe express either PV or PPE. A, Coronal sections illustrating the rostral, central, and caudal levels of the adult rat GPe at which the molecular expression profiles of neurons were quantified. For GPe neuron sampling in rostral and central sections, the ventral borders of GPe (red lines) were defined according to the medial edge of the anterior commissure (blue) and the bottom edge of the internal capsule (green). In caudal sections, the ventral border of GPe was defined according to the fornix (purple). Only those neurons located dorsal to these borders were considered as GPe (yellow). Aa, Anterior amygdaloid area; Ctx, cortex; fi, fimbria of the hippocampus; lv, lateral ventricle; Pa, preoptic area; Str, dorsal striatum; Thal, anterior thalamus. Adapted from Paxinos and Watson (2007). A standard stereotaxic reference (approximate distance posterior of Bregma) is given for each rostrocaudal level. B, Proportions of all GPe neurons, defined with the pan-neuronal marker HuCD, expressing the given molecular markers (data pooled across rostral, central, and caudal GPe). In this and similar graphs, gray bars represent grand averages from all rats tested and each black dot represents the average from an individual rat. C, Immunofluorescence signals for HuCD, PV, and PPE in the GPe. Immunoreactivity for PPE was punctate and localized to the perikarya of neurons. PPE+ GPe neurons (arrows) do not coexpress PV, and vice versa. A minority of GPe neurons do not express either PV or PPE (arrowheads). D, Proportions of PV+ GPe neurons coexpressing the given molecular markers. E, Proportions of PPE+ GPe neurons coexpressing the given molecular markers. F, Maps showing distributions of PV+ neurons, PPE+ neurons, and PV/PPE neurons across the GPe (data from 10-μm-thick optical sections from one rat). The three cell types are distributed relatively evenly and are intermingled with each other. G, Prevalence of PV+ neurons, PPE+ neurons, and PV/PPE neurons at rostral, central, and caudal levels of GPe. Average proportions of these cell types in rats 1–3 are indicated with colored lines. Scale bar: C, 30 μm.
Figure 2.
Figure 2.
The neurochemical differences of the two major populations of GABAergic neurons in GPe tally with disparities in transcription factor expression. A, Immunofluorescence signals for HuCD, PPE, FoxP2, and PV in the GPe. Immunoreactivity for the transcription factor FoxP2 was localized to the nuclei of neurons. PPE+ neurons coexpress FoxP2 but not PV (arrows). B, Signals for HuCD, FoxP2, Meis2, and PV in the GPe. Note the high level of coexpression of the transcription factors FoxP2 and Meis2 in neurons (arrows). C, Signals for HuCD, ER81, PV, and FoxP2 in the GPe. The transcription factor ER81 was localized to the cytoplasm and nuclei of GPe neurons. Note the high level of coexpression of ER81 and PV, and that FoxP2+ neurons (arrows) do not coexpress ER81. D, Proportions of FoxP2+ GPe neurons coexpressing a given molecular marker. E, Proportions of Meis2+ GPe neurons coexpressing FoxP2 or PV. F, Proportions of ER81+ GPe neurons coexpressing PV or FoxP2. G, Signals for ChAT, the transcription factor Nkx2-1, FoxP2, and PV in the GPe. Most ChAT+ neurons (double arrowhead) coexpress Nkx2-1, but not PV or FoxP2. H, Proportions of ChAT+ GPe neurons coexpressing a given molecular marker. Scale bars: A–C, G, 30 μm.
Figure 3.
Figure 3.
The two major populations of GABAergic neurons in GPe are distinguished by their mutually exclusive expression of the transcription factors Nkx2-1/Lhx6 or FoxP2. A, Immunofluorescence signals for HuCD, Nkx2-1, PV, and FoxP2 in the GPe. Most Nkx2-1+ neurons are also PV+. FoxP2+ neurons (arrows) do not coexpress Nkx2-1. B, Signals for PV, Lhx6, Nkx2-1, and FoxP2 in the GPe. Note the high level of coexpression of the transcription factors Lhx6 and Nkx2-1. FoxP2+ neurons (arrows) do not coexpress Lhx6. C, Signals for HuCD, Npas1, FoxP2, and PV in the GPe. Most Npas1+ neurons coexpress FoxP2 (arrows) but not PV. Some Npas1+ neurons do not express either marker (arrowhead). D, Signals for Lhx6, Npas1, FoxP2, and PV in the GPe. Most Npas1+/FoxP2 neurons also express Lhx6 (double arrowheads). E, Proportions of Nkx2-1+ GPe neurons coexpressing a given molecular marker. F, Proportions of Lhx6+ GPe neurons coexpressing a given molecular marker. G, Proportions of Npas1+ GPe neurons coexpressing a given molecular marker. Scale bars: A–D, 30 μm.
Figure 4.
Figure 4.
Pallidosubthalamic and pallidostriatal neurons are differentiated by their proportional expression of distinct sets of molecular markers. A, B, Verification of sites of injection of a lentiviral vector expressing EGFP into the STN (A) or dorsal striatum (B). A, Left, The STN was delineated according to the boundaries (dashed lines) of a group of densely packed neurons immunoreactive for FoxP2. Right, EGFP-expressing cells in the same coronal section. Bi, Low-magnification image of EGFP+ cells in a central region of dorsal striatum (within dashed lines). Bii, Higher-magnification image of EGFP+ neurons and glia within the area boxed with white lines in Bi. ac, Anterior commissure; cc, corpus callosum; cp, cerebral peduncle; Ctx, cortex; lv, lateral ventricle; ZIV, ventral division of the zona incerta. Approximate distances posterior/anterior to Bregma are given. C, Left, GPe neurons innervating the STN were identified by their expression of EGFP after retrograde viral transduction (retro). Most of these EGFP+ pallidosubthalamic neurons (white arrows) coexpress Nkx2-1 and PV. However, identified pallidosubthalamic neurons do not express FoxP2. D, Many GPe neurons innervating the dorsal striatum, as identified by EGFP expression after separate retrograde viral transduction, coexpress FoxP2 (arrowheads). Another major population of identified pallidostriatal neurons expresses Nkx2-1 (white arrows). E, Most identified pallidostriatal neurons express Npas1 (double arrowheads). F, Proportions of EGFP+ pallidosubthalamic neurons that coexpress the given molecular marker or combination of markers. Virtually all pallidosubthalamic neurons express Nkx2-1. G, H, Proportions of EGFP+ pallidostriatal neurons coexpressing the given molecular marker or combination of markers. Approximately one-half of pallidostriatal neurons express FoxP2 (G), but the vast majority express Npas1 (H). H, “Npas1 (total)” refers to the sum of Npas1+/FoxP2+, Npas1+/PV+, and Npas1+ (only) populations of transduced neurons. Scale bars: A, 400 μm; Bi, 1 mm; Bii, C–E, 30 μm.
Figure 5.
Figure 5.
Molecular signatures and projection targets of prototypic neurons and arkypallidal neurons. A, Schematic summary of the two major GABAergic cell types in the GPe of the rat. Colored areas are scaled to show the relative population sizes of arkypallidal neurons (blue) and prototypic neurons (light and dark greens) with respect to all GABAergic GPe neurons. The distinct sets of molecular markers that identify each cell type are indicated. However, both arkypallidal neurons and some prototypic neurons express Npas1 (within red dashed line). B, Schematic summary of the major GPe cell types innervating the STN (left) or dorsal striatum (right). Almost all pallidosubthalamic neurons are of the prototypic cell type. The vast majority of pallidostriatal neurons express Npas1. Arkypallidal neurons do not innervate STN but are the major GPe cell type innervating striatum.
Figure 6.
Figure 6.
The in vivo firing of molecularly identified prototypic neurons and arkypallidal neurons is distinct in dopamine-intact rats. A, Typical single-unit activity of a PV+ prototypic GPe neuron recorded in a dopamine-intact adult rat. The same unit was recorded during cortical SWA and cortical “activation,” as defined in ECoG. Regardless of brain state, the unit fired at relatively high rates and regular patterns. After recording, the same unit was juxtacellularly labeled with neurobiotin (Nb) and then tested for its expression of various molecular markers (insets). This neuron (arrowhead) coexpressed Nkx2-1 and PV, but not FoxP2, thus identifying it as prototypic. B, Typical activity of a PV prototypic GPe neuron. C, Typical single-unit activity of an arkypallidal neuron recorded in a dopamine-intact adult rat. The unit fired at relatively low rates and with comparatively irregular patterns during SWA but increased its firing rate and regularity during cortical activation. This GPe neuron expressed FoxP2, but not Nkx2-1 or PV, thus identifying it as arkypallidal. D, Plot of the SDISI against mean firing rate for each GPe neuron recorded during SWA. Open symbols represent individual neurons. Solid symbols represent mean ± SEM for each cell type. Black line indicates hyperbolic function fitted to the data. Arkypallidal neurons and prototypic neurons tended to distribute within distinct and restricted aspects of the firing rate/pattern continuum. E, Same as in D but for GPe neurons recorded during cortical activation. F, Plots of the firing rates and CVISI for each prototypic neuron recorded during SWA and/or activation (Act). Open symbols represent individual neurons. Solid symbols represent mean ± SEM for this cell type. G, Same as in F but for arkypallidal neurons. H, Linear phase histograms (left) and circular plots (right) for all spikes of all prototypic neurons with firing that was significantly phase-locked to cortical slow oscillations (0.4–1.6 Hz). For clarity, two cortical slow oscillation cycles are shown in linear histograms, with data therein represented as mean ± SEM. In circular plots, vectors of the preferred firing of individual neurons are shown as lines radiating from the center. Greater vector lengths indicate lower variance in the distribution around the mean phase angle (i.e., tighter locking). Each circle on the plot perimeter represents the preferred phase (i.e., mean phase of all the spikes) of an individual neuron. The population vector length and mean angle for the preferred phases of all prototypic neurons is shown as a thick black line. On average, the firing of prototypic neurons was weakly phase-locked to the peaks of cortical slow oscillations. I, Same as in H but for arkypallidal neurons. On average, the firing of arkypallidal neurons was strongly phase-locked to oscillation peaks. Vertical calibration bars: A–C, 0.5 mV (ECoG), 1 mV (units). Horizontal calibration bars: A–C, 1 s. *p < 0.05 (Mann–Whitney U test). Scale bars A–C, insets, 10 μm.
Figure 7.
Figure 7.
Autonomous firing and intrinsic membrane properties of molecularly identified prototypic neurons and arkypallidal neurons are distinct in vitro. A, Typical activity of a PV+ prototypic GPe neuron recorded in a perforated-patch configuration in a brain slice from a juvenile dopamine-intact rat. Autonomous firing (0 pA current injection), driven firing (100 pA injection for 2 s), and response to hyperpolarizing current pulse (−100 pA or −80 pA for 500 ms; eliciting peak voltage deflections of ∼ −100 mV and a subsequent “sag” [arrows]) are shown from left to right. After perforated-patch recording, the same neuron was repatched and filled with biocytin (Bc), and then tested for its expression of molecular markers (insets). This neuron (arrowhead) expressed PV, but not FoxP2, thus identifying it as prototypic. B, Typical activity of a PV prototypic GPe neuron. C, Typical activity of an arkypallidal neuron. The neuron fired at relatively low rates. This GPe neuron expressed FoxP2, but not PV, thus identifying it as arkypallidal. D, Plot of the SDISI against mean firing rate for each GPe neuron recorded in the perforated-patch configuration. Open symbols represent individual neurons. Solid symbols represent mean ± SEM for each cell type. Black line indicates hyperbolic function fitted to the data. Arkypallidal neurons and prototypic neurons tended to distribute within distinct and restricted aspects of the firing rate/pattern continuum. E, Plots of the mean firing rates and mean CVISI for all PV+ prototypic neurons (n = 14), all PV prototypic neurons (n = 5), and all arkypallidal neurons (n = 18). On average, prototypic neurons fire at higher rates and regularities than arkypallidal neurons. *p < 0.05 (Kruskal–Wallis ANOVA, followed by Dunn's test). F, Relationship between mean firing rate and injected current (i.e., the F-I response curves). For depolarizing pulses, arkypallidal neuron firing was characterized by a significantly slower rate of growth compared with prototypic neurons. **Significantly different firing rates with all current injections ranging from −10 pA to 200 pA (p < 0.05, Kruskal–Wallis ANOVAs, followed by Dunn's tests). E, F, Data are mean ± SEM. Scale bars A–C, insets, 10 μm.
Figure 8.
Figure 8.
Prototypic neurons and arkypallidal neurons engage in autonomous “rate wandering” to different extents. A, Typical examples of the spike firing and ISIs of an identified PV+ prototypic GPe neuron that was continuously recorded for 25 min in a cell-attached configuration. Raw traces of firing (left) were taken at time points 1, 2, and 3 indicated on the ISI plot (right). B, ISI histogram for the same PV+ prototypic neuron; its mean firing rate, the SDISI, and the skewness and kurtosis values of its ISI distribution are also indicated. The activity of this neuron did not fluctuate or wander substantially over time, as reflected by its symmetrical ISI distribution and relatively low values of SDISI, kurtosis, and skewness. C, D, Typical examples of the spike firing and ISIs of an identified PV prototypic neuron. E, F, Typical example of the spike firing and ISIs of an identified arkypallidal neuron. The autonomous firing of the PV prototypic neuron and the arkypallidal neuron wandered over time, as reflected by their positively skewed ISI distributions and their relatively high values of SDISI, kurtosis, and skewness. G, Plot of kurtosis and skewness values for each prototypic neuron (n = 8 PV+; n = 4 PV) and arkypallidal neuron (n = 6) recorded for ≥15 min in a cell-attached configuration. The kurtosis and skewness values of most PV+ prototypic neurons were small and lay between −2 and 2 (dashed lines). For clarity, log scales are used after the axis breaks. H, Plot of SDISI against firing rate for the three example neurons shown in A, C, and E. Each symbol represents the SDISI and mean firing rate calculated for a group of 100 adjacent spikes fired by a single neuron. During rate wandering, individual neurons visited only a limited aspect of the activity continuum. I, Plot of SDISI against firing rate for all recorded neurons, with each symbol representing values for a group of 100 adjacent spikes of a single neuron. Even with cell-type-dependent rate wandering, arkypallidal neurons and PV+ prototypic neurons tended to distribute within distinct and restricted aspects of the population activity continuum. Bin sizes of histograms: B, 2 ms; D, 10 ms; F, 10 ms.
Figure 9.
Figure 9.
Amplitudes of persistent sodium channel currents in identified prototypic neurons and arkypallidal neurons are different. A, B, Representative in vitro recordings of persistent sodium channel currents (INaP, bottom traces) evoked in a PV+ prototypic neuron (A) and a FoxP2+ arkypallidal neuron (B) upon somatic injections of a ramp voltage command (thick black line in upper schematics). Vm, Membrane voltage. Traces were obtained by subtraction of currents evoked under control and TTX-infused conditions. C, Average peak amplitude of INaP in PV+ prototypic neurons (green) was significantly larger than that in FoxP2+ arkypallidal neurons (blue). D, Average half-activation voltages (V1/2) for INaP in prototypic and arkypallidal neurons were similar. *p = 0.014 (Mann–Whitney U test). C, D, Error bars indicate mean ± SEM; circles represent data points for individual neurons superimposed.
Figure 10.
Figure 10.
Molecularly identified prototypic neurons and arkypallidal neurons recorded in 6-OHDA-lesioned animals. A, Typical single-unit activity of a PV+ prototypic GPe neuron recorded in a 6-OHDA-lesioned adult rat. During SWA, the unit fired at relatively high rates and in time with cortical slow oscillations. However, during cortical activation, it fired at comparatively low rates. This neuron (arrowhead) coexpressed Nkx2-1 and PV, but not FoxP2, thus identifying it as prototypic. B, Typical activity of a PV prototypic GPe neuron. C, Typical single-unit activity of an arkypallidal neuron recorded in a lesioned rat. This neuron expressed FoxP2 and PPE, thus identifying it as arkypallidal. D, Plot of SDISI against mean firing rate for each GPe neuron recorded in lesioned rats during SWA. Arkypallidal neurons and prototypic neurons tended to distribute within distinct and restricted aspects of the population firing rate/pattern continuum. E, Same as in D but for GPe neurons recorded during cortical activation. There is substantial overlap in the firing properties of arkypallidal and prototypic neurons during this brain state. F, G, Firing rates and CVISI for each prototypic neuron (F) and for each arkypallidal neuron (G) recorded during SWA and/or activation (Act). H, I, Linear phase histograms (left) and circular plots (right) for all spikes of all prototypic neurons (H) or of all arkypallidal neurons (I) with firing that was significantly phase-locked to cortical slow oscillations. On average, the firing of prototypic neurons in lesioned rats was strongly phase-locked to the troughs of cortical slow oscillations, whereas the firing of arkypallidal neurons was strongly locked to oscillation peaks. Vertical calibration bars: A–C, 0.5 mV (ECoG), 1 mV (units). Horizontal calibration bars: A–C, 1 s. Scale bars: A–C, insets, 10 μm. *p < 0.05 (Mann–Whitney U test).

References

    1. Agoston Z, Schulte D. Meis2 competes with the Groucho co-repressor Tle4 for binding to Otx2 and specifies tectal fate without induction of a secondary midbrain-hindbrain boundary organizer. Development. 2009;136:3311–3322. doi: 10.1242/dev.037770. - DOI - PubMed
    1. Albin RL, Young AB, Penney JB. The functional anatomy of basal ganglia disorders. Trends Neurosci. 1989;12:366–375. doi: 10.1016/0166-2236(89)90074-X. - DOI - PubMed
    1. Anderson ME, Turner RS. A quantitative analysis of pallidal discharge during targeted reaching movement in the monkey. Exp Brain Res. 1991;86:623–632. - PubMed
    1. Arber S, Ladle DR, Lin JH, Frank E, Jessell TM. ETS gene Er81 controls the formation of functional connections between group Ia sensory afferents and motor neurons. Cell. 2000;101:485–498. doi: 10.1016/S0092-8674(00)80859-4. - DOI - PubMed
    1. Baufreton J, Atherton JF, Surmeier DJ, Bevan MD. Enhancement of excitatory synaptic integration by GABAergic inhibition in the subthalamic nucleus. J Neurosci. 2005;25:8505–8517. doi: 10.1523/JNEUROSCI.1163-05.2005. - DOI - PMC - PubMed

Publication types

MeSH terms

LinkOut - more resources