. 2015 Apr 29;35(17):6786-800.
doi: 10.1523/JNEUROSCI.0171-15.2015.

Neuropeptide receptor transcript expression levels and magnitude of ionic current responses show cell type-specific differences in a small motor circuit

Affiliations

Neuropeptide receptor transcript expression levels and magnitude of ionic current responses show cell type-specific differences in a small motor circuit

Veronica J Garcia et al. J Neurosci. .

Abstract

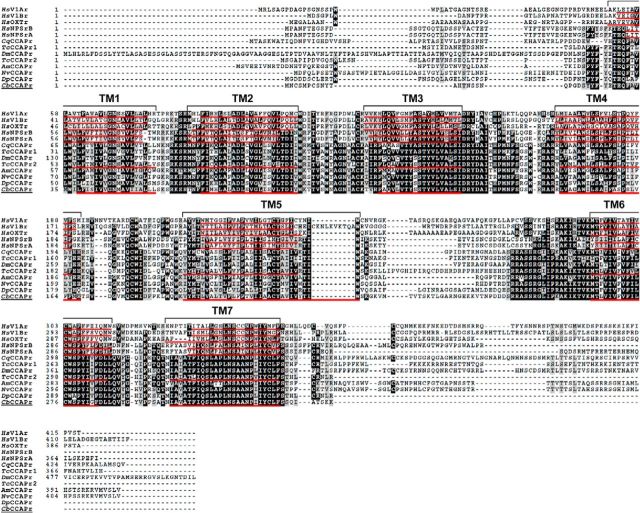
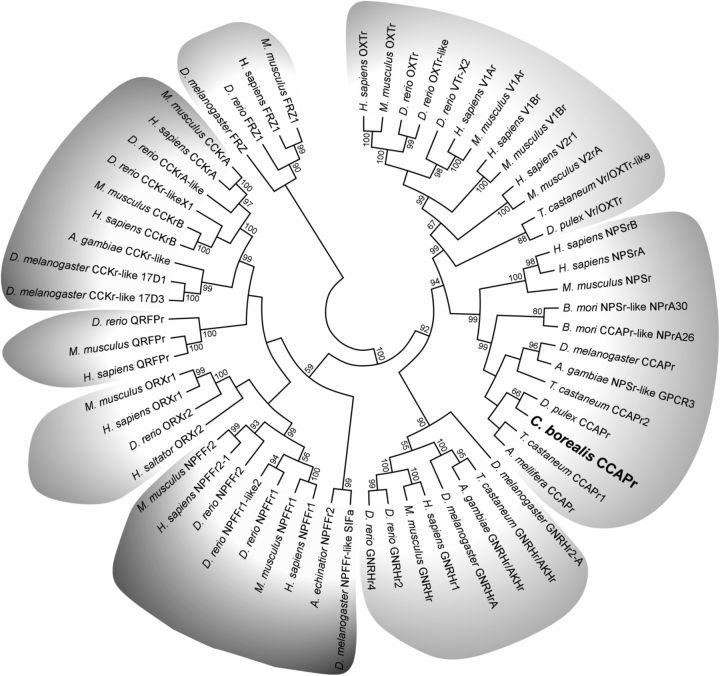
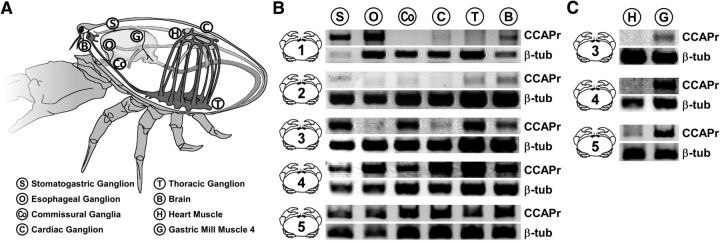
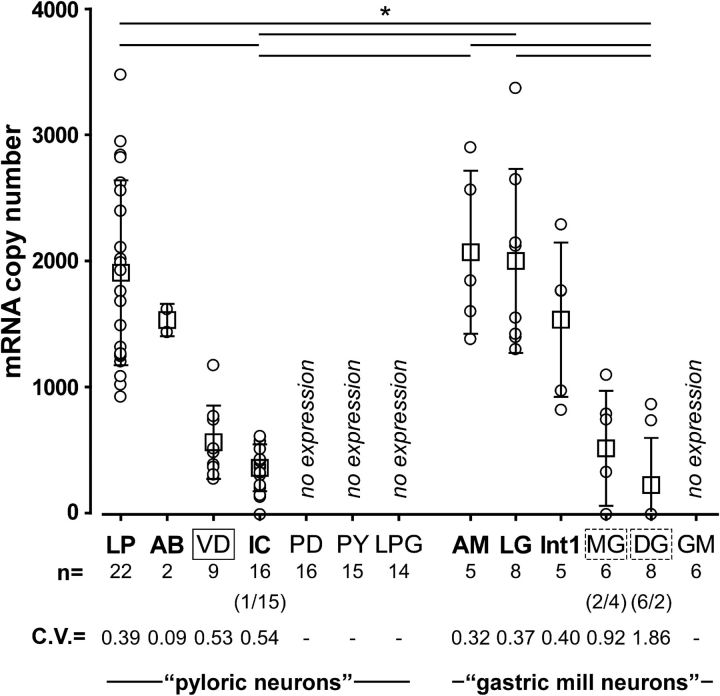
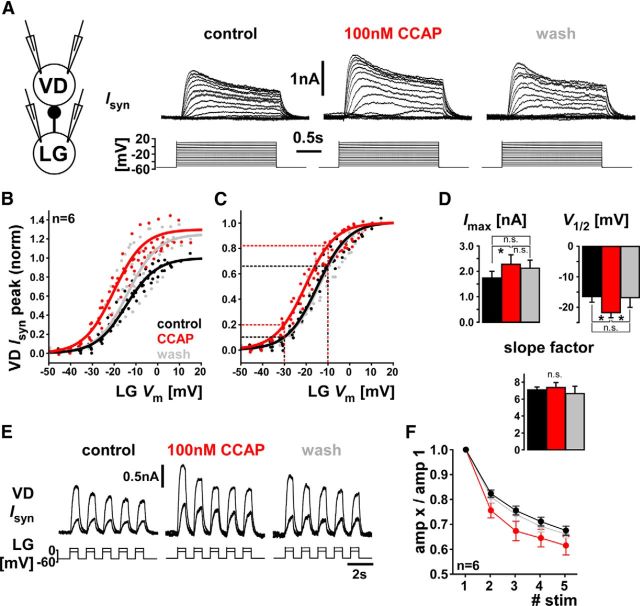
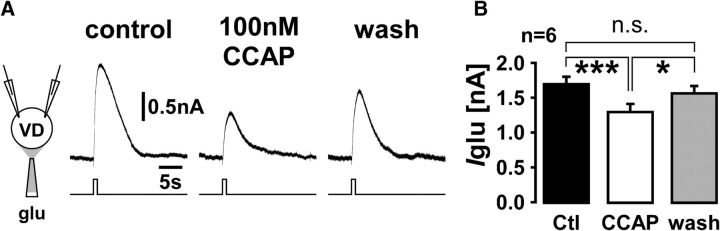
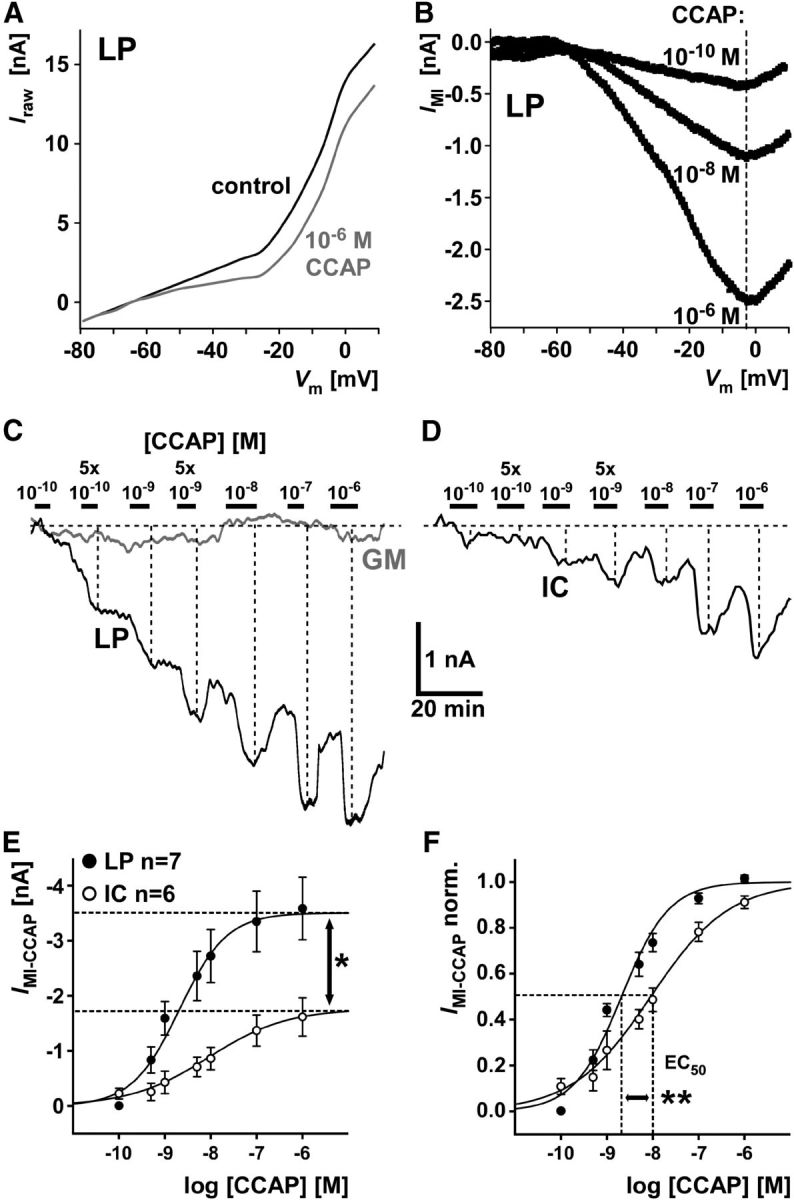
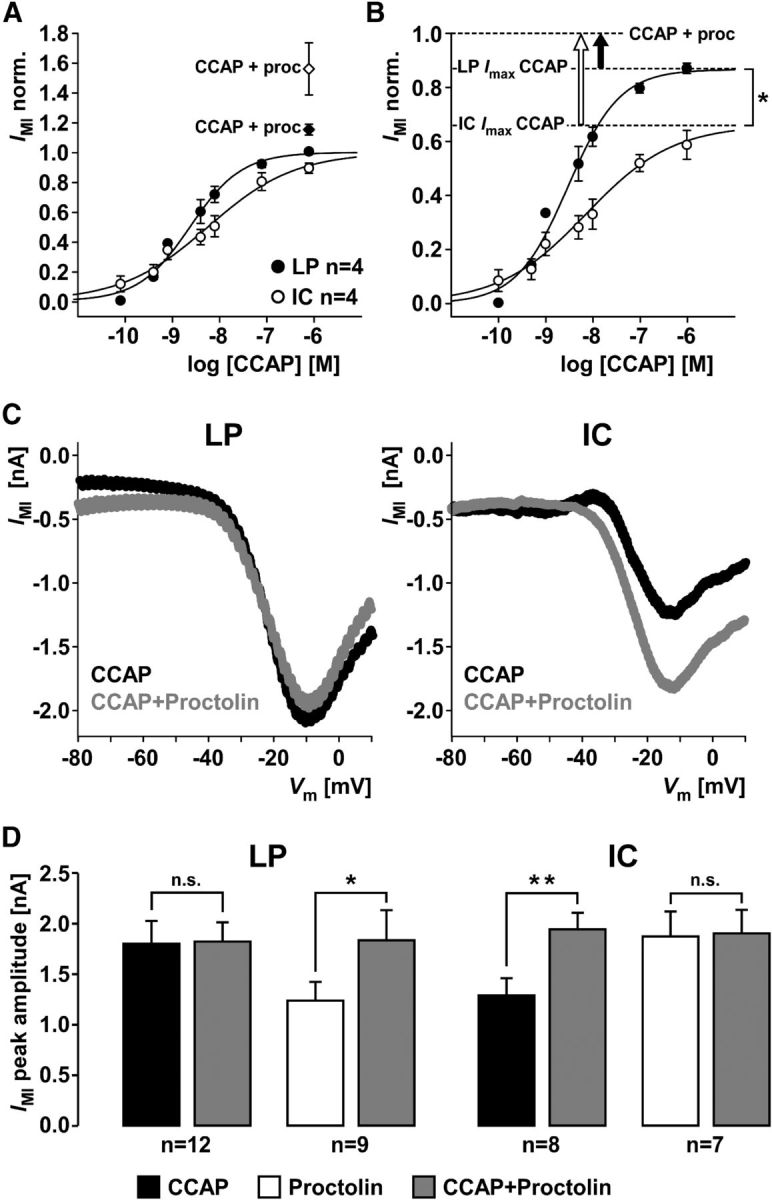
We studied the relationship between neuropeptide receptor transcript expression and current responses in the stomatogastric ganglion (STG) of the crab, Cancer borealis. We identified a transcript with high sequence similarity to crustacean cardioactive peptide (CCAP) receptors in insects and mammalian neuropeptide S receptors. This transcript was expressed throughout the nervous system, consistent with the role of CCAP in a range of different behaviors. In the STG, single-cell qPCR showed expression in only a subset of neurons. This subset had previously been shown to respond to CCAP with the activation of a modulator-activated inward current (IMI), with one exception. In the one cell type that showed expression but no IMI responses, we found CCAP modulation of synaptic currents. Expression levels within STG neuron types were fairly variable, but significantly different between some neuron types. We tested the magnitude and concentration dependence of IMI responses to CCAP application in two identified neurons, the lateral pyloric (LP) and the inferior cardiac (IC) neurons. LP had several-fold higher expression and showed larger current responses. It also was more sensitive to low CCAP concentrations and showed saturation at lower concentrations, as sigmoid fits showed smaller EC50 values and steeper slopes. In addition, occlusion experiments with proctolin, a different neuropeptide converging onto IMI, showed that saturating concentrations of CCAP activated all available IMI in LP, but only approximately two-thirds in IC, the neuron with lower receptor transcript expression. The implications of these findings for comodulation are discussed.

Keywords: crustacean cardioactive peptide; neuromodulation; proctolin; stomatogastric.


Figures

Figure 1.
Figure 1.
Multiple alignment of the CbCCAPr sequence with other arthropod CCAP receptor sequences and sequences for human vasopressin, oxytocin, and neuropeptide S receptors. Black represents identical amino acid residues. Gray represents similar residues. Transmembrane regions of CbCCAPr, human and T. castaneum receptors are underlined in red and labeled with brackets.
Figure 2.
Figure 2.
Maximum-likelihood consensus tree of CbCCAPr and representatives of receptor types found in the A6 subfamily of Rhodopsin-like GPCRs. Sequences used for analysis include vasopressin receptors (V1Ar, V1Br, V2r), oxytocin receptors (OXTr), neuropeptide S receptors (NPSrA, NPSrB), gonadotropin releasing hormone receptors (GNRHr), neuropeptide FF receptors (NPFFr), orexin receptors (ORXr), pyroglutamylated RFamide peptide receptors (QRFPr), and cholecystokinin receptors (CCKr). Frizzled receptors (FRZ) were used as the out-group. Percentage bootstrap values of 1000 replicates are shown at the nodes; values <50% are hidden. Clades are shaded according to receptor type.
Figure 3.
Figure 3.
CbCCAPr RNA is present throughout the nervous system and in a gastric mill muscle. A, Schematic of C. borealis anatomy, indicating the tissues harvested. B, C, Negative images of ethidium bromide-stained agarose gels from PCR amplification of CbCCAPr (top bands, 485 bp) and Cbβ-tubulin (bottom bands, 250 bp) from 5 animals.
Figure 4.
Figure 4.
Single-cell qRT-PCR shows that CbCCAPr is expressed in a subset of STG neurons and at varying levels between cell types. For each cell type, mRNA copy numbers are plotted both for individual measurements (circles) and for means (squares). Cell types included all pyloric and gastric mill neurons (LP; AB; VD; IC; PY, pyloric constrictor neuron; LPG, lateral posterior gastric neuron; AM; Int1, interneuron 1; DG; GM). Cell types previously found to display physiological responses to CCAP are shown in bold. Solid line box around VD represents a mismatch between expression and physiological responsiveness. Dashed boxes around MG and DG represent ambiguity in expression and responsiveness. The number of individual cells measured for each cell type is given in the line beneath the cell type names. For IC, MG, and DG, the numbers in parentheses indicate the number of cells showing no expression/number of cells showing expression. The coefficients of variance are given to indicate variability of expression levels. Mean expression levels were cell type-dependent (one-way ANOVA on ranks, p < 0.001). Pairwise comparisons (Dunn's method) revealed differences as indicated by solid lines on top of the plot (p < 0.05 for each pair). *p < 0.05.
Figure 5.
Figure 5.
CCAP modulates strength and dynamics of the LG to VD graded chemical synapse. A, Dual two-electrode voltage-clamp measurements of synaptic currents in VD (holding potential: −50 mV) in response to voltage steps in LG. Traces were averaged from 3 to 5 repeats of the same stimulation protocol. B, Cross-synaptic IV data for all three treatments from six experiments, normalized to Imax obtained from sigmoid fits to the control values in each experiment. Overlaid sigmoid curves were obtained by averaging sigmoidal fit parameters across experiments. C, The same cross-synaptic IV data as shown in B, but normalized to Imax obtained from sigmoid fits to values from each separate treatment. Dashed lines indicate the increase of synaptic currents at two different voltages that is solely due to the shift in V1/2. D, Statistical comparison of the sigmoidal fit parameters. One-way repeated-measures ANOVA showed significant differences across treatments for Imax (p < 0.05) and V1/2 (p < 0.05), but not the slope factor (p = 0.69). Asterisks indicate results from Holm–Sidak paired comparisons. E, VD neuron current responses to five 0.5 s steps at 1 Hz and at two different depolarization levels in the LG neuron. The synaptic current shows depression at both levels. Traces were averaged from 4 or 5 repeats of the same stimulation protocol. F, Plot of the mean response amplitudes, normalized to the first of the five responses. Two-way repeated-measures ANOVA showed a significant difference between treatments (p < 0.01), but no interaction between treatment and stimulus number (p = 0.37), meaning that the increase in depression was fairly uniform for stimuli 2 to 5. Holm–Sidak paired comparisons showed a significant difference between control and CCAP (p < 0.01) and CCAP and wash (p < 0.01), but not control and wash (p = 0.77). n.s., Not significant.
Figure 6.
Figure 6.
CCAP reduces the current response to glutamate application in the VD neuron. A, VD current responses to 500 ms puff of 10 mm glutamate onto the STG neuropil in control saline (including 100 nm TTX), 100 nm CCAP, and after wash. Traces are averages from 4 to 8 repeats. B, Mean ± SEM responses from six experiments. Responses were significantly different between control saline (including 100 nm TTX) and CCAP, and CCAP and wash, but not between control and wash (one-way ANOVA for repeated measures, p < 0.01; Holm–Sidak paired comparisons). *p < 0.05. ***p < 0.001. n.s., Not significant.
Figure 7.
Figure 7.
CCAP-elicited IMI in LP and IC differs in amplitude and concentration dependence. A, Raw currents as a function of voltage, measured from voltage ramps in control saline and CCAP in an LP neuron. B, IMI as a function of voltage, obtained as the difference between raw current–voltage relationships at three different CCAP concentrations. Dashed line indicates that the voltage at which the current peaked did not change with CCAP concentration. C, Filtered current traces from an LP and a GM neuron held at −20 mV, in response to application of CCAP at different concentrations. Dashed lines indicate that inward current responses increased with increasing CCAP concentration. D, Filtered current traces from an IC neuron, obtained in the same way as the traces shown in C. E, Mean current values at different CCAP concentration from measurements in LP and IC. Sigmoid fits were generated from parameters averaged across individual experiments. Maximum current values obtained from fits were significantly larger in LP than in IC (mean ± SEM: LP: 3.51 ± 0.55 nA; IC: 1.77 ± 0.37 nA; unpaired t test: *p < 0.05). F, Same data as in E, but normalized to the maximal current fit value in each experiment. Values for EC50 and the slope factor were significantly smaller in LP than in IC (mean ± SEM: EC50, LP: 2.07 ± 0.68 nm; IC: 9.02 ± 0.50 nm; unpaired t test: p < 0.01; slope factor, LP: 0.52 ± 0.04; IC: 0.86 ± 0.10; unpaired t test: p < 0.01). **p < 0.01.
Figure 8.
Figure 8.
Differences in occlusion of IMI activation by CCAP and proctolin between LP and IC. A, Mean current values at different CCAP concentrations from measurements at −20 mV in LP and IC, normalized to the maximal current fit value in each experiment. After the concentration series of CCAP, a mix of 1 μm CCAP and 1 μm proctolin was added. Addition of proctolin yielded larger currents (diamonds) than saturating CCAP concentrations alone (circles). B, Same data from the CCAP concentration series as in A, but normalized to the responses to the mix of CCAP and proctolin. Addition of proctolin yielded a significantly larger increase in current in IC than in LP (unpaired t test, p < 0.05). C, Example IV curves generated from the difference of responses to voltage ramps in control saline, 1 μm CCAP, and 1 μm CCAP + 1 μm proctolin. Peak current amplitude did not change in LP but increased in IC. D, Mean peak current amplitudes across experiments, measured from IV curves as shown in C. Current amplitudes in LP did not change between CCAP alone and CCAP + proctolin (paired t test, p = 0.89). In contrast, current amplitudes in IC significantly increased between CCAP alone and CCAP + proctolin (paired t test, p < 0.01). When proctolin was applied alone first, adding CCAP significantly increased current amplitudes in LP (paired t test, p < 0.05), but not IC (paired t test, p = 0.81). *p < 0.05. **p < 0.01. n.s., Not significant.

Similar articles

Cited by

References

    1. Arakane Y, Li B, Muthukrishnan S, Beeman RW, Kramer KJ, Park Y. Functional analysis of four neuropeptides, EH, ETH, CCAP and bursicon, and their receptors in adult ecdysis behavior of the red flour beetle, Tribolium castaneum. Mech Dev. 2008;125:984–995. doi: 10.1016/j.mod.2008.09.002. - DOI - PubMed
    1. Baker JG, Hill SJ. Multiple GPCR conformations and signalling pathways: implications for antagonist affinity estimates. Trends Pharmacol Sci. 2007;28:374–381. doi: 10.1016/j.tips.2007.06.011. - DOI - PMC - PubMed
    1. Bargmann CI. Beyond the connectome: how neuromodulators shape neural circuits. Bioessays. 2012;34:458–465. doi: 10.1002/bies.201100185. - DOI - PubMed
    1. Bargmann CI, Marder E. From the connectome to brain function. Nat Methods. 2013;10:483–490. doi: 10.1038/nmeth.2451. - DOI - PubMed
    1. Belmont M, Cazzamali G, Williamson M, Hauser F, Grimmelikhuijzen CJ. Identification of four evolutionarily related G protein-coupled receptors from the malaria mosquito Anopheles gambiae. Biochem Biophys Res Commun. 2006;344:160–165. doi: 10.1016/j.bbrc.2006.03.117. - DOI - PubMed

Publication types

MeSH terms

LinkOut - more resources