. 2015 Apr 29;35(17):6822-35.
doi: 10.1523/JNEUROSCI.3709-14.2015.

The white matter structural network underlying human tool use and tool understanding

Affiliations

The white matter structural network underlying human tool use and tool understanding

Yanchao Bi et al. J Neurosci. .

Abstract

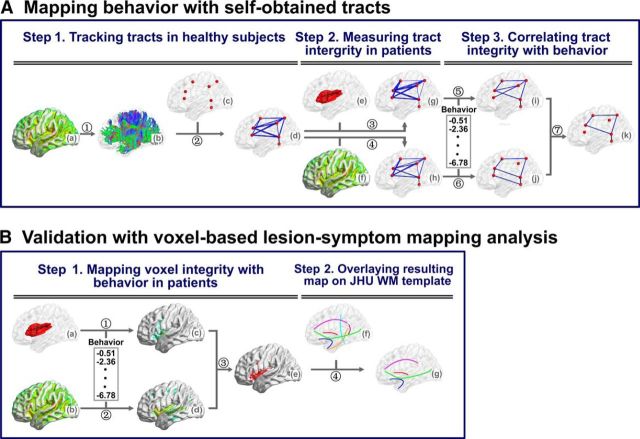
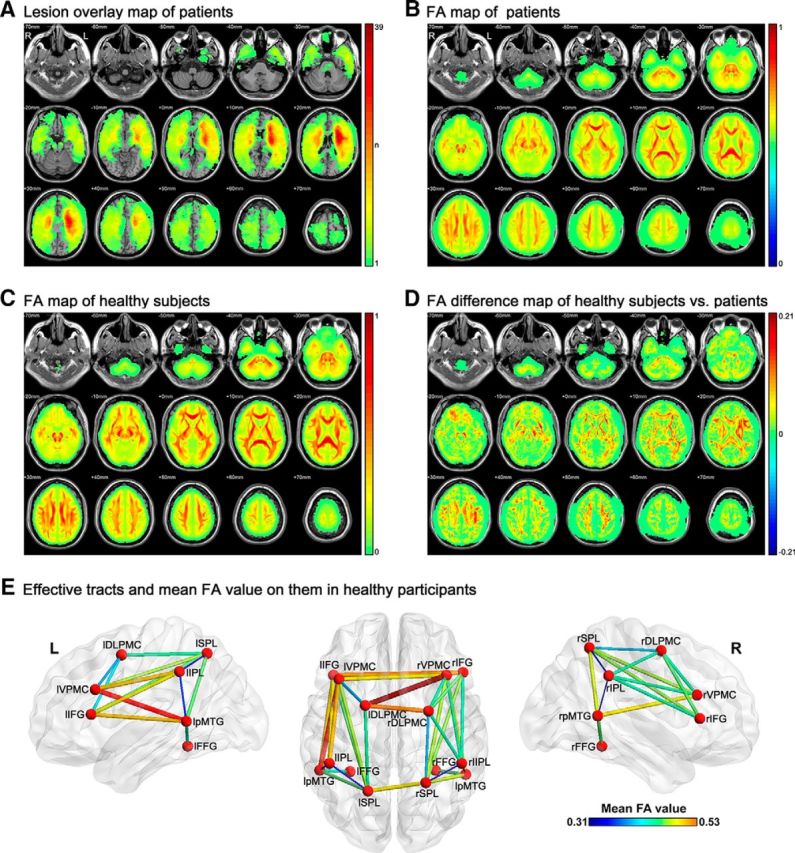
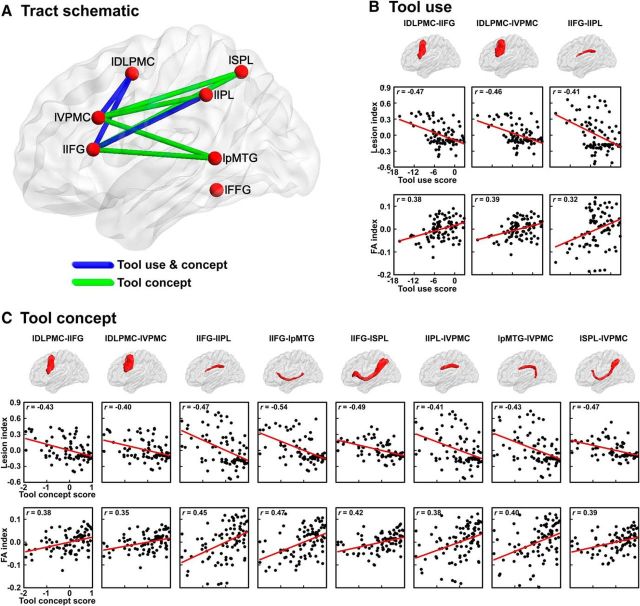
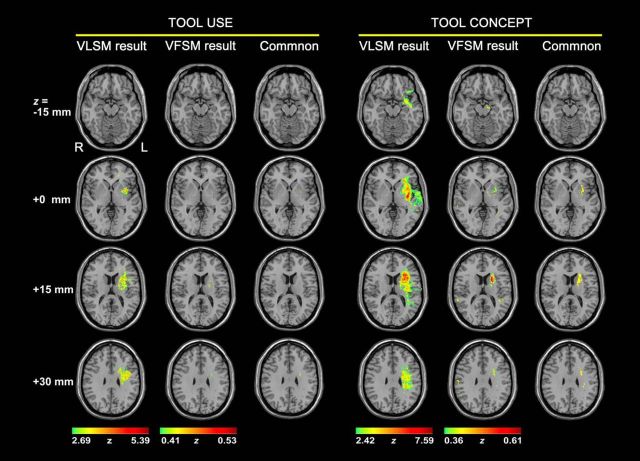
The ability to recognize, create, and use complex tools is a milestone in human evolution. Widely distributed brain regions in parietal, frontal, and temporal cortices have been implicated in using and understanding tools, but the roles of their anatomical connections in supporting tool use and tool conceptual behaviors are unclear. Using deterministic fiber tracking in healthy participants, we first examined how 14 cortical regions that are consistently activated by tool processing are connected by white matter (WM) tracts. The relationship between the integrity of each of the 33 obtained tracts and tool processing deficits across 86 brain-damaged patients was investigated. WM tract integrity was measured with both lesion percentage (structural imaging) and mean fractional anisotropy (FA) values (diffusion imaging). Behavioral abilities were assessed by a tool use task, a range of conceptual tasks, and control tasks. We found that three left hemisphere tracts connecting frontoparietal and intrafrontal areas overlapping with left superior longitudinal fasciculus are crucial for tool use such that larger lesion and lower mean FA values on these tracts were associated with more severe tool use deficits. These tracts and five additional left hemisphere tracts connecting frontal and temporal/parietal regions, mainly overlapping with left superior longitudinal fasciculus, inferior frontooccipital fasciculus, uncinate fasciculus, and anterior thalamic radiation, are crucial for tool concept processing. Largely consistent results were also obtained using voxel-based symptom mapping analyses. Our results revealed the WM structural networks that support the use and conceptual understanding of tools, providing evidence for the anatomical skeleton of the tool knowledge network.

Keywords: brain-damaged patient; diffusion tensor imaging; structural network; tool concept; tool use; voxel-based lesion-symptom mapping.


Figures

Figure 1.
Figure 1.
Flowchart for the analyses of behavioral and imaging data. A, Mapping behavior with self-obtained tracts: (1) Reconstruction of white fibers in the whole brain (b) by using DTI deterministic tractography on the FA (fractional anisotropy) map (a) for healthy participants. (2) Filtering out the WM fibers connecting every pair of seed spheres (c) and identifying the tract mask of each pair seeds (d) consisted of all the voxels reaching the threshold with AlphaSim correction (corrected cluster level: p < 0.05; voxel level: sign test p < 0.05). (3–4) Inputting the tract mask into the lesion map (e) or the FA map (f) of each patient to calculate the percentage of voxels with lesion (g, number of voxels with lesion divided by total number of voxels on the tract) or mean FA value (h, averaging the FA values of all voxels in the tract), respectively. (5–6) Obtaining the tool-relevant tracts in separate analyses, through correlating the standardized “t” behavioral scores with lesion percentages (i) or the mean FA values (j) across the 86 patients, partialling out the total lesion volume. (7) Obtaining the tracts important for tool processing, namely, those with significant effects in both the lesion analysis and the mean FA analysis. B, Validation with voxel-based lesion-symptom mapping analyses: (1) Calculating VLSM analysis map (c) by comparing the standardized “t” behavioral scores between damaged and intact patients on each voxel of the lesion map (a), with total lesion volume as a covariate. (2) Calculating VFSM analysis map (d) by correlating the standardized “t” behavioral scores with FA values of each voxel of the FA map (b) across the 86 patients, with total lesion volume as a covariate. (3) Obtaining the tool-related voxels (e), which had significant effects in both the VLSM and VFSM analyses. (4) Extracting the tool-related tracts (g), through overlaying the tool-related voxels onto JHU WM tractography atlas (Hua et al., 2008), which includes 20 major WM tracts of the human brain. The figures were displayed using the BrainNet Viewer (Xia et al., 2013) software package.
Figure 2.
Figure 2.
Raw imaging schematic of participants and the tracts successfully tracked between the tool-relevant seeds. A, Lesion map of patients on each voxel. The value of each voxel is the number of patients with lesions on it. B, Mean FA maps of patients. C, Mean FA maps of healthy subjects. D, Mean FA difference map of healthy subjects minus patients. For BD, the color bar indicates the mean FA value per voxel. E, Fourteen seeds and 33 tracts successfully tracked between these seeds in 49 healthy adults. The thickness and color of the tracts indicate the mean FA values. Full names of the seeds are listed in Table 1.
Figure 3.
Figure 3.
Results of mapping tool-processing behavior with self-obtained WM tracts. A, Schematic of the self-obtained WM tracts associated with tool use and/or tool conceptual processing. The correlations of WM tract integrity with tool use or tool conceptual performance are shown in B and C, respectively. Row 1 shows the shape of the tracts. Rows 2 and 3 show the correlograms of lesion analysis and FA analysis, respectively. The y-axis in the correlograms indicates the residual of the lesion volume (Lesion index) or mean FA value (FA index) with patients' total lesion volume regressed out. Full names of the seeds are listed in Table 1.
Figure 4.
Figure 4.
Results of the lesion-symptom mapping analysis for tool processing. For tool use or tool concept processing, Column 1 displays the VLSM (Bates et al., 2003) results, in which tool performance was compared between the damaged and intact groups on each voxel, with total lesion volume regressed out. Column 2 displays the VFSM results, in which tool performance was correlated with FA values on each voxel, with total lesion volume as a covariate. Column 3 shows the voxels with significant effects in both VLSM and VFSM analyses.

Comment in

References

    1. Bates E, Wilson SM, Saygin AP, Dick F, Sereno MI, Knight RT, Dronkers NF. Voxel-based lesion-symptom mapping. Nat Neurosci. 2003;6:448–450. - PubMed
    1. Beauchamp MS, Lee KE, Haxby JV, Martin A. Parallel visual motion processing streams for manipulable objects and human movements. Neuron. 2002;34:149–159. doi: 10.1016/S0896-6273(02)00642-6. - DOI - PubMed
    1. Bellec P, Lavoie-Courchesne S, Dickinson P, Lerch JP, Zijdenbos AP, Evans AC. The pipeline system for Octave and Matlab (PSOM): a lightweight scripting framework and execution engine for scientific workflows. Front Neuroinform. 2012;6:7. doi: 10.3389/fninf.2012.00007. - DOI - PMC - PubMed
    1. Boronat CB, Buxbaum LJ, Coslett HB, Tang K, Saffran EM, Kimberg DY, Detre JA. Distinctions between manipulation and function knowledge of objects: evidence from functional magnetic resonance imaging. Brain Res Cogn Brain Res. 2005;23:361–373. doi: 10.1016/j.cogbrainres.2004.11.001. - DOI - PubMed
    1. Brunner E, Munzel U. The nonparametric Behrens-Fisher problem: asymptotic theory and small-sample approximation. Biom J. 2000;42:17–25. doi: 10.1002/(SICI)1521-4036(200001)42:1<17::AID-BIMJ17>3.0.CO;2-U. - DOI

Publication types

MeSH terms

LinkOut - more resources