. 2015 Apr 29;35(17):6903-17.
doi: 10.1523/JNEUROSCI.4598-14.2015.

Enhanced Firing in NTS Induced by Short-Term Sustained Hypoxia Is Modulated by Glia-Neuron Interaction

Affiliations

Enhanced Firing in NTS Induced by Short-Term Sustained Hypoxia Is Modulated by Glia-Neuron Interaction

Daniela Accorsi-Mendonça et al. J Neurosci. .

Abstract

Humans ascending to high altitudes are submitted to sustained hypoxia (SH), activating peripheral chemoreflex with several autonomic and respiratory responses. Here we analyzed the effect of short-term SH (24 h, FIO210%) on the processing of cardiovascular and respiratory reflexes using an in situ preparation of rats. SH increased both the sympatho-inhibitory and bradycardiac components of baroreflex and the sympathetic and respiratory responses of peripheral chemoreflex. Electrophysiological properties and synaptic transmission in the nucleus tractus solitarius (NTS) neurons, the first synaptic station of afferents of baroreflexes and chemoreflexes, were evaluated using brainstem slices and whole-cell patch-clamp. The second-order NTS neurons were identified by previous application of fluorescent tracer onto carotid body for chemoreceptor afferents or onto aortic depressor nerve for baroreceptor afferents. SH increased the intrinsic excitability of NTS neurons. Delayed excitation, caused by A-type potassium current (IKA), was observed in most of NTS neurons from control rats. The IKA amplitude was higher in identified second-order NTS neurons from control than in SH rats. SH also blunted the astrocytic inhibition of IKA in NTS neurons and increased the synaptic transmission in response to afferent fibers stimulation. The frequency of spontaneous excitatory currents was also increased in neurons from SH rats, indicating that SH increased the neurotransmission by presynaptic mechanisms. Therefore, short-term SH changed the glia-neuron interaction, increasing the excitability and excitatory transmission of NTS neurons, which may contribute to the observed increase in the reflex sensitivity of baroreflex and chemoreflex in in situ preparation.

Keywords: NTS; astrocytes; firing; intrinsic properties; sustained hypoxia; synaptic transmission.


Figures

Figure 1.
Figure 1.
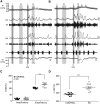
Peripheral chemoreflex responses in control and SH rats. Raw and integrated (∫) recordings of AbN, tSN, and PN activities, and HR of a control (A) and a SH rat (B), representatives of their respective groups, illustrating the respiratory, sympathetic, and bradycardic responses elicited by the activation of peripheral chemoreceptors with intra-arterial injection of KCN (0.05%, 50 μl). The percentage of average magnitude of the tSN (C) and AbN (D) reflex responses to peripheral chemoreflex activation in control and SH rats. I, Inspiration; E, expiration; PP, perfusion pressure. **p < 0.001, ANOVA one-way; ***p < 0.0001, unpaired t test.
Figure 2.
Figure 2.
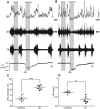
Sympatho-inhibitory component of baroreflex in control and SH rats. Raw and integrated (∫) recordings of tSN and PN activities and HR of a control (A) and a SH rat (B), representatives of their respective groups, illustrating the sympatho-inhibitory, bradycardic, and expiratory responses elicited by the activation of baroreflex before (basal) and during ADN stimulation (response). The percentage of average magnitude of the tSN inhibition (C) and HR (D) reflex responses to baroreflex activation in control and SH rats; **p < 0.001, ***p < 0.0001, unpaired t test.
Figure 3.
Figure 3.
Nonlabeled NTS neurons of SH animals present increased firing frequency in response to injected current. A, Photomicrography showing brainstem slice at the NTS level viewed under IR-DIC. AP, Area postrema; TS, tractus solitarius; NTS, nucleus tractus solitarius. B, Photomicrography showing one NTS neuron and the patch pipette (PP) on the surface of slice viewed on IR-DIC optic. Ci, Representative trace showing the number of action potential after inject current (50 pA during 2 s) into NTS neuron from control rat; note the delay excitation (black arrow). Cii, Representative tracing showing the number of action potential after inject current (50 pA during 2 s) into NTS neuron from SH animals. D, Correlation between the injected current and the number of action potential in NTS neurons from control (n = 14) and SH animals (n = 19); **p < 0.01, ANOVA two-way.
Figure 4.
Figure 4.
IKA is decreased in nonlabeled NTS neurons from SH rats. Ai, Voltage-step protocols to activate outward currents in NTS neurons. The neurons were held at −90 mV for 500 ms followed by potentials step commands (−100 to 10 mV in 10 mV increments during 1 s). Aii, Representative traces showing the voltage-dependent activation of IKA in NTS neuron from control animal. Aiii, Representative traces showing the voltage-dependent activation of IKA in NTS neuron from SH animal. B, The relationship between the IKA peak and voltage in NTS neurons from control (n = 9) and SH animals (n = 7); **p < 0.01 ANOVA two-way. C, Correlation between the normalized conductance and voltage in NTS neurons from control (n = 9) and SH animals (n = 7). D, Correlation between the 4-AP-sensitive current and the voltage in NTS neurons from control (n = 6) and SH animals (n = 9). Ei, Voltage-step protocols to inactivate TOC in NTS neurons. Prepulses varied in 10 mV increments from −100 to −30 mV during 500 ms, followed by a prolonged step (−10 mV during 1200 ms). Eii, Representative traces showing the voltage-dependent inactivation of IKA in NTS neuron from control animal. Eiii, Representative traces showing the voltage-dependent inactivation of TOC in NTS neuron from SH animal. F, Correlation between the IKA peak and the voltage of prepulse in NTS neurons from control (n = 9) and SH animals (n = 6). G, Correlation between the normalized conductance and the voltage of prepulse in NTS neurons from control (n = 9) and SH animals (n = 7). H, Correlation between the 4-AP-sensitive current and the voltage of prepulse in NTS neurons from control (n = 5) and SH animals (n = 6); *p < 0.05, **p < 0.01; ***p < 0.001, ANOVA two-way.
Figure 5.
Figure 5.
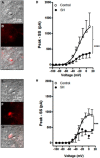
IKA is decreased in second-order NTS neurons from SH rats. A, Photomicrography of NTS neuron that receive synaptic contacts from ADN showing the fluorescent afferent boutons viewed under IR-DIC optic. B, The same neuron under epifluorescence illumination. C, Overlay of fluorescent and IR-DIC image. Fluorescent ADN terminals (red color) identify baroreceptor second-order NTS neuron in slices. D, Correlation between the TOC peak and voltage in ADN-NTS neurons from control (n = 7) and SH animals (n = 7). E, Photomicrography of the NTS neuron that receives synaptic contacts from CB showing the fluorescent afferent boutons viewed with IR-DIC optic. F, The same neuron under epifluorescence illumination. G, Overlay of fluorescent and IR-DIC image. Fluorescent CB terminals (red color) identify chemoreceptor second-order NTS neuron in a slice. H, Correlation between the TOC peak and voltage in CB-NTS neurons from control (n = 4) and SH animals (n = 6); ***p < 0.001, ****p < 0.0001, ANOVA two-way.
Figure 6.
Figure 6.
Glial inhibition and IKA in nonlabeled NTS neurons. A, Correlation between the TOC amplitude and voltage in NTS neurons from control rats during perfusion with aCSF (n = 7) or aCSF + FAC (n = 7). B, Correlation between the IKA amplitude and voltage in NTS neurons from SH rats during perfusion with aCSF (n = 4) or aCSF + FAC (n = 6); ****p < 0.0001, ANOVA two-way.
Figure 7.
Figure 7.
Evoked synaptic activity is increased in nonlabeled NTS neurons from SH rats. Ai, Representative trace of action potentials after 5 TS stimuli (black circle) in NTS neuron from control animal. Aii, Representative trace of action potential after five TS stimuli (black circle) in NTS neuron from SH animal. B, Correlation between number of action potential and TS stimuli. C, Representatives traces of eEPSCs after TS stimulus (black circles) in NTS neuron from control and SH rat. D, Average data of peak amplitude of TS-eEPSCs in NTS neurons from control and SH rat. E, Average data of half-width of TS-eEPSCs in NTS neurons from control and SH animal. F, Average data of rise time of TS-eEPSCs in NTS neurons from control and SH animal. G, Average data of decay time of TS-eEPSCs in NTS neurons from control and SH animal; *p < 0.05, unpaired t test; ****p < 0.0001, ANOVA two-way.
Figure 8.
Figure 8.
Spontaneous currents are increased in nonlabeled NTS neurons from SH rats. A, Representative traces of spontaneous currents in NTS neuron from control and SH rat. B, Average of frequency (Bi), amplitude (Bii), and half-width (Biii) of spontaneous currents in NTS neuron from control and SH rats. C, Representative traces of spontaneous excitatory currents in NTS neuron from control and SH rat. D, Average of frequency (Di), amplitude (Dii), and half-width (Diii) of spontaneous excitatory currents in NTS neuron from control and SH animals. E, Representative traces of miniature spontaneous excitatory currents in NTS neuron from control and SH rats. F, Average of frequency (Fi), amplitude (Fii), and half-width (Fiii) of miniature spontaneous excitatory currents in NTS neuron from control and SH rats; *p < 0.05, unpaired t test.

References

    1. Abdala AP, McBryde FD, Marina N, Hendy EB, Engelman ZJ, Fudim M, Sobotka PA, Gourine AV, Paton JF. Hypertension is critically dependent on the carotid body input in the spontaneously hypertensive rat. J Physiol. 2012;590:4269–4277. doi: 10.1113/jphysiol.2012.237800. - DOI - PMC - PubMed
    1. Accorsi-Mendonça D, Bonagamba LG, Leão RM, Machado BH. Are L-glutamate and ATP cotransmitters of the peripheral chemoreflex in the rat nucleus tractus solitarius? Exp Physiol. 2009;94:38–45. doi: 10.1113/expphysiol.2008.043653. - DOI - PubMed
    1. Accorsi-Mendonça D, Castania JA, Bonagamba LG, Machado BH, Leão RM. Synaptic profile of nucleus tractus solitarius neurons involved with the peripheral chemoreflex pathways. Neuroscience. 2011;197:107–120. doi: 10.1016/j.neuroscience.2011.08.054. - DOI - PubMed
    1. Accorsi-Mendonça D, Machado BH. Synaptic transmission of baro- and chemoreceptors afferents in the NTS second order neurons. Auton Neurosci. 2013;175:3–8. doi: 10.1016/j.autneu.2012.12.002. - DOI - PubMed
    1. Accorsi-Mendonça D, Leão RM, Aguiar JF, Varanda WA, Machado BH. Urethane inhibits the GABAergic neurotransmission in the nucleus of the solitary tract of rat brain stem slices. Am J Physiol Regul Integr Comp Physiol. 2007;292:R396–R402. doi: 10.1152/ajpregu.00776.2005. - DOI - PubMed

Publication types

MeSH terms

LinkOut - more resources