. 2015 Jun 1;194(11):5520-8.
doi: 10.4049/jimmunol.1500312. Epub 2015 Apr 29.

Mature cystic fibrosis airway neutrophils suppress T cell function: evidence for a role of arginase 1 but not programmed death-ligand 1

Affiliations

Mature cystic fibrosis airway neutrophils suppress T cell function: evidence for a role of arginase 1 but not programmed death-ligand 1

Sarah A Ingersoll et al. J Immunol. .

Abstract

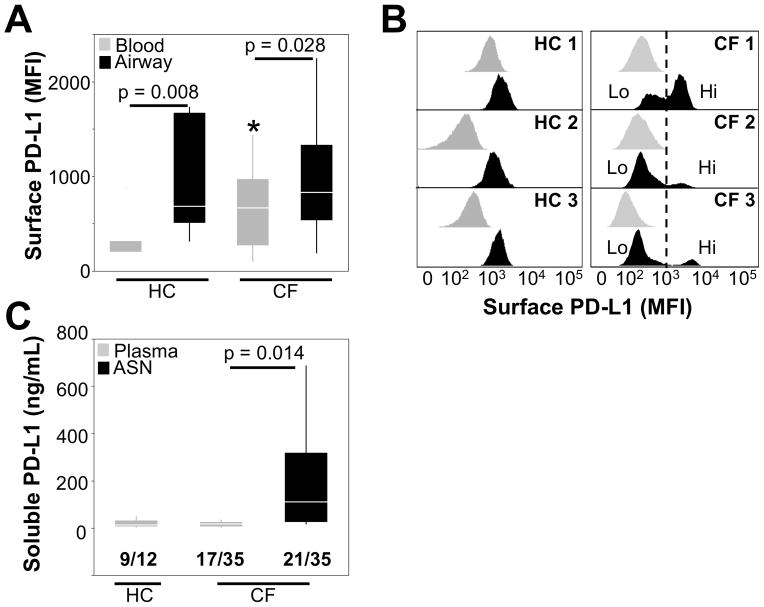
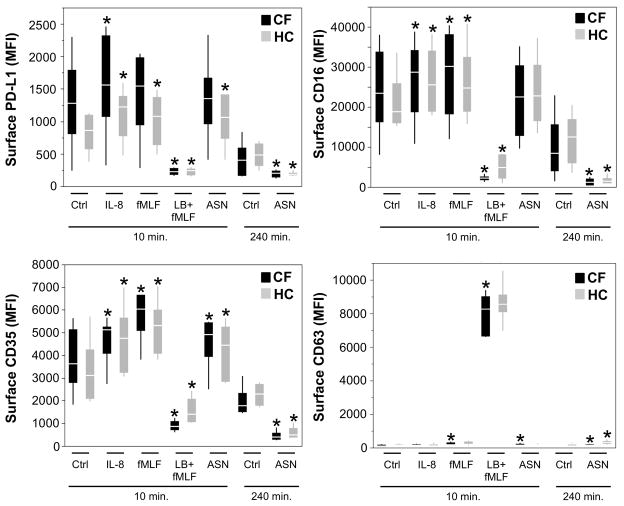
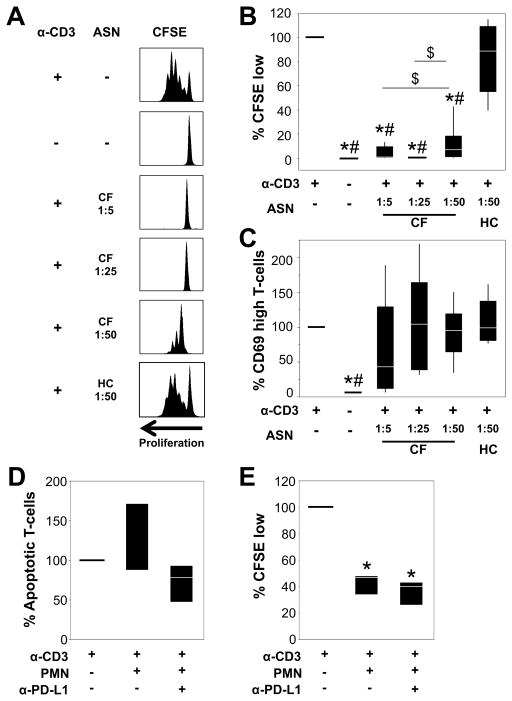
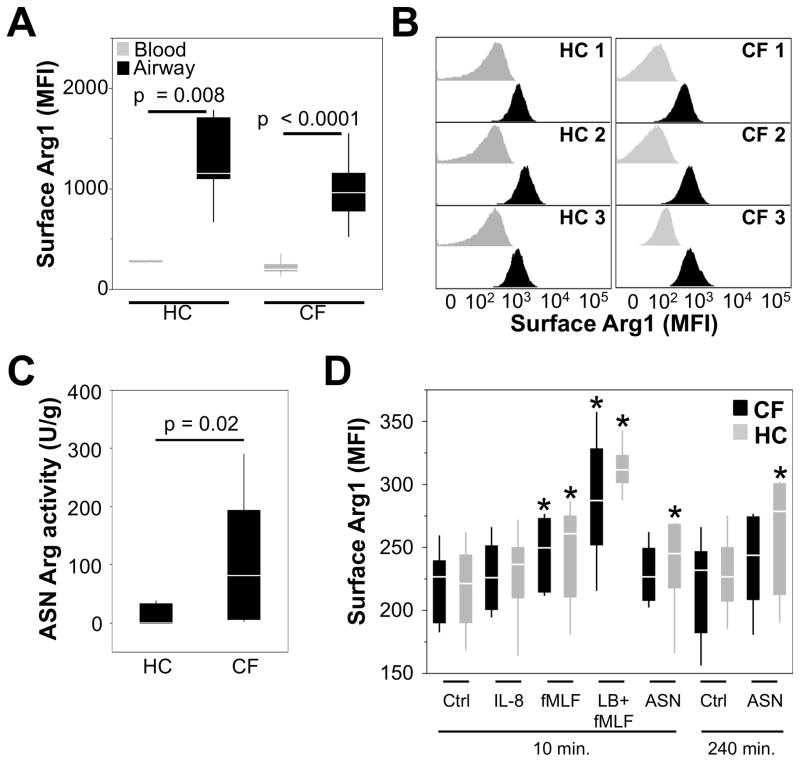
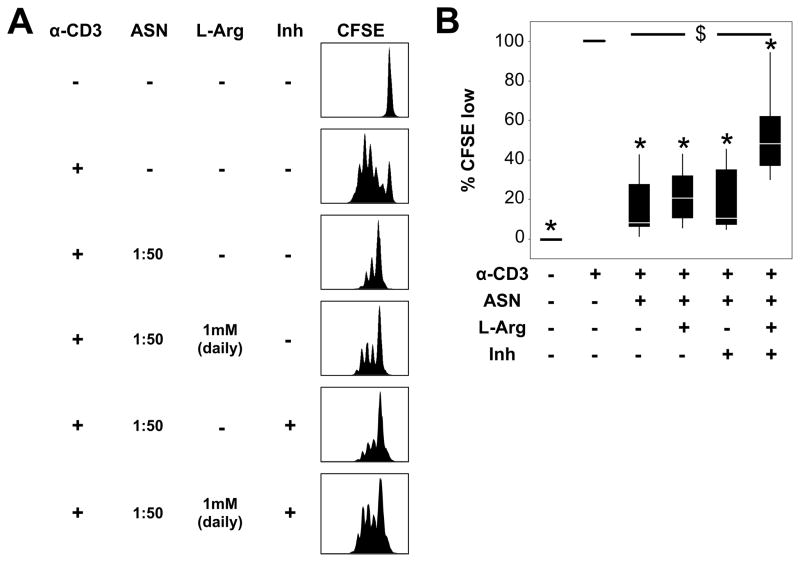
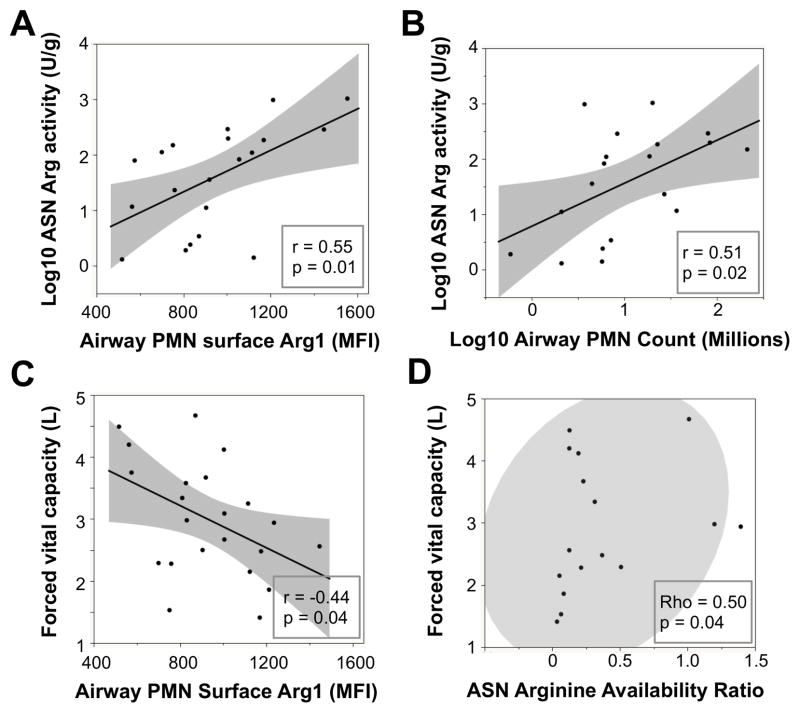
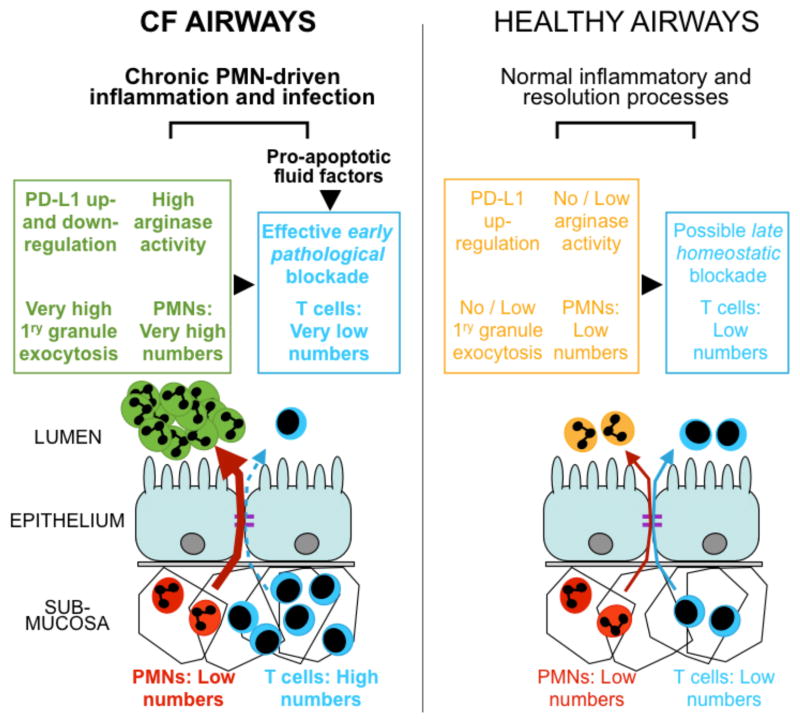
Bacteria colonize cystic fibrosis (CF) airways, and although T cells with appropriate Ag specificity are present in draining lymph nodes, they are conspicuously absent from the lumen. To account for this absence, we hypothesized that polymorphonuclear neutrophils (PMNs), recruited massively into the CF airway lumen and actively exocytosing primary granules, also suppress T cell function therein. Programmed death-ligand 1 (PD-L1), which exerts T cell suppression at a late step, was expressed bimodally on CF airway PMNs, delineating PD-L1(hi) and PD-L1(lo) subsets, whereas healthy control (HC) airway PMNs were uniformly PD-L1(hi). Blood PMNs incubated in CF airway fluid lost PD-L1 over time; in coculture, Ab blockade of PD-L1 failed to inhibit the suppression of T cell proliferation by CF airway PMNs. In contrast with PD-L1, arginase 1 (Arg1), which exerts T cell suppression at an early step, was uniformly high on CF and HC airway PMNs. However, arginase activity was high in CF airway fluid and minimal in HC airway fluid, consistent with the fact that Arg1 activation requires primary granule exocytosis, which occurs in CF, but not HC, airway PMNs. In addition, Arg1 expression on CF airway PMNs correlated negatively with lung function and positively with arginase activity in CF airway fluid. Finally, combined treatment with arginase inhibitor and arginine rescued the suppression of T cell proliferation by CF airway fluid. Thus, Arg1 and PD-L1 are dynamically modulated upon PMN migration into human airways, and, Arg1, but not PD-L1, contributes to early PMN-driven T cell suppression in CF, likely hampering resolution of infection and inflammation.


Figures

Figure 1
Figure 1. PD-L1 expression is increased on airway compared to blood PMNs in vivo
(A) PD-L1 surface expression was quantified on live PMNs from whole blood or airway (sputum) from both HC (n=7) and CF (n=24) subjects. The median fluorescence intensities (MFI) of PD-L1 surface expression are presented as box plots. * indicates slight increase in PD-L1 expression on CF compared to HC blood PMNs (p = 0.04). (B) Representative histograms from 3 CF and 3 HC subjects show PD-L1 surface expression on matched blood (grey) and airway (black) PMNs. (C) sPD-L1 levels in plasma (HC and CF) and airway supernatant (ASN, CF only) were quantified by ELISA. The number of samples with detectable levels of sPD-L1 out of the total tested is shown below each group on the graph.
Figure 2
Figure 2. PMN granule exocytosis modulates surface PD-L1 expression on PMNs in vitro
Whole blood from HC or CF subjects was stimulated with the indicated molecules, or CF airway supernatant (ASN), diluted in RPMI. After treatment, cells were collected and stained for analysis by flow cytometry for surface expression of PD-L1, CD16, CD35 and CD63. * represents p values < 0.05 when compared to the appropriate control from the same experimental group (HC or CF) and timepoint (10 or 240 minutes). n=6 for HC and CF groups.
Figure 3
Figure 3. Airway fluid and airway-derived PMNs from CF patients inhibit T-cell proliferation independently of PD-L1
(A) CFSE-labeled PBMCs were cultured on control plates or anti-CD3-coated plates in the presence or absence of CF or HC ASN at the indicated dilutions. PBMCs were pre-exposed to ASN for 2 hours and plated in CD3-coated wells. After 96 hours, PBMCs were analyzed by flow cytometry. Representative histograms of CFSE proliferation are shown. Experimental conditions were compared with regards to percentages of T cells that (B) underwent 2 or more cycles of proliferation (CFSE low), (C) expressed high surface CD69 levels. Values represent the fold change compared to the control CD3-stimulated PBMCs in RPMI (set at 100%). Each box plot represents 4–8 experiments. * represents p < 0.05 when compared to CD3-stimulated cells in RPMI, # represents p < 0.05 when compared to CD3-stimulated cells in HC ASN, and $ represents p < 0.05 between CD3-stimulated cells in different concentrations of CF ASN. (D) PBMCs were cultured on control plates or anti-CD3-coated plates for 48 hours then treated with 2×10⁵ CF airway PMNs, with or without anti-PD-L1). After 24 hours, CFSE-labeled PBMCs were collected and stained with Annexin V and Live/Dead. The percentages of (D) apoptotic T cells, and (E) CFSE-low T cells were determined by flow cytometry. The values represent the fold change compared to the control CD3-stimulated PBMCs in RPMI (set at 100%), where n=3–6 individual experiments. * represents p < 0.05 when compared to CD3-stimulated cells in RPMI.
Figure 4
Figure 4. Arg1 expression is increased on the surface of both CF and HC airway PMNs but arginase activity is significantly higher in CF airway fluid
(A) Arg1 surface expression was quantified on live PMNs from whole blood or airway (sputum) from both HC (n=7) and CF (n=24) subjects. The median fluorescence intensities of Arg1 surface expression are presented as box plots. (B) Representative histograms from 3 CF and 3 HC subjects show Arg1 surface expression on matched blood (grey) and airway (black) PMNs. (C) Arginase activity was measured in CF (n=20) and HC (n=5) ASN, and was calculated as units/mg sputum, where 1 unit was equal to the enzymatic activity necessary to produce 1 μmol urea/min. (D) Whole blood from HC or CF subjects was stimulated with the indicated molecules, or CF airway supernatant (ASN) diluted in RPMI (same as Fig. 2). After treatment, cells were collected and stained for analysis by flow cytometry for surface expression of Arg1. * represents p values < 0.05 when compared to the appropriate control from the same experimental group (HC or CF) and timepoint (10 or 240 minutes). n=6 for HC and CF groups.
Figure 5
Figure 5. Arg1 in CF airway fluid contributes to the inhibition of T-cell proliferation
(A) CFSE-labeled PBMCs were cultured on anti-CD3-coated plates after being pre-treated with CF ASN at 1:50 in RPMI (a concentration that does not induce apoptosis, labeled as “ASN”) for 2 hours. To block arginase activity, 1:50 CF ASN was pre-treated with 250 μM nor-NOHA (labeled as “Inh”) for 10 minutes prior to incubation with CFSE-labeled PBMCs. L-arginine (LArg, 1mM) was supplemented daily by addition to the culture medium. After 96 hours, PBMCs were analyzed by flow cytometry. Representative histograms of CFSE staining are shown. (B) The percentages of T cells that underwent >2 cycles of proliferation (CFSE low) are shown. The values represent the fold change compared to the control CD3-stimulated PBMCs in RPMI (second column, set at 100%). Each box plot represents 6 experiments. * represents p < 0.05 when compared to CD3-stimulated cells in RPMI, and $ represents p < 0.05 between CD3-stimulated cells in CF ASN alone vs. CF ASN with combined nor-NOHA and L-Arg treatments.
Figure 6
Figure 6. Correlations between ASN arginase activity, airway PMN surface Arg1, airway PMN count, arginine bioavailability ratio, and forced vital capacity
Correlations were assessed using the Pearson test among (log-)normally distributed variables (A, B, C) and the Spearman test (D) due to the non-parametric distribution of ASN arginine bioavailability ratio.
Figure 7
Figure 7. Working model accounting for the observed exclusion / early blockade of T-cells in the CF airway lumen
Our data are consistent with the previously observed imbalance in PMNs and T cells between the submucosa and lumen of the airways, suggesting that massive PMN recruitment to the lumen and high exocytosis of primary granules lead to high arginase activity and early, pathological blockade of T-cells, while PD-L1 on airway PMNs is first up- and then down-regulated. Our data suggest that other pro-apoptotic factors present in CF airway fluid may also block T cells, contributing to chronic inflammation and infection driven by pathological airway PMNs (dark green). By contrast, in healthy airways, PMNs are in low numbers and do not exocytose primary granules, such that arginase activity is absent or low, while PD-L1 on PMNs stays upregulated. Normal airway PMNs (light orange) do not impede T-cell responses, but may provide late homeostatic regulation of T cells via PD-L1 / PD-1 signaling, thus contributing to normal inflammatory and resolution processes.

References

    1. Sagel SD, Wagner BD, Anthony MM, Emmett P, Zemanick ET. Sputum biomarkers of inflammation and lung function decline in children with cystic fibrosis. Am J Respir Crit Care Med. 2012;186:857–865. - PMC - PubMed
    1. Ashlock MA, Olson ER. Therapeutics development for cystic fibrosis: a successful model for a multisystem genetic disease. Ann Rev Med. 2011;62:107–125. - PubMed
    1. Cohen TS, Prince A. Cystic fibrosis: a mucosal immunodeficiency syndrome. Nat Med. 2012;18:509–519. - PMC - PubMed
    1. Downey DG, Bell SC, Elborn JS. Neutrophils in cystic fibrosis. Thorax. 2009;64:81–88. - PubMed
    1. Mayadas TN, Cullere X, Lowell CA. The multifaceted functions of neutrophils. Ann Rev Pathol. 2014;9:181–218. - PMC - PubMed

Publication types

MeSH terms