The effect of triamcinolone acetonide on laser-induced choroidal neovascularization in mice using a hypoxia visualization bio-imaging probe
- PMID: 25927172
- PMCID: PMC4415651
- DOI: 10.1038/srep09898
The effect of triamcinolone acetonide on laser-induced choroidal neovascularization in mice using a hypoxia visualization bio-imaging probe
Abstract
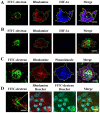
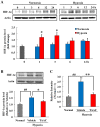
Hypoxic stress is a risk factor of ocular neovascularization. Hypoxia visualization may provide clues regarding the underlying cause of angiogenesis. Recently, we developed a hypoxia-specific probe, protein transduction domain-oxygen-dependent degradation domain-HaloTag-Rhodamine (POH-Rhodamine). In this study, we observed the localization of HIF-1α proteins by immunohistochemistry and the fluorescence of POH-Rhodamine on RPE-choroid flat mounts. Moreover, we compared the localization of POH-Rhodamine with pimonidazole which is a standard reagent for detecting hypoxia. Next, we investigated the effects of triamcinolone acetonide (TAAC) against visual function that was evaluated by recording electroretinogram (ERG) and choroidal neovascularization (CNV) development. Mice were given laser-induced CNV using a diode laser and treated with intravitreal injection of TAAC. Finally, we investigated POH-Rhodamine on CNV treated with TAAC. In this study, the fluorescence of POH-Rhodamine and HIF-1α were co-localized in laser-irradiated sites, and both the POH-Rhodamine and pimonidazole fluorescent areas were almost the same. Intravitreal injection of TAAC restored the reduced ERG b-wave but not the a-wave and decreased the mean CNV area. Furthermore, the area of the POH-Rhodamine-positive cells decreased. These findings indicate that POH-Rhodamine is useful for evaluating tissue hypoxia in a laser-induced CNV model, suggesting that TAAC suppressed CNV through tissue hypoxia improvement.
Conflict of interest statement
The authors declare no competing financial interests.
Figures


Similar articles
-
Hypoxia specific SDF-1 expression by retinal pigment epithelium initiates bone marrow-derived cells to participate in Choroidal neovascularization in a laser-induced mouse model.Curr Eye Res. 2011 Sep;36(9):838-49. doi: 10.3109/02713683.2011.593107. Curr Eye Res. 2011. PMID: 21851170
-
Role of PI3K/Akt and MEK/ERK in mediating hypoxia-induced expression of HIF-1alpha and VEGF in laser-induced rat choroidal neovascularization.Invest Ophthalmol Vis Sci. 2009 Apr;50(4):1873-9. doi: 10.1167/iovs.08-2591. Epub 2008 Dec 20. Invest Ophthalmol Vis Sci. 2009. PMID: 19098317
-
Influence of triamcinolone intravitreal injection on retinochoroidal healing processes.Exp Eye Res. 2007 Jun;84(6):1081-9. doi: 10.1016/j.exer.2007.01.024. Epub 2007 Feb 11. Exp Eye Res. 2007. PMID: 17408616
-
Resveratrol Inhibits Hypoxia-Induced Vascular Endothelial Growth Factor Expression and Pathological Neovascularization.Yonsei Med J. 2015 Nov;56(6):1678-85. doi: 10.3349/ymj.2015.56.6.1678. Yonsei Med J. 2015. PMID: 26446654 Free PMC article.
-
Inhibition of RACK1 ameliorates choroidal neovascularization formation in vitro and in vivo.Exp Mol Pathol. 2016 Jun;100(3):451-9. doi: 10.1016/j.yexmp.2016.04.004. Epub 2016 Apr 22. Exp Mol Pathol. 2016. PMID: 27112838
Cited by
-
Etiological Roles of p75NTR in a Mouse Model of Wet Age-Related Macular Degeneration.Cells. 2023 Jan 12;12(2):297. doi: 10.3390/cells12020297. Cells. 2023. PMID: 36672232 Free PMC article.
-
Aerobic Glycolysis Hypothesis Through WNT/Beta-Catenin Pathway in Exudative Age-Related Macular Degeneration.J Mol Neurosci. 2017 Aug;62(3-4):368-379. doi: 10.1007/s12031-017-0947-4. Epub 2017 Jul 8. J Mol Neurosci. 2017. PMID: 28689265 Review.
-
Intravitreal itraconazole inhibits laser-induced choroidal neovascularization in rats.PLoS One. 2017 Jun 30;12(6):e0180482. doi: 10.1371/journal.pone.0180482. eCollection 2017. PLoS One. 2017. PMID: 28666022 Free PMC article.
-
Anti-angiogenic Therapy in Cancer: Downsides and New Pivots for Precision Medicine.Front Pharmacol. 2017 Jan 6;7:519. doi: 10.3389/fphar.2016.00519. eCollection 2016. Front Pharmacol. 2017. PMID: 28111549 Free PMC article. Review.
-
Tissue factor induces VEGF expression via activation of the Wnt/β-catenin signaling pathway in ARPE-19 cells.Mol Vis. 2016 Jul 25;22:886-97. eCollection 2016. Mol Vis. 2016. PMID: 27499609 Free PMC article.
References
-
- Kwak N., Okamoto N., Wood J. M. & Campochiaro P. A. VEGF is major stimulator in model of choroidal neovascularization. Invest Ophthalmol Vis Sci 41, 3158–64 (2000). - PubMed
-
- Huang L. E., Arany Z., Livingston D. M. & Bunn H. F. Activation of hypoxia-inducible transcription factor depends primarily upon redox-sensitive stabilization of its alpha subunit. J Biol Chem 271, 32253–9 (1996). - PubMed
MeSH terms
Substances
LinkOut - more resources
Full Text Sources
Other Literature Sources

