

Optimally choosing PWM motif databases and sequence scanning approaches based on ChIP-seq data
- PMID: 25927199
- PMCID: PMC4436866
- DOI: 10.1186/s12859-015-0573-5
Optimally choosing PWM motif databases and sequence scanning approaches based on ChIP-seq data
Abstract
Background: For many years now, binding preferences of Transcription Factors have been described by so called motifs, usually mathematically defined by position weight matrices or similar models, for the purpose of predicting potential binding sites. However, despite the availability of thousands of motif models in public and commercial databases, a researcher who wants to use them is left with many competing methods of identifying potential binding sites in a genome of interest and there is little published information regarding the optimality of different choices. Thanks to the availability of large number of different motif models as well as a number of experimental datasets describing actual binding of TFs in hundreds of TF-ChIP-seq pairs, we set out to perform a comprehensive analysis of this matter.
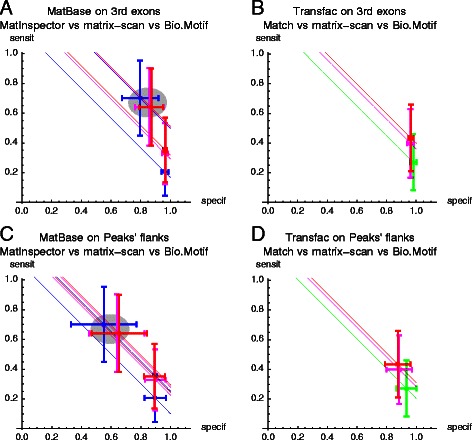
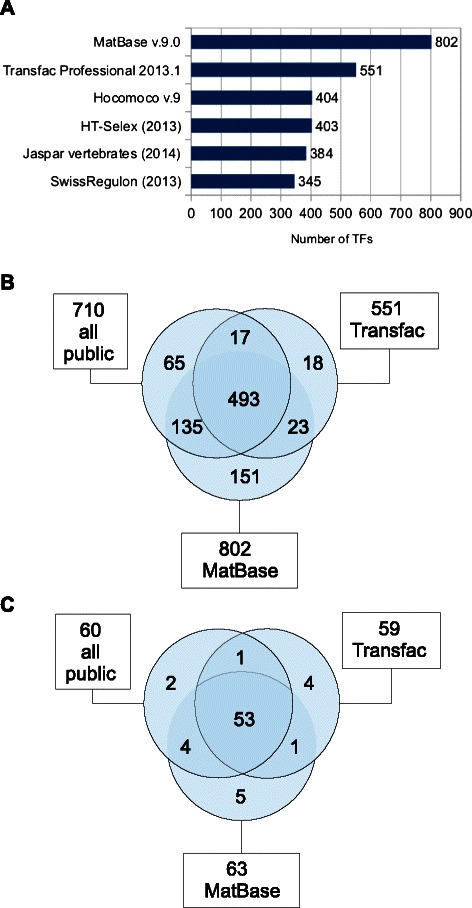
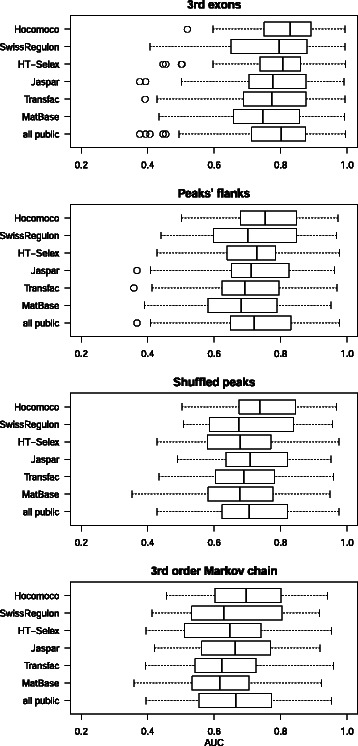
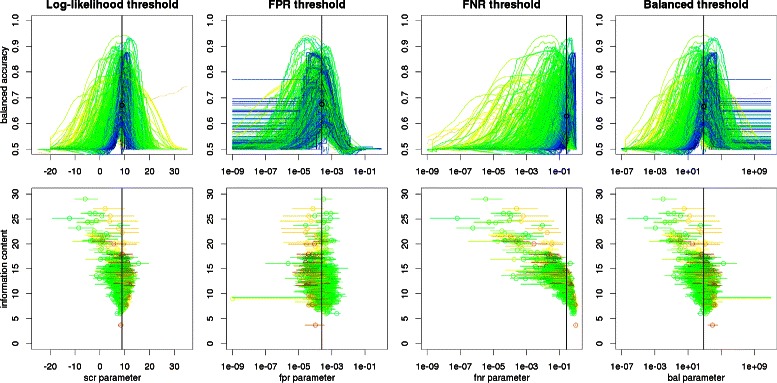
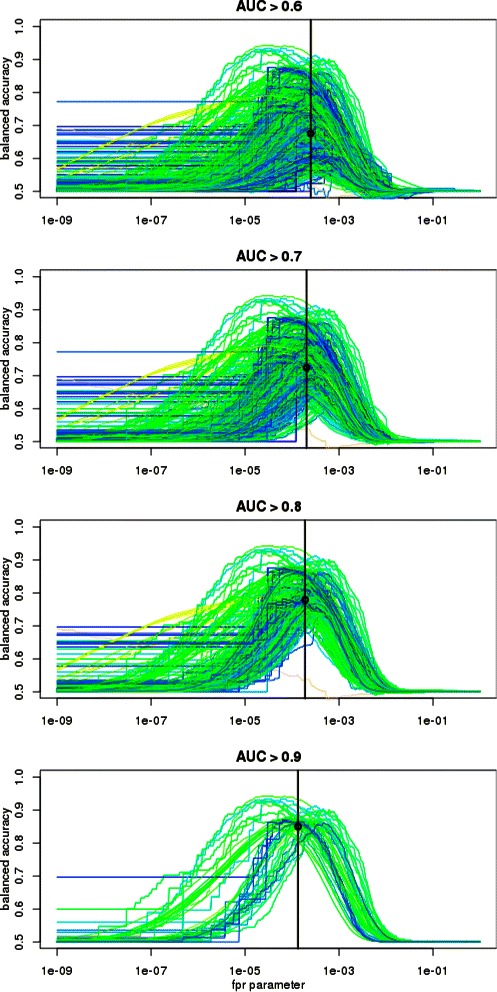
Results: We focus on the task of identifying potential transcription factor binding sites in the human genome. Firstly, we provide a comprehensive comparison of the coverage and quality of models available in different databases, showing that the public databases have comparable TFs coverage and better motif performance than commercial databases. Secondly, we compare different motif scanners showing that, regardless of the database used, the tools developed by the scientific community outperform the commercial tools. Thirdly, we calculate for each motif a detection threshold optimizing the accuracy of prediction. Finally, we provide an in-depth comparison of different methods of choosing thresholds for all motifs a priori. Surprisingly, we show that selecting a common false-positive rate gives results that are the least biased by the information content of the motif and therefore most uniformly accurate.
Conclusion: We provide a guide for researchers working with transcription factor motifs. It is supplemented with detailed results of the analysis and the benchmark datasets at http://bioputer.mimuw.edu.pl/papers/motifs/ .
Figures
Similar articles
-
Simultaneously learning DNA motif along with its position and sequence rank preferences through expectation maximization algorithm.J Comput Biol. 2013 Mar;20(3):237-48. doi: 10.1089/cmb.2012.0233. J Comput Biol. 2013. PMID: 23461573
-
Inferring intra-motif dependencies of DNA binding sites from ChIP-seq data.BMC Bioinformatics. 2015 Nov 9;16:375. doi: 10.1186/s12859-015-0797-4. BMC Bioinformatics. 2015. PMID: 26552868 Free PMC article.
-
Differential motif enrichment analysis of paired ChIP-seq experiments.BMC Genomics. 2014 Sep 2;15(1):752. doi: 10.1186/1471-2164-15-752. BMC Genomics. 2014. PMID: 25179504 Free PMC article.
-
DNA Motif Databases and Their Uses.Curr Protoc Bioinformatics. 2015 Sep 3;51:2.15.1-2.15.6. doi: 10.1002/0471250953.bi0215s51. Curr Protoc Bioinformatics. 2015. PMID: 26334922 Review.
-
DNA sequence motif: a jack of all trades for ChIP-Seq data.Adv Protein Chem Struct Biol. 2013;91:135-71. doi: 10.1016/B978-0-12-411637-5.00005-6. Adv Protein Chem Struct Biol. 2013. PMID: 23790213 Review.
Cited by
-
Integrated analysis of motif activity and gene expression changes of transcription factors.Genome Res. 2018 Feb;28(2):243-255. doi: 10.1101/gr.227231.117. Epub 2017 Dec 12. Genome Res. 2018. PMID: 29233921 Free PMC article.
-
Target Finder of Transcription Factor (TFoTF): a novel tool to predict transcription factor-targeted genes in cancer.Mol Oncol. 2023 Jul;17(7):1246-1262. doi: 10.1002/1878-0261.13388. Epub 2023 Feb 11. Mol Oncol. 2023. PMID: 36734611 Free PMC article.
-
Negative selection maintains transcription factor binding motifs in human cancer.BMC Genomics. 2016 Jun 23;17 Suppl 2(Suppl 2):395. doi: 10.1186/s12864-016-2728-9. BMC Genomics. 2016. PMID: 27356864 Free PMC article.
-
A Multireporter Bacterial 2-Hybrid Assay for the High-Throughput and Dynamic Assay of PDZ Domain-Peptide Interactions.ACS Synth Biol. 2019 May 17;8(5):918-928. doi: 10.1021/acssynbio.8b00499. Epub 2019 Apr 18. ACS Synth Biol. 2019. PMID: 30969105 Free PMC article.
-
Bioinformatic Prediction and High Throughput In Vivo Screening to Identify Cis-Regulatory Elements for the Development of Algal Synthetic Promoters.ACS Synth Biol. 2024 Jul 19;13(7):2150-2165. doi: 10.1021/acssynbio.4c00199. Epub 2024 Jul 10. ACS Synth Biol. 2024. PMID: 38986010 Free PMC article.
References
-
- Xing EP, Jordan MI, Karp RM, Russell S. A hierarchical bayesian markovian model for motifs in biopolymer sequences. In: Becker S, Thrun S, Obermayer K, editors. Advances in Neural Information Processing Systems 15. Vancouver Canada: MIT Press; 2003.
Publication types
MeSH terms
Substances
LinkOut - more resources
Full Text Sources
Other Literature Sources
Miscellaneous
