. 2015 Apr 30;10(4):e0125567.
doi: 10.1371/journal.pone.0125567. eCollection 2015.

Effects of age and acute ethanol on glutamatergic neurotransmission in the medial prefrontal cortex of freely moving rats using enzyme-based microelectrode amperometry

Affiliations

Effects of age and acute ethanol on glutamatergic neurotransmission in the medial prefrontal cortex of freely moving rats using enzyme-based microelectrode amperometry

Devesh Mishra et al. PLoS One. .

Abstract

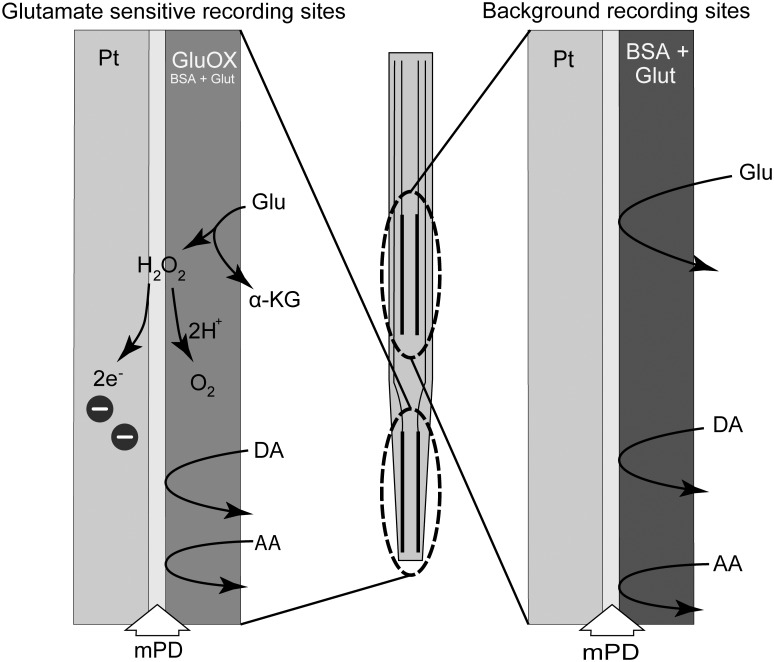
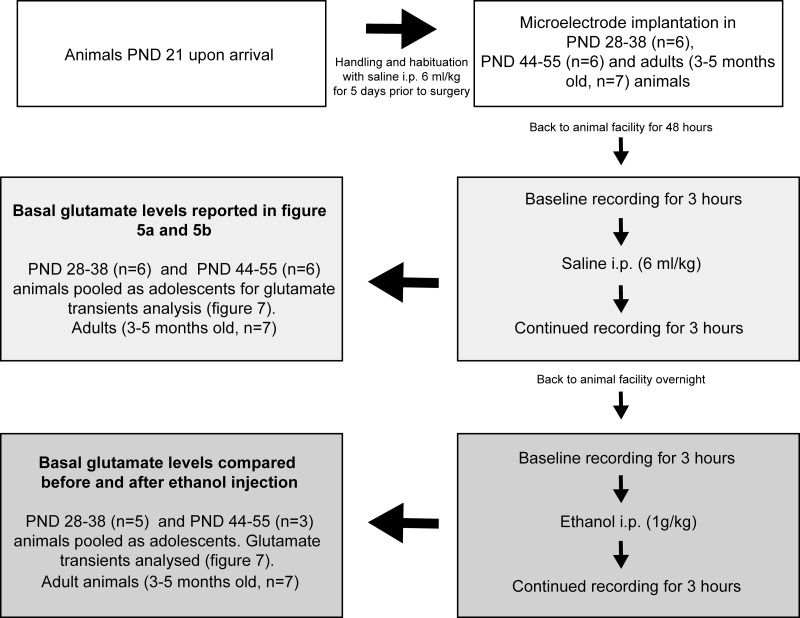
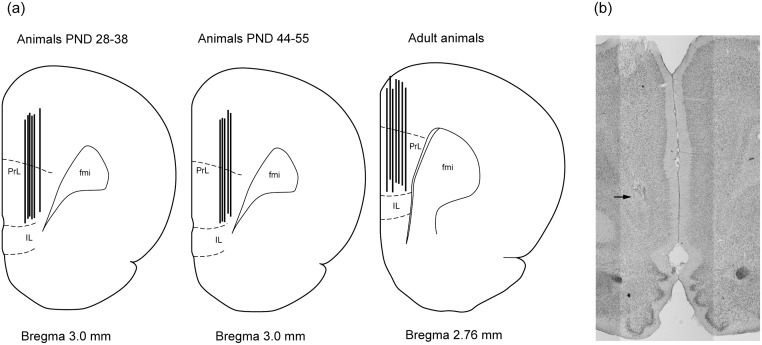
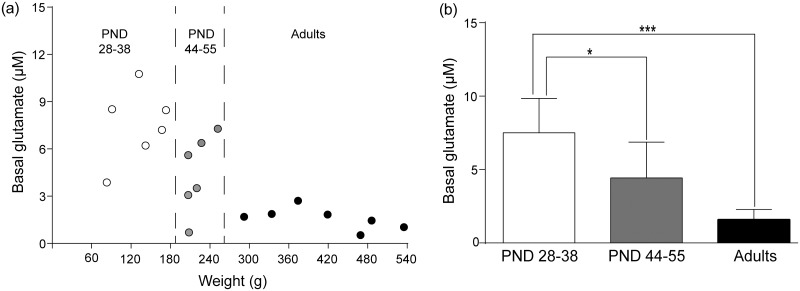
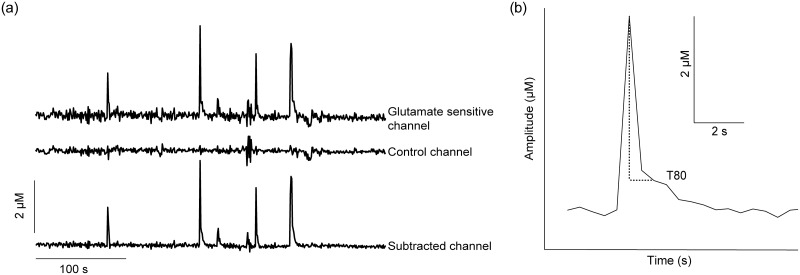
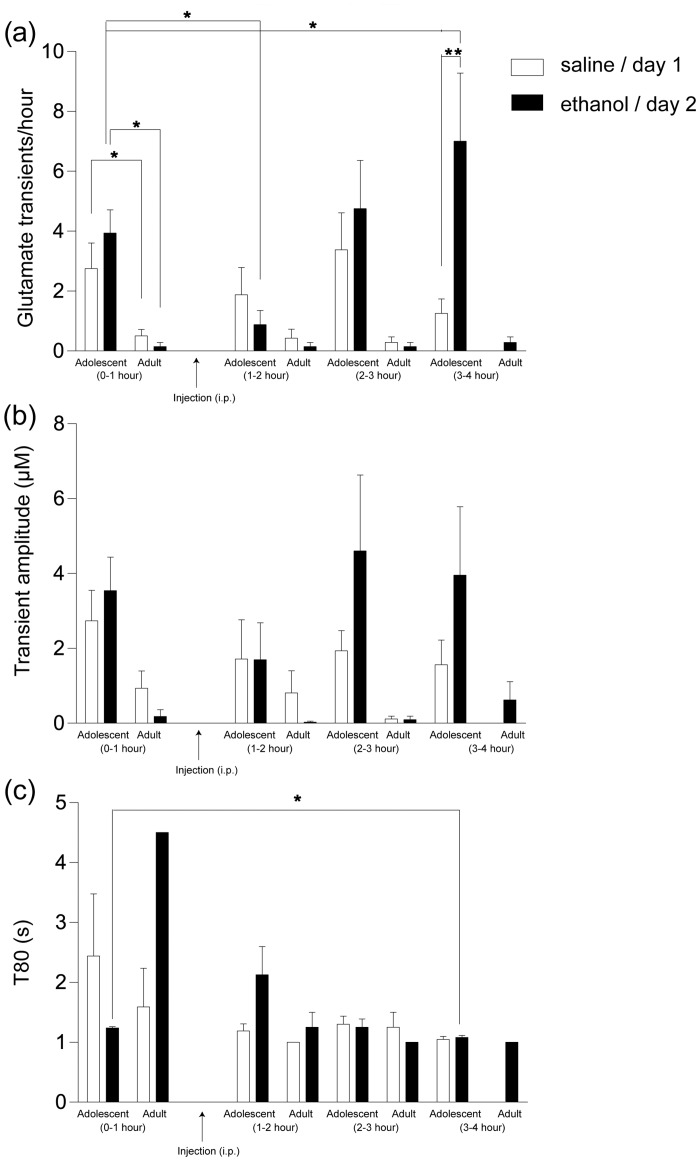
Ethanol abuse during adolescence may significantly alter development of the prefrontal cortex which continues to undergo structural remodeling into adulthood. Glutamatergic neurotransmission plays an important role during these brain maturation processes and is modulated by ethanol. In this study, we investigated glutamate dynamics in the medial prefrontal cortex of freely moving rats, using enzyme-based microelectrode amperometry. We analyzed the effects of an intraperitoneal ethanol injection (1 g/kg) on cortical glutamate levels in adolescent and adult rats. Notably, basal glutamate levels decreased with age and these levels were found to be significantly different between postnatal day (PND) 28-38 vs PND 44-55 (p<0.05) and PND 28-38 vs adult animals (p<0.001). We also observed spontaneous glutamate release (transients) throughout the recordings. The frequency of transients (per hour) was significantly higher in adolescent rats (PND 28-38 and PND 44-55) compared to those of adults. In adolescent rats, post-ethanol injection, the frequency of glutamate transients decreased within the first hour (p<0.05), it recovered slowly and in the third hour there was a significant rebound increase of the frequency (p<0.05). Our data demonstrate age-dependent differences in extracellular glutamate levels in the medial prefrontal cortex and suggest that acute ethanol injections have both inhibitory and excitatory effects in adolescent rats. These effects of ethanol on the prefrontal cortex may disturb its maturation and possibly limiting individuals´ control over addictive behaviors.


Conflict of interest statement

Competing Interests: The recording equipment used in this study was borrowed from H. Lundbeck. This does not alter the authors' adherence to PLOS ONE policies on sharing data and materials.

Figures

Fig 1
Fig 1. The enzyme scheme used in the detection of glutamate.
The tip of the microelectrode consists of two pairs of platinum recording sites. One pair, the glutamate sensitive sites, were coated with a mixture of glutamate oxidase (GluOx), bovine serum albumin (BSA) and glutaraldehyde (0.125%). The remaining pair was coated only with BSA and glutaraldehyde and they served as control (background/sentinel) channels sensitive to the oxidation of endogenous molecules other than glutamate. m-phenylenediamine dihydrochloride (m-PD) was electropolymerized onto all sites of the microelectrode in order to reduce access of potential electroactive interferents, like ascorbic acid (AA) and catecholamines, to the platinum recording sites (Mitchell, 2004). Released glutamate is oxidized by GluOx at the glutamate-sensitive sites, generating α-ketoglutarate and H2O2. Since the microelectrode is maintained at a constant potential (+0.7 V versus an Ag/AgCl reference), the H2O2 reporting molecule is further oxidized, yielding two electrons. The resulting current is then amplified and recorded by a FAST-16 recording system (Quanteon, LLC, Nicholasville, KY, USA). Extracellular glutamate reaches the platinum surface of control sentinels (without GluOx) but no oxidation current is generated. Therefore, any current detected at these sites is due to electrochemically active interferents other than glutamate.
Fig 2
Fig 2. A representative in vitro calibration of the microelectrode performed prior to implantation into the mPFC.
The top two tracings represent recording from glutamate-sensitive channels (coated with glutamate oxidase) and the bottom two tracings are generated from control channels. Arrows represent the addition of various substances into the calibration beaker. Current (in nA) is shown along the vertical axis and time in seconds along the horizontal axis. Three successive additions of glutamate (20 μM/aliquot) produced a linear increase of current on the glutamate sensitive channels. Expectedly, there were no changes in current detected on the two control channels. The calibration also shows comparable sensitivities on all four channels to the reporting molecule H2O2. m-PD was efficient in blocking the changes in currents due to potential electroactive interferents, i.e. ascorbic acid (AA) and dopamine (DA).
Fig 3
Fig 3. Experimental design.
The number of animals in each age group, the experimental days, data collection and how age groups were pooled for statistical analysis are provided above. PND: postnatal day, i.p: intraperitoneal injection.
Fig 4
Fig 4. Localization of the microelectrode in the mPFC.
a) Localization of microelectrodes in the mPFC of animals aged PND 28–38, PND 44–55 and adult animals according to Paxinos and Watson brain atlas, fourth edition [24]. PL: prelimbic, IL: infralimbic, fmi: forceps minor. b) Photomicrograph illustrating a representative placement of the microelectrode in the mPFC of a PND38 rat, (coronal section). The end of the platinum tip of the microelectrode (i.e. the recording sites) is indicated by the arrow.
Fig 5
Fig 5. Basal glutamate on experimental day 1
a) Basal glutamate levels expressed as a function of age range and their corresponding weights on the day of recording. Each circle represents an individual animal. b) The cortical levels (μM) of glutamate in animals in postnatal day (PND) 28–38 were more than three times higher compared to that of adults (3–5 months old). Glutamate levels decreased with increasing age. Significance was tested using two-way ANOVA followed by Bonferroni´s post-hoc comparison test. *p<0.05, ***p<0.001.
Fig 6
Fig 6. Recordings from a freely moving animal.
a) A representative trace showing spontaneous glutamate transients in an animal postnatal day 34, within the third hour post-ethanol injection. b) Representative picture of a single glutamate transient from the subtracted channel. Amplitude (μM) is represented by the vertical axis and time in seconds on horizontal axis. T80 represents the time in seconds from maximum peak rise to 80% decay of signal (a measure of glutamate clearance).
Fig 7
Fig 7. Effects of saline and ethanol injections on spontaneous glutamate transients in adolescent and adult animals.
Experimental recordings were performed over two days: Experimental day 1 (saline injection, 6 ml/kg, unfilled bars) and experimental day 2 (ethanol injection, 1 g/kg, filled bars). Baseline recordings are represented as 0–1 hour on the x axis. Following baseline recordings, the animals received an intraperitoneal (i.p.) injection and recordings were continued for three hours. Every hour post injection is represented as 1–2 (first hour), 2–3 (second hour) and 3–4 (third hour) hour on the x axis. a) Experimental day 1 baseline recordings show that the transient frequency was higher in adolescent when compared with transients of adult animals (*p<0.05). The transient frequency was unaffected in any hour in both age groups post-saline injection compared to their respective baseline values. On experimental day 2, the transient frequency was higher in adolescent compared to adult animals (*p<0.05) during baseline recordings. An ethanol injection inhibited the transient frequency (*p<0.05) in the first hour and potentiated it in the third hour compared to the baseline values (*p<0.05) in adolescent animals. b) The averaged transient amplitude was higher in adolescent when compared to adult animals on both experimental day 1 and 2 during baseline recordings (p = 0.055 and p = 0.06, respectively). Averaged transient amplitudes were unaffected following saline injection in both age groups (p>0.05). Post-ethanol injection in adolescent animals, the average amplitudes decreased within the first hour and increased in the third hour. However, these changes in amplitude were not significant when compared to baseline values (p>0.05). In the adult animals, the average amplitude was unaffected following ethanol injection (p>0.05). c) We did not observe any significant difference between the averaged T80 value during baseline recordings of adolescent and adult animals (p>0.05). In adolescent animals, post-ethanol injection, in the third hour, the averaged T80 value decreased significantly (*p<0.05) when compared to the baseline values. Due to a low number of transients in adult animals, we could not perform any statistical analysis using T80 values. Also, note that the values missing or bars without SEM are due to the fact that the transient were absent in certain hours or, very low in frequency, respectively. All statistical comparisons were made using two-way ANOVA with Bonferroni´s comparison test and paired student´s t-test was used for analysis of T80. *p<0.05, **p<0.01.

Similar articles

Cited by

References

    1. deGraaf-Peters VB, Hadders-Algra M. Ontogeny of the human central nervous system: what is happening when? Early human development 2006;82: 257–266. - PubMed
    1. Spear LP. The adolescent brain and age-related behavioral manifestations. Neuroscience and biobehavioral reviews. 2000;24: 417–63. - PubMed
    1. Blakemore SJ, Choudhury S. Development of the adolescent brain: implications for executive function and social cognition. Journal of child psychology and psychiatry, and allied disciplines. 2006;47: 296–312. - PubMed
    1. Maletic-Savatic M, Malinow R, Svoboda K. Rapid dendritic morphogenesis in CA1 hippocampal dendrites induced by synaptic activity. Science. 1999;283: 1923–7. - PubMed
    1. Toni N, Buchs PA, Nikonenko I, Bron CR, Muller D. LTP promotes formation of multiple spine synapses between a single axon terminal and a dendrite. Nature. 1999; 402:421–5. - PubMed

Publication types

LinkOut - more resources