. 2015 Apr 30;10(4):e0122104.
doi: 10.1371/journal.pone.0122104. eCollection 2015.

Heterogeneity of synovial molecular patterns in patients with arthritis

Affiliations

Heterogeneity of synovial molecular patterns in patients with arthritis

Bernard R Lauwerys et al. PLoS One. .

Abstract

Objectives: Early diagnosis of rheumatoid arthritis (RA) is an unmet medical need in the field of rheumatology. Previously, we performed high-density transcriptomic studies on synovial biopsies from patients with arthritis, and found that synovial gene expression profiles were significantly different according to the underlying disorder. Here, we wanted to further explore the consistency of the gene expression signals in synovial biopsies of patients with arthritis, using low-density platforms.

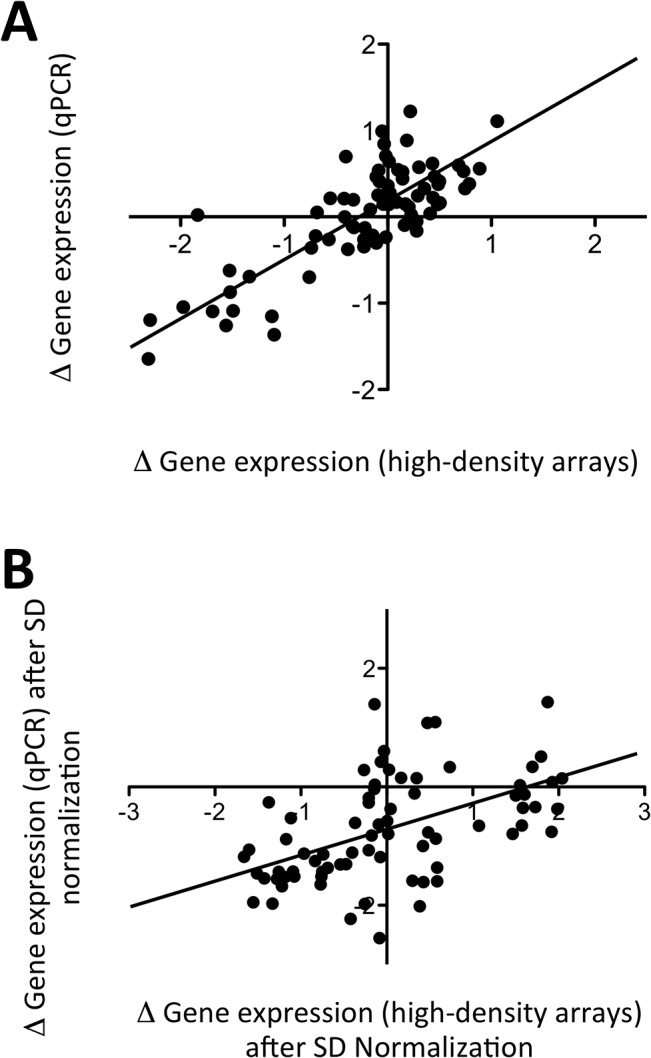
Methods: Low-density assays (cDNA microarray and microfluidics qPCR) were designed, based on the results of the high-density microarray data. Knee synovial biopsies were obtained from patients with RA, spondyloarthropathies (SA) or osteoarthritis (OA) (n = 39), and also from patients with initial undifferentiated arthritis (UA) (n = 49).

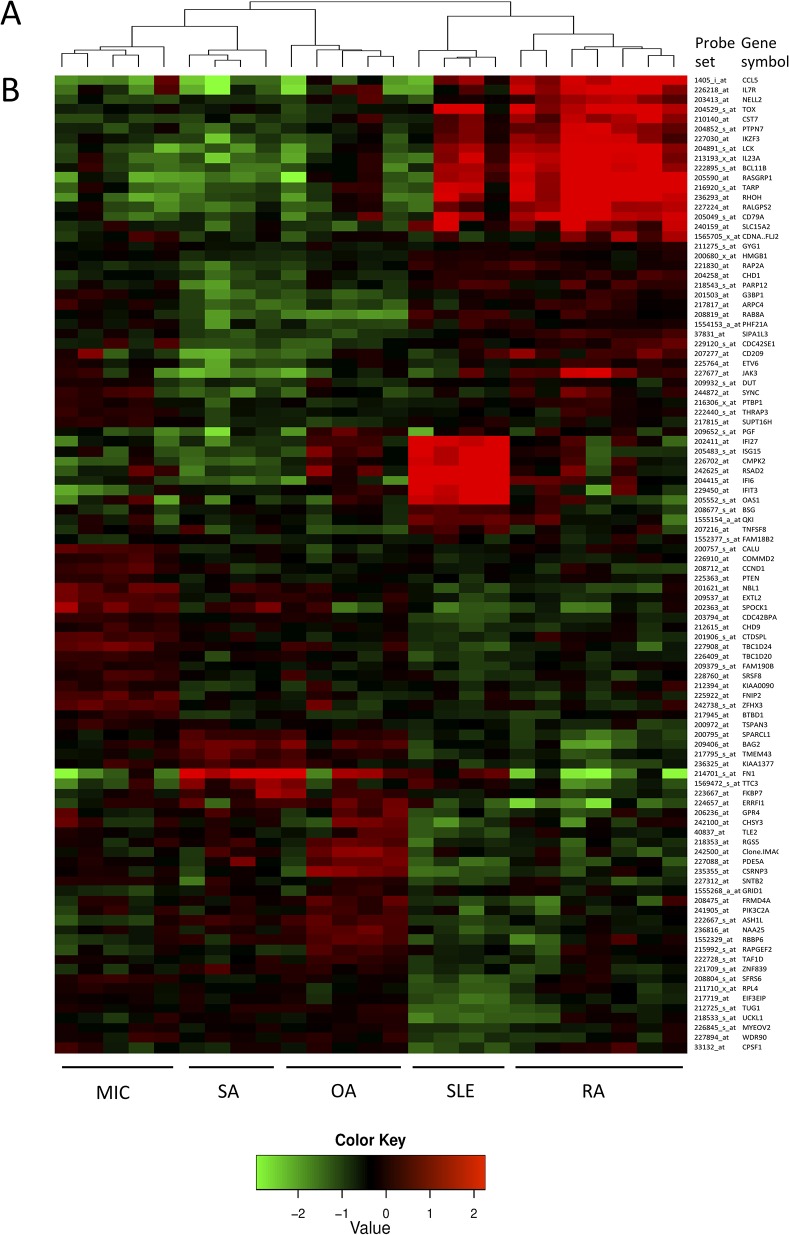
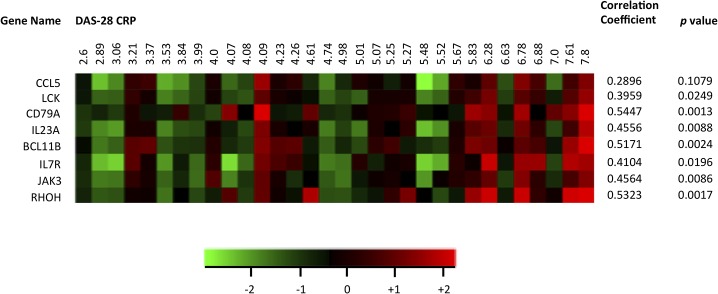
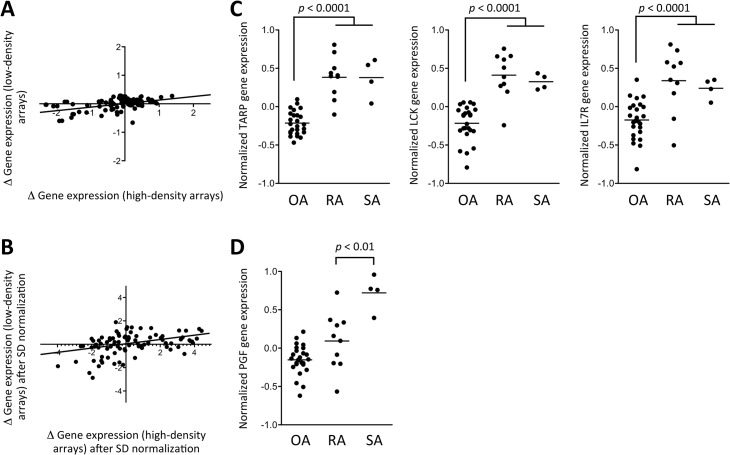
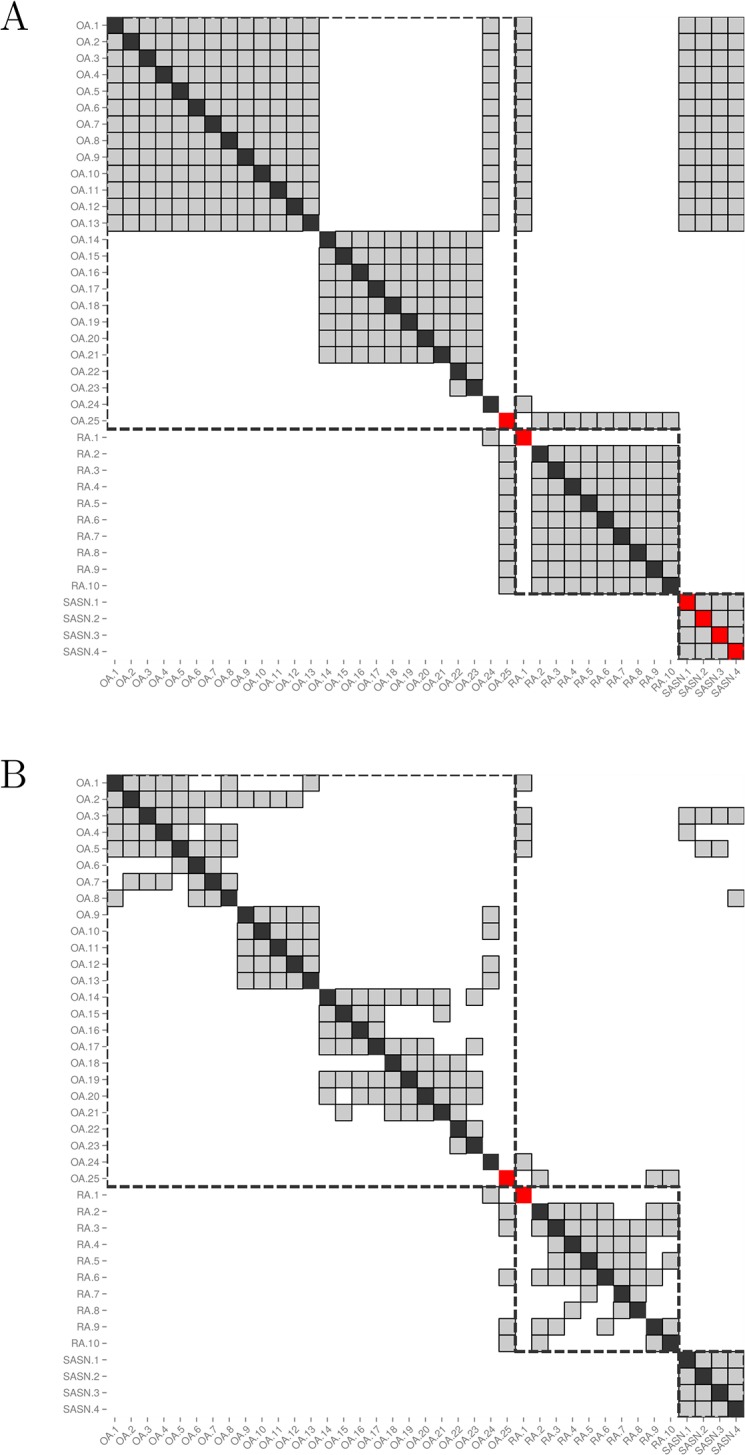
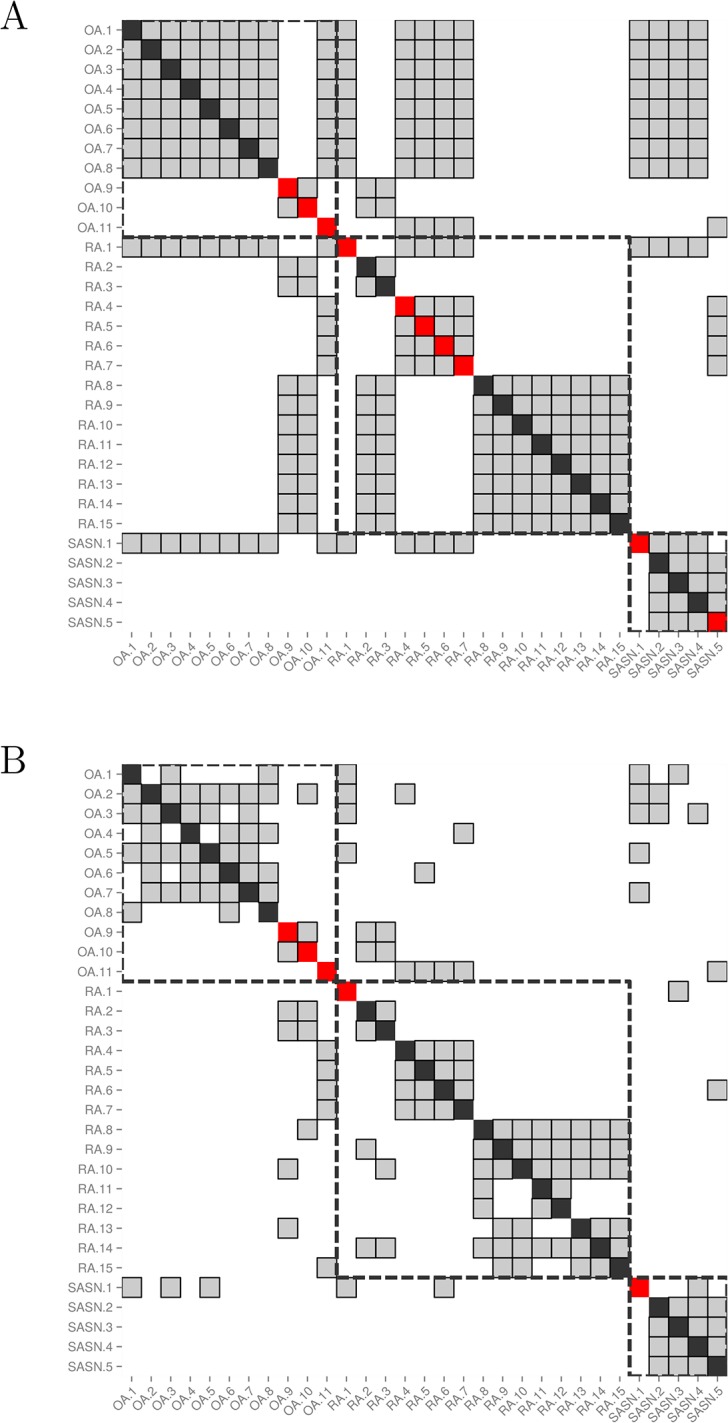
Results: According to high-density microarray data, several molecular pathways are differentially expressed in patients with RA, SA and OA: T and B cell activation, chromatin remodelling, RAS GTPase activation and extracellular matrix regulation. Strikingly, disease activity (DAS28-CRP) has a significant influence on gene expression patterns in RA samples. Using the low-density assays, samples from patients with OA are easily discriminated from RA and SA samples. However, overlapping molecular patterns are found, in particular between RA and SA biopsies. Therefore, prediction of the clinical diagnosis based on gene expression data results in a diagnostic accuracy of 56.8%, which is increased up to 98.6% by the addition of specific clinical symptoms in the prediction algorithm. Similar observations are made in initial UA samples, in which overlapping molecular patterns also impact the accuracy of the diagnostic algorithm. When clinical symptoms are added, the diagnostic accuracy is strongly improved.

Conclusions: Gene expression signatures are overall different in patients with OA, RA and SA, but overlapping molecular signatures are found in patients with these conditions. Therefore, an accurate diagnosis in patients with UA requires a combination of gene expression and clinical data.


Conflict of interest statement

Competing Interests: A patent application (12/528,615 based on PCT Application N° PCT/EP2008/052532: « Method for the determination and the classification of rheumatic conditions) was deposited by the Université catholique de Louvain (BRL, FAH and BJVdE). This does not alter the authors' adherence to PLOS ONE policies on sharing data and materials. TH is CEO and PD is founder of DNAlytics, a spin-off company of the Université catholique de Louvain that currently develops a diagnostic application based on the results presented in this manuscript. PG is a collaborator of DNAlytics. All other authors declare that they have no competing interests.

Figures

Fig 1
Fig 1. Balanced classification rate (BCR) of a nearest neighbor classifier as a function of the signature size (number of genes) used for prediction.
Lists of genes of progressively decreasing sizes were determined based on high-density transcriptomic data, and used in order to predict diagnosis in 25 patients with RA, SLE, OA, SA and MIC. BCR is plotted in function of the signature size. Lists of genes containing between 20 and 100 probe sets provide performances that range between 83% and 85%.
Fig 2
Fig 2. High-density gene expression data used for the design of the low-density platform.
Analyses performed on high density transcriptomic data resulted in the selection of 100 probe sets differentiating patients with RA, SLE, OA, MIC and SA. The probes and gene symbols are also listed in S3 Table. (A) Hierarchical clustering algorithms using the high density gene expression values of these genes (and based on the Pearson correlation distance) distribute the samples into “inflammatory” (RA and SLE) and “high extra-cellular matrix turn-over” (OA, SA and MIC) clusters. They also identify diagnostic subdivisions. (B) The high density gene expression values of these 100 genes are displayed according to the clinical diagnosis of the samples.
Fig 3
Fig 3. Effect of disease activity on gene expression in RA samples.
Mean centered log2-transformed expression levels of selected T cell activation-associated transcripts were extracted from HGU133 Plus2.0 GeneChip array data sets of 32 patients with RA. DAS28-CRP scores were retrieved from the medical files of the patients, and the samples are sorted by ascending DAS28-CRP. Correlation coefficients (Pearson r) between gene expression and DAS28-CRP are displayed for each transcript.
Fig 4
Fig 4. Comparison of gene expression differences between samples from patients with OA, RA and SA, using high-density versus low-density microarrays.
Independent sets of samples were hybridized on high-density (HGU133 Plus 2.0 GeneChip) and low-density (DualChip) microarrays. (A) Differences in mean (log2-transformed) gene expression values between OA and (RA+SA) samples are displayed for the samples hybridized on high-density (x axis) versus low-density (y axis) arrays. (B) The same data from OA and (RA+SA) samples are displayed after normalization of each mean (log2-transformed) gene expression value by its standard deviation. (C) Normalized TCR gamma alternate reading frame protein (TARP), lymphocyte-specific protein tyrosine kinase (LCK) and Interleukin-7 Receptor (IL7R) gene expression data in OA versus RA and SA samples observed using low-density arrays. (D) Normalized Placental Growth Factor (PGF) gene expression data in OA versus RA and SA samples observed using low-density arrays. Mean values are represented by a horizontal bar. p values are calculated using Student’s t tests.
Fig 5
Fig 5. Impact of low-density microarray data on the determination of the nearest neighbors.
Both matrices show the nearest neighbors of each biopsy sample from the cohort of patients with a known diagnosis (n = 39). Each sample is represented by a column, and its nearest neighbors are greyed out in that column. The cell on the diagonal is red if the sample is misclassified and black otherwise. Samples from patients with the same diagnosis are surrounded by a dashed square. (A) Nearest neighbors are determined using clinical data only (ρ = 1). More than 5 nearest neighbors are displayed for each sample due to the presence of ties. (B) Nearest neighbors are determined using a combination of clinical and low-density array data (ρ = 0.5), resulting in a correct classification of the last 4 SA samples thanks to good tie-breaking.
Fig 6
Fig 6. Comparison of gene expression differences between samples from patients with OA, RA and SA, using high-density arrays versus qPCR.
Independent sets of samples were hybridized on high-density (HGU133 Plus 2.0 GeneChip) and analyzed by qPCR (Taqman low density array). (A) Differences in mean (log2-transformed) gene expression values between OA and (RA+SA) samples are displayed for the samples analyzed using high-density arrays (x axis) versus qPCR (y axis). (B) The same data from OA and (RA+SA) samples are displayed after normalization of each mean (log2-transformed) gene expression value by its standard deviation.
Fig 7
Fig 7. Impact of qPCR data on the determination of the nearest neighbors in UA samples.
Both matrices show the nearest neighbors of each biopsy sample from the cohort of patients with UA, for whom qPCR data are available (n = 31). Each sample is represented by a column, and its nearest neighbors are greyed out in that column. The cell on the diagonal is red if the sample is misclassified and black otherwise. Samples from patients with the same diagnosis are surrounded by a dashed square. (A) Nearest neighbors are determined using only clinical data (ρ = 1). More than 5 nearest neighbors are displayed for each sample due to the presence of ties. (B) Nearest neighbors are determined using a combination of clinical and qPCR data (ρ = 0.2), demonstrating the tie-breaking effect of the qPCR data.

References

    1. Quinn MA, Conaghan PG, Emery P. The therapeutic approach of early intervention for rheumatoid arthritis: what is the evidence? Rheumatology (Oxford). 2001; 40: 1211–20. - PubMed
    1. O’Dell JR. Treating rheumatoid arthritis early: a window of opportunity? Arthritis Rheum. 2002; 46: 283–5. - PubMed
    1. Mottonen T, Hannonen P, Korpela M, Nissilä M, Kautiainen H, Ilonen J, et al. FINnish Rheumatoid Arthritis Combination therapy. Delay to institution of therapy and induction of remission using single-drug or combination disease-modifying antirheumatic drug therapy in early rheumatoid arthritis. Arthritis Rheum. 2002; 46: 894–8. - PubMed
    1. Goekoop-Ruiterman YP, de Vries-Bouwstra JK, Allaart CF, van Zeben D, Kerstens PJ, Hazes JM, et al. Comparison of treatment strategies in early rheumatoid arthritis: a randomized trial. Ann Intern Med. 2007; 146: 406–15. - PubMed
    1. Emery P, McInnes IB, van Vollenhoven R, Kraan MC. Clinical identification and treatment of a rapidly progressing disease state in patients with rheumatoid arthritis. Rheumatology (Oxford). 2008; 47: 392–8. - PubMed

Publication types

Associated data