Fully automatic evaluation of the corneal endothelium from in vivo confocal microscopy
- PMID: 25928199
- PMCID: PMC4451752
- DOI: 10.1186/s12880-015-0054-3
Fully automatic evaluation of the corneal endothelium from in vivo confocal microscopy
Abstract
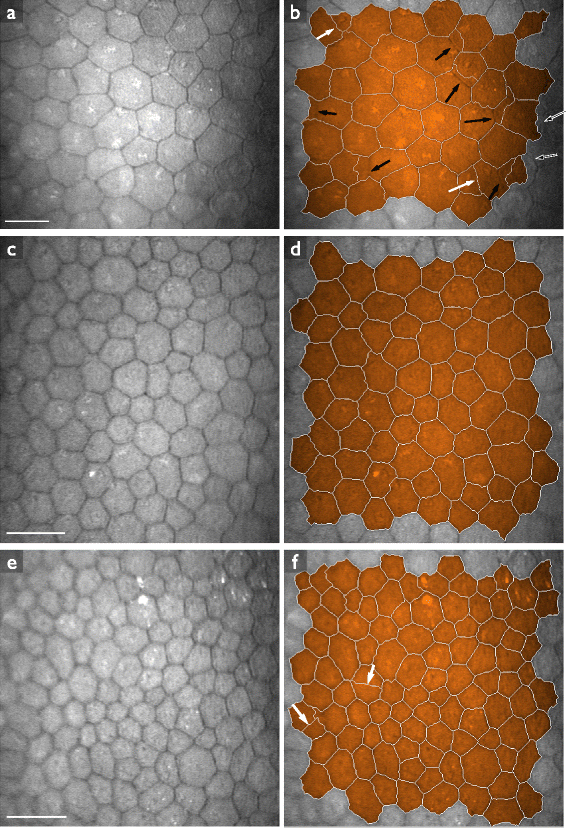
Background: Manual and semi-automatic analyses of images, acquired in vivo by confocal microscopy, are often used to determine the quality of corneal endothelium in the human eye. These procedures are highly time consuming. Here, we present two fully automatic methods to analyze and quantify corneal endothelium imaged by in vivo white light slit-scanning confocal microscopy.
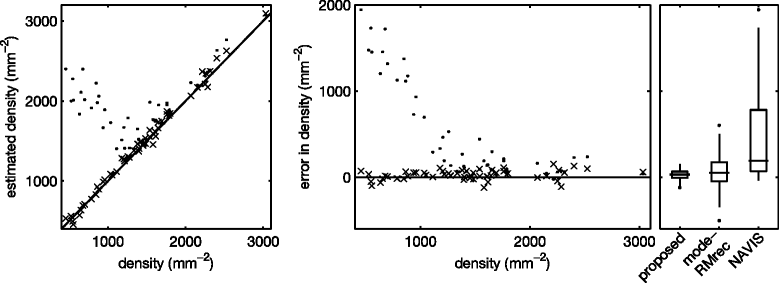
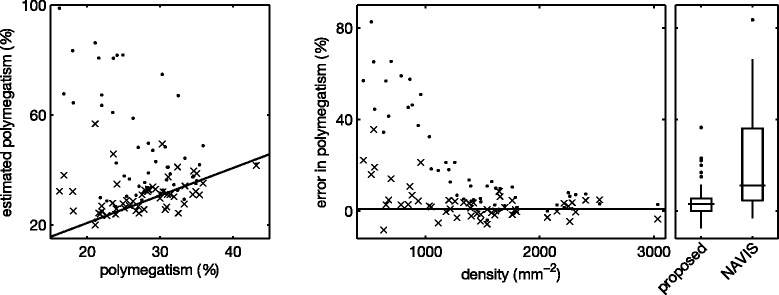
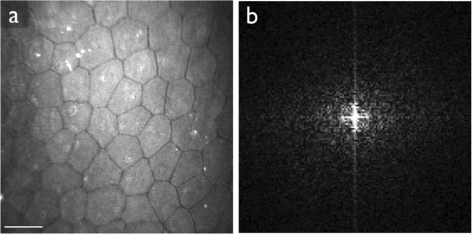
Methods: In the first approach, endothelial cell density is estimated with the help of spatial frequency analysis. We evaluate published methods, and propose a new, parameter-free method. In the second approach, based on the stochastic watershed, cells are automatically segmented and the result is used to estimate cell density, polymegathism (cell size variability) and pleomorphism (cell shape variation). We show how to determine optimal values for the three parameters of this algorithm, and compare its results to a semi-automatic delineation by a trained observer.
Results: The frequency analysis method proposed here is more precise than any published method. The segmentation method outperforms the fully automatic method in the NAVIS software (Nidek Technologies Srl, Padova, Italy), which significantly overestimates the number of cells for cell densities below approximately 1200 mm(-2), as well as previously published methods.
Conclusions: The methods presented here provide a significant improvement over the state of the art, and make in vivo, automated assessment of corneal endothelium more accessible. The segmentation method proposed paves the way to many possible new morphometric parameters, which can quickly and precisely be determined from the segmented image.
Figures


Similar articles
-
A fully automated cell segmentation and morphometric parameter system for quantifying corneal endothelial cell morphology.Comput Methods Programs Biomed. 2018 Jul;160:11-23. doi: 10.1016/j.cmpb.2018.03.015. Epub 2018 Mar 22. Comput Methods Programs Biomed. 2018. PMID: 29728238
-
Dual-model automatic detection of nerve-fibres in corneal confocal microscopy images.Med Image Comput Comput Assist Interv. 2010;13(Pt 1):300-7. doi: 10.1007/978-3-642-15705-9_37. Med Image Comput Comput Assist Interv. 2010. PMID: 20879244 Free PMC article.
-
An image model and segmentation algorithm for reflectance confocal images of in vivo cervical tissue.IEEE Trans Image Process. 2005 Sep;14(9):1265-76. doi: 10.1109/tip.2005.852460. IEEE Trans Image Process. 2005. PMID: 16190463
-
[Morphometric characterization of the subbasal nerve plexus : Detection and analysis of networks of nerve fibers].Ophthalmologe. 2017 Jul;114(7):608-616. doi: 10.1007/s00347-017-0465-3. Ophthalmologe. 2017. PMID: 28224218 Review. German.
-
Objective Analysis of Corneal Nerves and Dendritic Cells.Klin Monbl Augenheilkd. 2024 Jun;241(6):713-721. doi: 10.1055/a-2307-0313. Epub 2024 Jun 28. Klin Monbl Augenheilkd. 2024. PMID: 38941998 Review. English, German.
Cited by
-
Machine Learning Analysis of Postkeratoplasty Endothelial Cell Images for the Prediction of Future Graft Rejection.Transl Vis Sci Technol. 2023 Feb 1;12(2):22. doi: 10.1167/tvst.12.2.22. Transl Vis Sci Technol. 2023. PMID: 36790821 Free PMC article.
-
Automated Image Segmentation of the Corneal Endothelium in Patients With Fuchs Dystrophy.Transl Vis Sci Technol. 2021 Nov 1;10(13):27. doi: 10.1167/tvst.10.13.27. Transl Vis Sci Technol. 2021. PMID: 34807254 Free PMC article.
-
Unbiased corneal tissue analysis using Gabor-domain optical coherence microscopy and machine learning for automatic segmentation of corneal endothelial cells.J Biomed Opt. 2020 Aug;25(9):1-17. doi: 10.1117/1.JBO.25.9.092902. J Biomed Opt. 2020. PMID: 32770867 Free PMC article.
-
Corneal endothelium assessment in specular microscopy images with Fuchs' dystrophy via deep regression of signed distance maps.Biomed Opt Express. 2022 Dec 19;14(1):335-351. doi: 10.1364/BOE.477495. eCollection 2023 Jan 1. Biomed Opt Express. 2022. PMID: 36698671 Free PMC article.
-
Machine learning for segmenting cells in corneal endothelium images.Proc SPIE Int Soc Opt Eng. 2019 Feb;10950:109504G. doi: 10.1117/12.2513580. Epub 2019 Mar 13. Proc SPIE Int Soc Opt Eng. 2019. PMID: 31762537 Free PMC article.
References
-
- Bourne WM, Nelson LR, Hodge DO. Central corneal endothelial cell changes over a ten-year period. Invest Ophthalmol Vis Sci. 1997;38(3):779–82. - PubMed
-
- Yee RW, Geroski DH, Matsuda M, Champeau EJ, Meyer LA, Edelhauser HF. Correlation of corneal endothelial pump site density, barrier function, and morphology in wound repair. Invest Ophthalmol Vis Sci. 1985;26(9):1191–2101. - PubMed
Publication types
MeSH terms
LinkOut - more resources
Full Text Sources
Other Literature Sources
Miscellaneous

