. 2015 Apr 30;10(4):e0125185.
doi: 10.1371/journal.pone.0125185. eCollection 2015.

Central presynaptic terminals are enriched in ATP but the majority lack mitochondria

Affiliations

Central presynaptic terminals are enriched in ATP but the majority lack mitochondria

Vrushali Chavan et al. PLoS One. .

Erratum in

Abstract

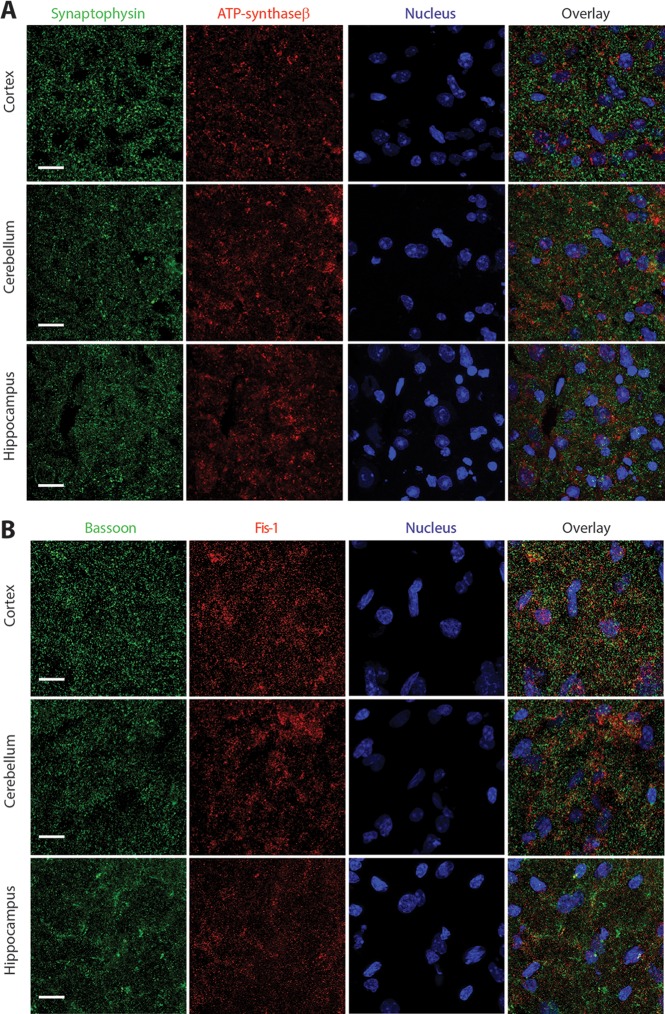
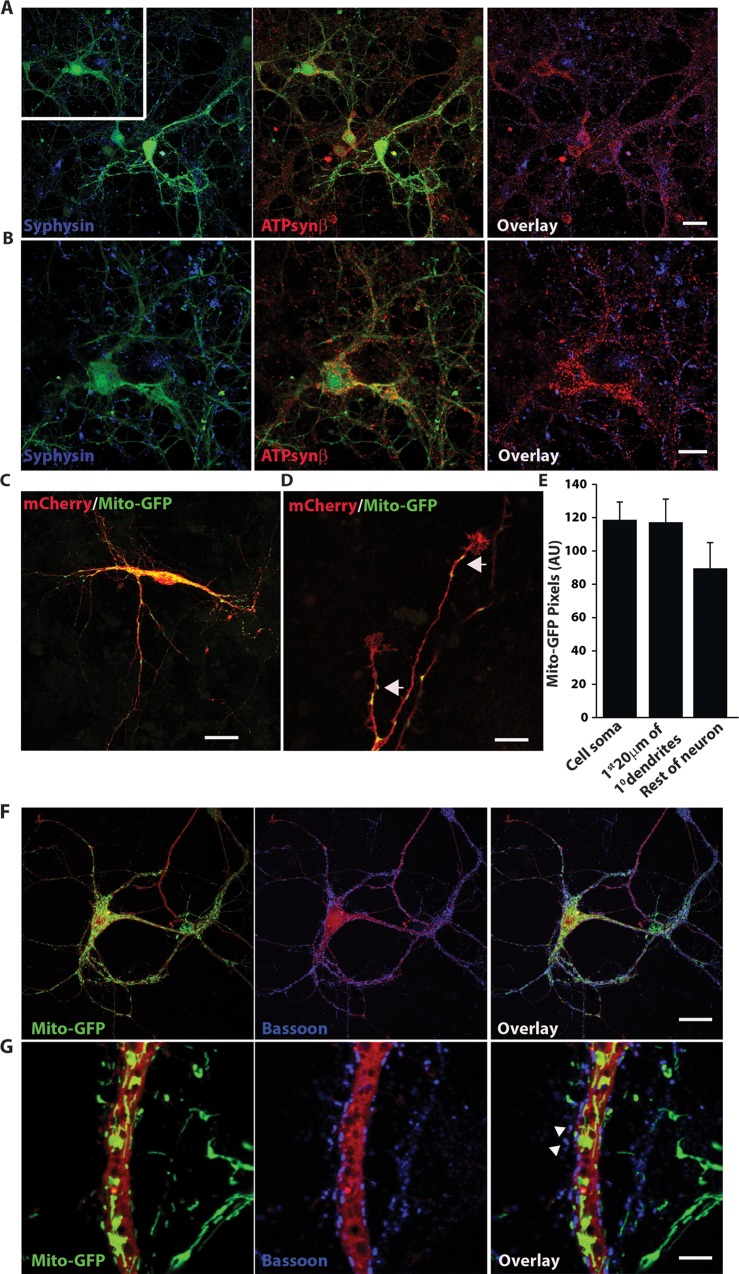
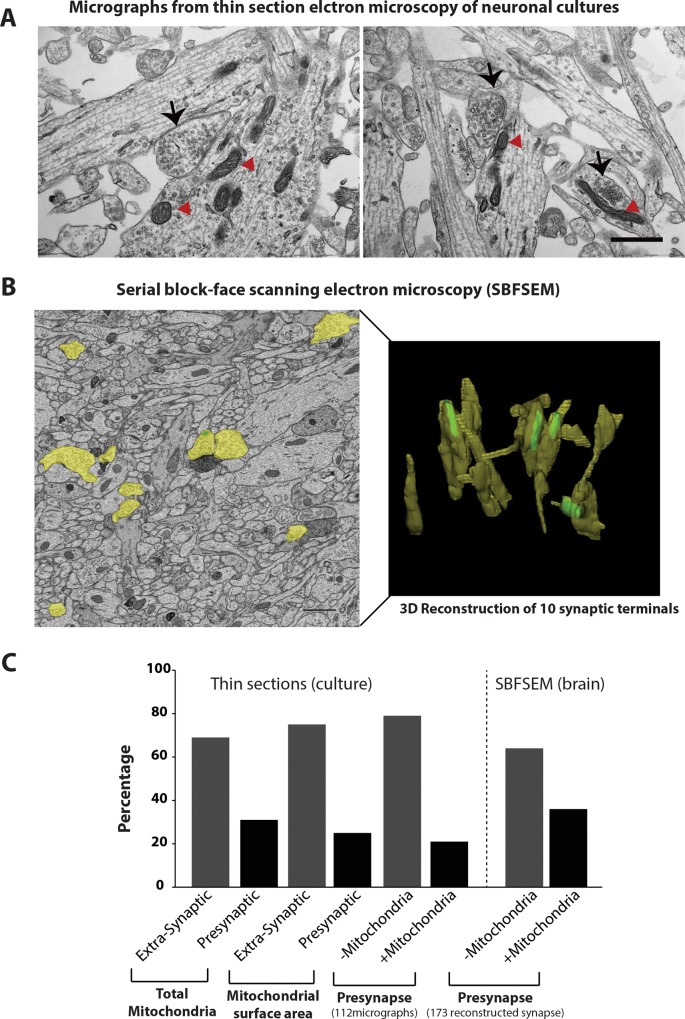
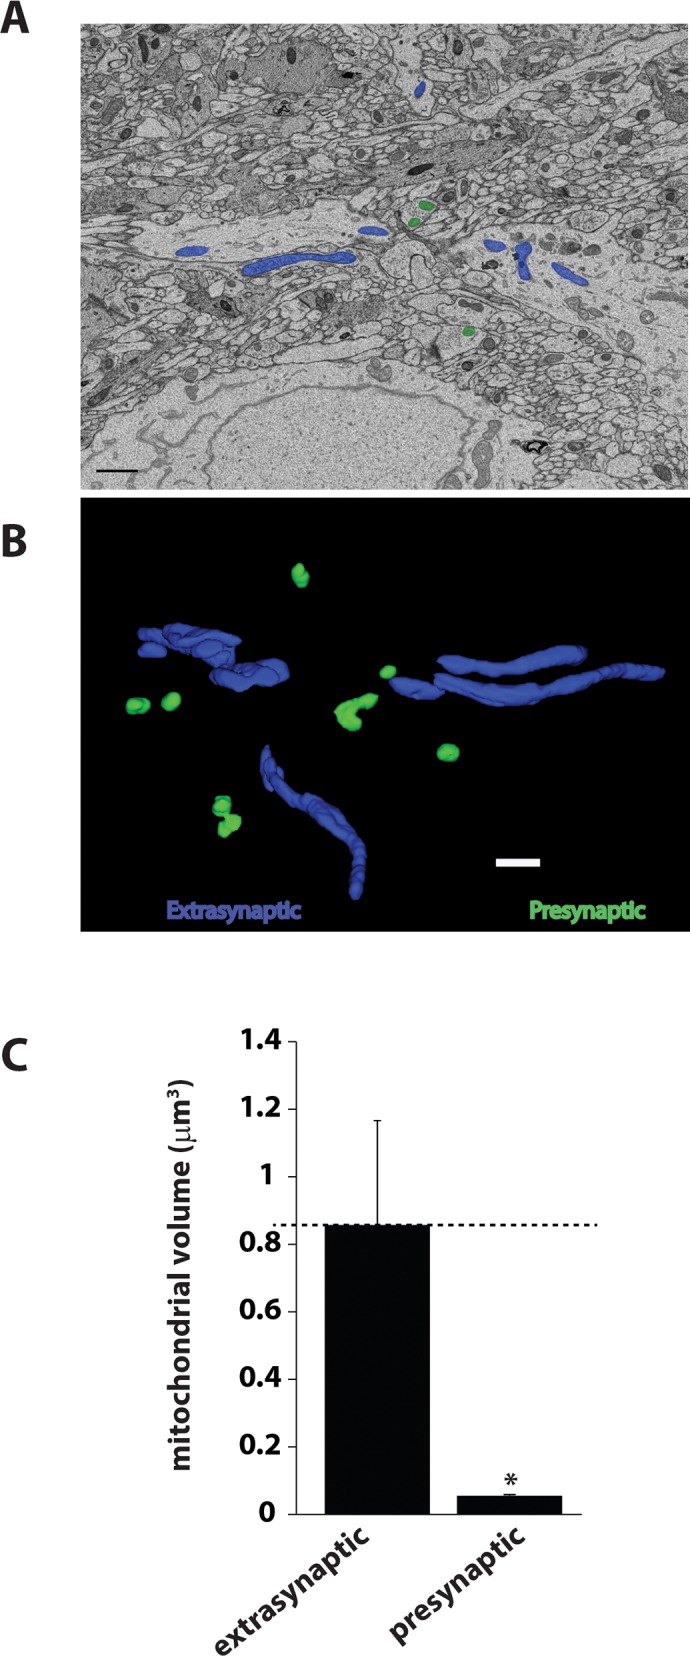
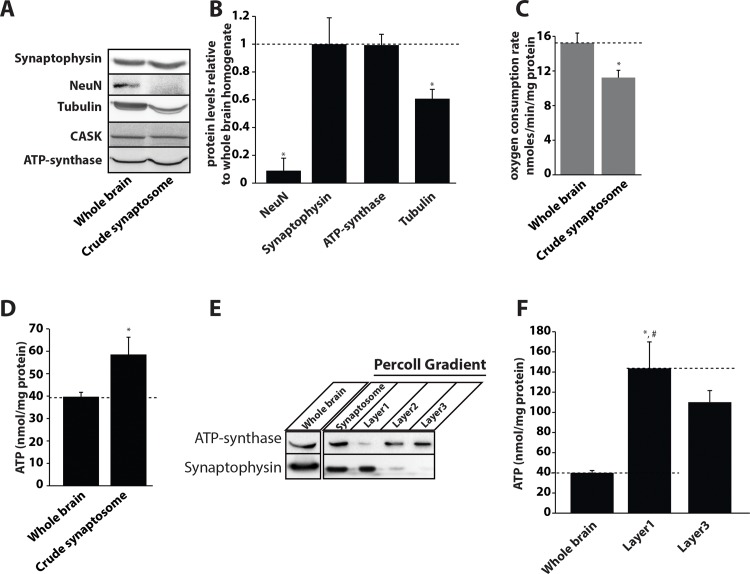
Synaptic neurotransmission is known to be an energy demanding process. At the presynapse, ATP is required for loading neurotransmitters into synaptic vesicles, for priming synaptic vesicles before release, and as a substrate for various kinases and ATPases. Although it is assumed that presynaptic sites usually harbor local mitochondria, which may serve as energy powerhouse to generate ATP as well as a presynaptic calcium depot, a clear role of presynaptic mitochondria in biochemical functioning of the presynapse is not well-defined. Besides a few synaptic subtypes like the mossy fibers and the Calyx of Held, most central presynaptic sites are either en passant or tiny axonal terminals that have little space to accommodate a large mitochondrion. Here, we have used imaging studies to demonstrate that mitochondrial antigens poorly co-localize with the synaptic vesicle clusters and active zone marker in the cerebral cortex, hippocampus and the cerebellum. Confocal imaging analysis on neuronal cultures revealed that most neuronal mitochondria are either somatic or distributed in the proximal part of major dendrites. A large number of synapses in culture are devoid of any mitochondria. Electron micrographs from neuronal cultures further confirm our finding that the majority of presynapses may not harbor resident mitochondria. We corroborated our ultrastructural findings using serial block face scanning electron microscopy (SBFSEM) and found that more than 60% of the presynaptic terminals lacked discernible mitochondria in the wild-type mice hippocampus. Biochemical fractionation of crude synaptosomes into mitochondria and pure synaptosomes also revealed a sparse presence of mitochondrial antigen at the presynaptic boutons. Despite a low abundance of mitochondria, the synaptosomal membranes were found to be highly enriched in ATP suggesting that the presynapse may possess alternative mechanism/s for concentrating ATP for its function. The potential mechanisms including local glycolysis and the possible roles of ATP-binding synaptic proteins such as synapsins, are discussed.


Conflict of interest statement

Competing Interests: The authors have declared that no competing interests exist.

Figures

Fig 1
Fig 1. Mitochondrial markers co-localizes poorly with synaptic markers in central presynapses.
A) Brain sections were stained with anti-synaptophysin (green), anti-ATP synthase β subunit (red) antibodies, and a nucleic acid Hoechst stain (blue). Images were acquired on an LSM 7 Zeiss confocal microscope. The number of red punctae overlapping with the green were quantified from 10 different sections using the Image J co-localization plugin and were estimated to be 31% ± 5% for cortex, 28% ± 3% for cerebellum and 35% ± 6% for hippocampus. Data are represented as mean ± SEM; n = 10. Representative images are from the cortex (layer 2/3), cerebellum (molecular layer) and hippocampus (stratum radiatum) as depicted; the scale bars are 15 μm. B) Brain sections were stained with anti-bassoon (green), anti-Fis1 (red) antibodies, and a nucleic acid Hoechst stain (blue). Images were acquired on an LSM 7 Zeiss confocal microscope. The number of red punctae overlapping with the green were quantified from 4 different sections using the Image J co-localization plugin and were estimated to be 29% ± 2.5% for cortex, 32% ± 6% for cerebellum and 32% ± 8% for hippocampus. Data are represented as mean ± SEM; n = 6. Representative images are from the cortex (layer 2/3), cerebellum (molecular layer) and hippocampus (stratum radiatum) as depicted. Examples of higher magnification are shown in S2 Fig.
Fig 2
Fig 2. Mitochondria are located predominantly in neuronal somata and primary dendrites.
A) Mixed cortical neurons were transduced with AAV-encoded GFP on the 12th DIV and immunostained for synaptophysin (a pre-synaptic marker) and ATP synthase β (a mitochondrial marker) on the 14th DIV. The left panel shows GFP (blue) and synaptophysin (green), the middle panel shows GFP (blue) and ATP synthase β subunit (red), and the right panel displays synaptophysin (green) and ATP synthase β subunit (red) respectively. The scale bars are 30 μm (top panel). B) The region in the white square in panel A is magnified, scale bar is 10 μm. Statistical analysis indicated that only ~ 25% ± 6% synaptophysin punctae co-localized with the ATP synthase β punctae; n = 3 cultures. C) Three dimensional construction of cultured cortical neurons co-expressing mCherry and mito-GFP plasmids. The scale bar is 40 μm. D) Representative image of collapsing growth cones that are devoid of mitochondria. The arrowheads indicate mitochondria and the white arrows point to collapsing growth cones. The scale bar is 5 μm. E) Quantification of the distribution of mitochondria in different regions of the neurons transfected with mito-GFP. Total mito-GFP pixels were quantified in the soma, the first 20 μm of primary dendrites and the rest of the neuron using Image J software. Graph displays mean value and the error bars depict SEM from n = 24. F) Low density cultures from Synapsin cre:stop tdTomato-Rosa mice. Pups were transduced with mito-GFP lentivirus at 7th DIV, cultures were fixed on 14th DIV and stained with a monoclonal antibody for bassoon. Confocal LSM was performed on the culture after mounting; scale bar = 40 μm. Correlation analysis indicated that ~ 23% ± 4% presynapses harbored mitochondria. G) A higher magnification image from the culture, white arrowheads indicate examples of presynapse without mitochondria. Scale bar = 10 μm. More examples of higher magnification images are also shown in S7 Fig.
Fig 3
Fig 3. Ultrastructural analysis revealed a low abundance of mitochondria at presynaptic terminals.
A) Mixed cortical cultures were fixed on the 14th DIV. The cultures were prepared for electron microscopy as described in the materials and methods section. Two representative micrographs used for analyzing the distribution of mitochondria are depicted. Black arrows point to the presynaptic terminals with synaptic vesicles, red arrow head indicates the mitochondria observed at these nerve terminals. B) Serial block face scanning electron microscopy or SBFSEM analysis from hippocampi of P15 wild-type mice. Left panel depicts a representative 2D ultramicrograph from the dataset (scale bar = 1000 nm); right panel depicts 3D reconstruction of 10 presynaptic terminals. Only four out of 10 presynaptic terminals showed discernible mitochondria. C) Histograms showing quantitation from 112 micrographs obtained from thin section TEM analyzed using the Image J program and from 173 reconstructed presynaptic terminals obtained by SBFSEM and analyzed using the TRAKEM2 software.
Fig 4
Fig 4. Presynaptic mitochondria are relatively small in volume compared to somatic mitochondria.
A) Representative 2D image from the SBFSEM dataset showing extrasynaptic mitochondria in blue and presynaptic mitochondria in green. B) 3D reconstructions of presynaptic and extrasynaptic mitochondria using TRAKEM2 software. Scale bar = 1000 nm. C) Bar graph depicting the volume of extrasynaptic and presynaptic mitochondria. Data are plotted as mean ± SEM. n = 3 different sets.
Fig 5
Fig 5. Neuronal presynapses are highly enriched in ATP.
A) Immunoblots from whole brain and crude synaptosomal fractions detected with the specified antibodies. B) Relative protein quantification from three different synaptosomal preparations compared to the whole brain. (Absolute value for whole brain is depicted as 1). Data are plotted as mean ± SEM. C) Mitochondrial oxygen consumption rate in crude synaptosomes and whole brain homogenates. Total oxygen consumption was normalized to the protein levels in both fractions. D) Total ATP levels in crude synaptosomes and whole brain normalized to the protein concentrations in each fraction. E) Percoll density gradient separation of mitochondrial and synaptosomal fractions. Synaptophysin was used as a marker for synaptosomes and ATP synthase β-subunit was used as a marker for mitochondria. F) Total ATP levels detected in the whole brain homogenate, synaptosomal and mitochondrial membrane-rich fractions obtained from the Percoll density gradient method. Data were normalized to total protein levels in each fraction and plotted as mean ± SEM.

References

    1. Mink JW, Blumenschine RJ, Adams DB. Ratio of central nervous system to body metabolism in vertebrates: its constancy and functional basis. Am J Physiol. 1981;241(3):R203–12. - PubMed
    1. Aiello LC, Wheeler P. The expensive tissue hypothesis: the brain and the digestive system in human and primate evolution. Curr Anthropol. 1995;36:199–221.
    1. Liotta A, Rosner J, Huchzermeyer C, Wojtowicz A, Kann O, Schmitz D, et al. Energy demand of synaptic transmission at the hippocampal Schaffer-collateral synapse. J Cereb Blood Flow Metab. 2012;32(11):2076–83. 10.1038/jcbfm.2012.116 - DOI - PMC - PubMed
    1. Palay SL. Synapses in the central nervous system. J Biophys Biochem Cytol. 1956;2(4 Suppl):193–202. - PMC - PubMed
    1. Hajos F, Kerpel-Fronius S. Electron microscope histochemical evidence for a partial or total block of the tricarboxylic acid cycle in the mitochondria of presynaptic axon terminals. J Cell Biol. 1971;51(1):216–22. - PMC - PubMed

Substances