. 2015 Apr 17:16:122.
doi: 10.1186/s12859-015-0557-5.

ContextMap 2: fast and accurate context-based RNA-seq mapping

Affiliations

ContextMap 2: fast and accurate context-based RNA-seq mapping

Thomas Bonfert et al. BMC Bioinformatics. .

Abstract

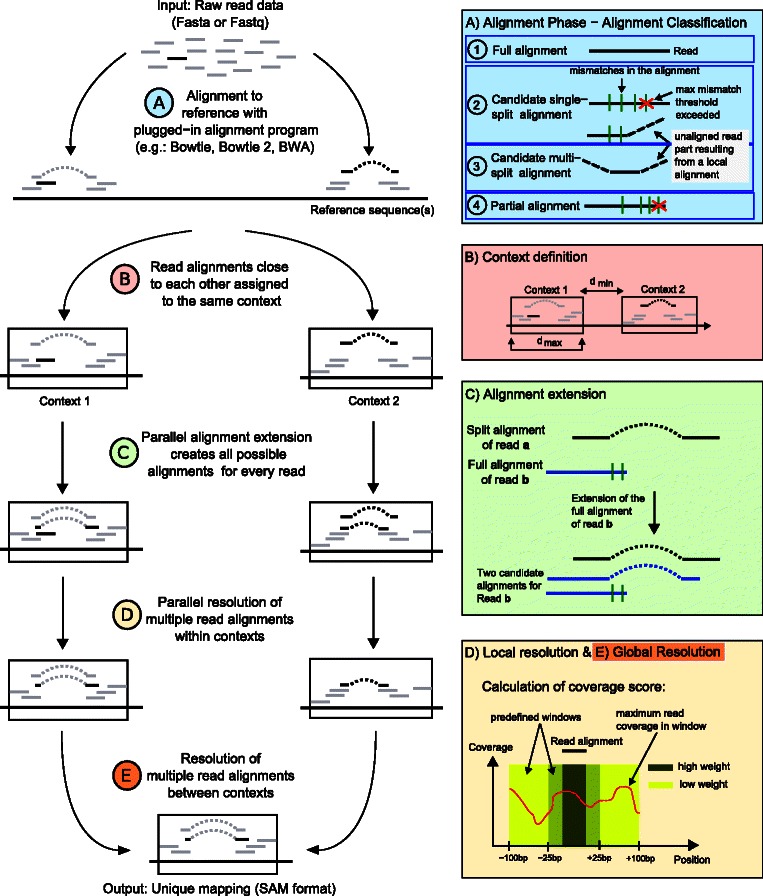
Background: Mapping of short sequencing reads is a crucial step in the analysis of RNA sequencing (RNA-seq) data. ContextMap is an RNA-seq mapping algorithm that uses a context-based approach to identify the best alignment for each read and allows parallel mapping against several reference genomes.

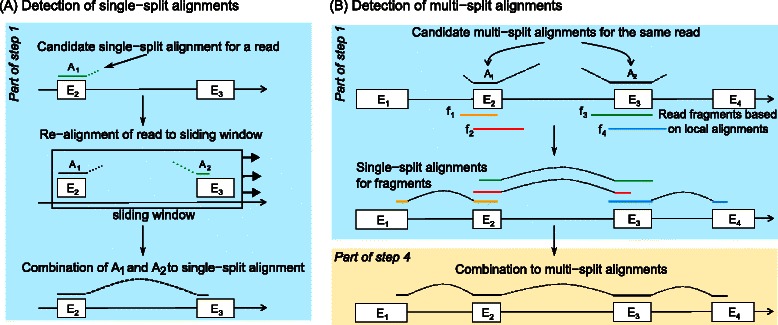
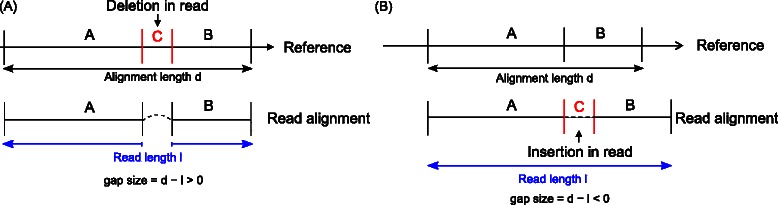
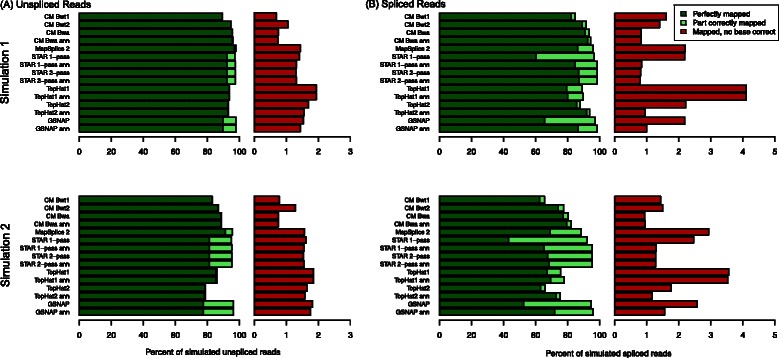
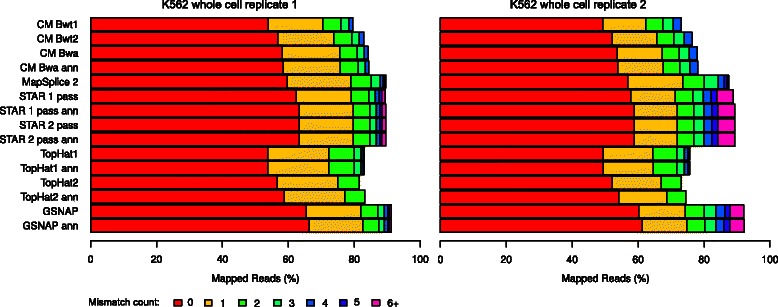
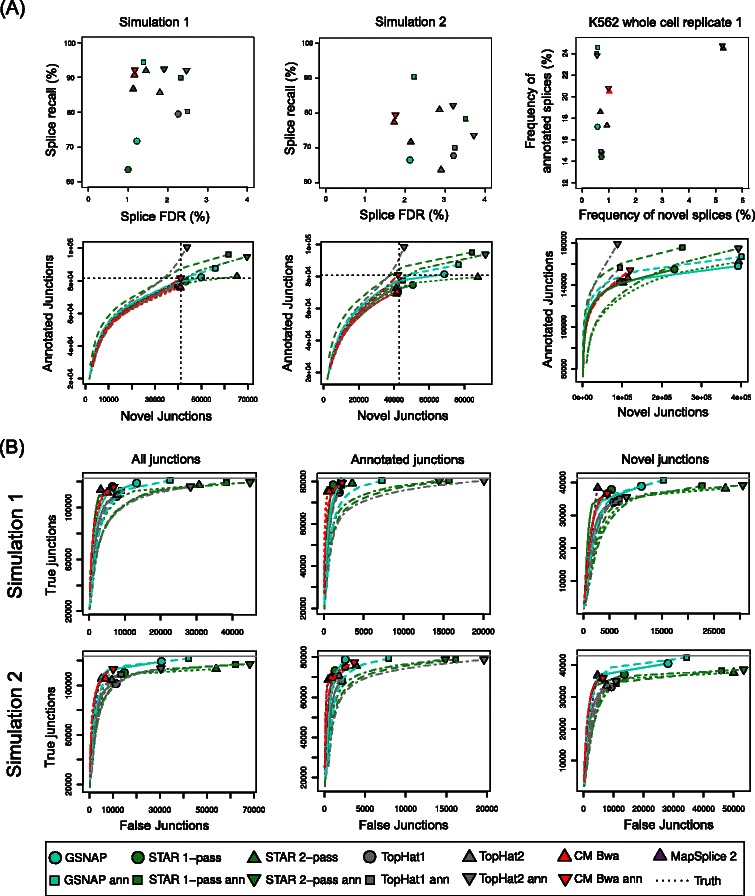
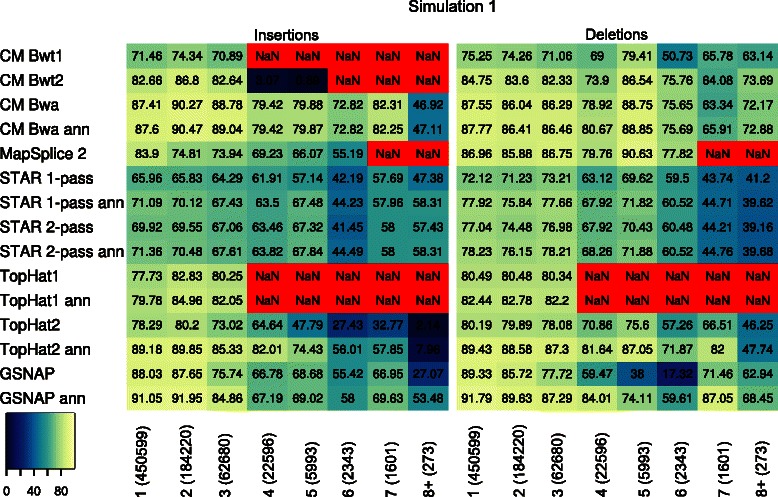
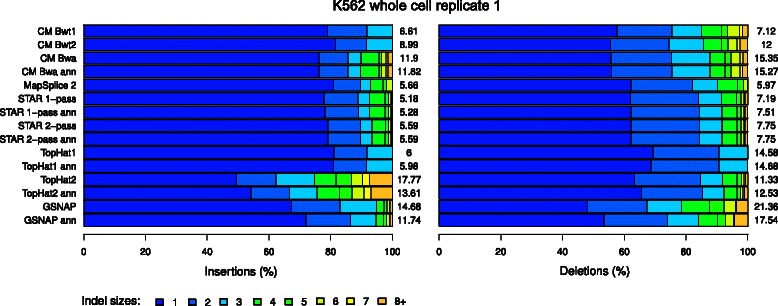
Results: In this article, we present ContextMap 2, a new and improved version of ContextMap. Its key novel features are: (i) a plug-in structure that allows easily integrating novel short read alignment programs with improved accuracy and runtime; (ii) context-based identification of insertions and deletions (indels); (iii) mapping of reads spanning an arbitrary number of exons and indels. ContextMap 2 using Bowtie, Bowtie 2 or BWA was evaluated on both simulated and real-life data from the recently published RGASP study.

Conclusions: We show that ContextMap 2 generally combines similar or higher recall compared to other state-of-the-art approaches with significantly higher precision in read placement and junction and indel prediction. Furthermore, runtime was significantly lower than for the best competing approaches. ContextMap 2 is freely available at http://www.bio.ifi.lmu.de/ContextMap .


Figures

Figure 1
Figure 1
Workflow of ContextMap 2.(A) Reads are aligned to the reference sequence(s) using the integrated short read alignment program and the resulting alignments are classified into 4 different categories (top box, right side: full alignment, candidate single-split alignment, candidate multi-split alignment, and partial alignment). Dashed lines indicate unaligned sequence parts resulting from local alignments. Candidate single- and multi-split alignments are extended to split alignments using the sliding window approach (Figure 2). (B) Alignments less than d min apart are assigned to the same context. The maximum context size d max can be defined by the user (default is the average length of a mammalian mRNA). (C) Alignment extension of full (green box) and split alignments (see Additional file 1: Supplementary methods) to determine all valid alignments for a read. (D) + (E) Resolution of the best alignment for each read first within each context (D, local resolution) and then between all contexts (E, global resolution). For this purpose, a support score is calculated based on closely located alignments of other reads (bottom box, right side, and Additional file 1: Supplementary methods).
Figure 2
Figure 2
Detection of single-split and multi-split alignments in ContextMap 2.(A) Detection of single-split alignments as part of step 1. First, reads are aligned to the genome and candidate split alignments (A 1) are identified. Second, reads with candidate split alignments are re-aligned within a window around the initial alignment to determine a completing alignment (A 2). The use of smaller seed lengths than in the initial alignment allows recovering completing alignments shorter than the seed length used for the initial alignment. Finally, the alignments are combined to a complete split alignment. (B) Detection of multi-split alignments. For every candidate multi-split alignment, ContextMap 2 creates two fragments of the respective read sequence (i.e. f 1 and f 2 for A 1 and f 3 and f 4 for A 2). Subsequently, single-split alignments are detected for these fragments. Finally, overlaps of single-split alignments are combined to obtain a complete multi-split alignment after first identifying the best splice site for each split alignment as part of the resolution of overlapping splice sites in step 4 of ContextMap 2.
Figure 3
Figure 3
Deletions and insertions in reads as special cases of spliced reads.(A) Example of a read with a deletion compared to the reference sequence. In this case, the alignment length d is larger than the read length l and the gap size is positive. (B) Example of a read with an insertion compared to the reference sequence. Here, the alignment length d on the reference sequence is smaller than the read length l and the gap size is negative.
Figure 4
Figure 4
Fraction of perfectly mapped, part correctly mapped and incorrectly mapped reads for simulated unspliced (A) and spliced (B) reads of simulation 1 and 2, respectively. “CM Bwt1”, “CM Bwt2”, “CM Bwa” denote ContextMap 2 used with Bowtie, Bowtie 2, and BWA as underlying alignment program, respectively. If a gene annotation was provided, “ann” was added to the name of the respective program.
Figure 5
Figure 5
Percentage of mapped reads and mismatch distribution for the mapped reads for both replicates of the K562 whole cell RNA-seq samples. Results for all real-life samples are shown in Additional file 1: Figure S4.
Figure 6
Figure 6
Evaluation of splice junction prediction.(A) Comparison of splice recall (y-axis) versus splice false discovery rate (FDR=1-precision, x-axis) on simulation 1 and 2 (see equations 2 and 3 for definitions). For the human data sets, the frequency of predicted novel splices was compared to the frequency of annotated splices for the Ensembl annotation (see text for definitions, Additional file 1: Figure S5 for results for all real-life data sets). Furthermore, the number of identified annotated and novel junctions was evaluated (see Additional file 1: Figure S6 for results for all data sets). To obtain receiver operation characteristic (ROC)-like curves, numbers were also calculated at increasing thresholds on the number of supporting reads for each junction. (B) Number of correctly predicted (true) and incorrectly (false) junctions were compared for all junctions and annotated and novel junctions separately. In contrast to the RGASP evaluation, we also included junctions covered by only 1 read. ROC-like curves were calculated as in A. (A-B) For ContextMap 2 only results using BWA are shown, results for Bowtie and Bowtie 2 can be found in Additional file 1: Figures S5 and S6 (for A) and S7 (for B).
Figure 7
Figure 7
F-Measure [in %] for insertion and deletions identified by all programs on simulation 1. NaN indicates that no insertion or deletion of that size was identified. Insertion and deletion size are shown below each column of the heatmap. The numbers in parentheses indicate the number of simulated reads for each insertion or deletion size. Results for simulation 2 are shown in Additional file 1: Figure S8. Recall and precision values are listed in Additional file 1: Tables S6 and S7.
Figure 8
Figure 8
Fraction of mapped reads with different indel sizes among all reads with indels for the first replicate of the K562 whole cell sample. Numbers next to the barplots indicate the number of mapped reads with indels divided by 105 (i.e. number of reads per 100,000). Results for all samples are shown in Additional file 1: Figures S9 and S10.

References

    1. Wang Z, Gerstein M, Snyder M. RNA-Seq: a revolutionary tool for transcriptomics. Nat Rev Genet. 2009;10(1):57–63. doi: 10.1038/nrg2484. - DOI - PMC - PubMed
    1. Ozsolak F, Milos PM. RNA sequencing: advances, challenges and opportunities. Nat Rev Genet. 2011;12(2):87–98. doi: 10.1038/nrg2934. - DOI - PMC - PubMed
    1. Garber M, Grabherr MG, Guttman M, Trapnell C. Computational methods for transcriptome annotation and quantification using RNA-seq. Nat Methods. 2011;8(6):469–77. doi: 10.1038/nmeth.1613. - DOI - PubMed
    1. Djebali S, Davis CA, Merkel A, Dobin A, Lassmann T, Mortazavi A, et al. Landscape of transcription in human cells. Nature. 2012;489(7414):101–8. doi: 10.1038/nature11233. - DOI - PMC - PubMed
    1. Langmead B, Trapnell C, Pop M, Salzberg SL. Ultrafast and memory-efficient alignment of short DNA sequences to the human genome. Genome Biol. 2009;10(3):25. doi: 10.1186/gb-2009-10-3-r25. - DOI - PMC - PubMed

Publication types