. 2015 Apr 28;16(1):130.
doi: 10.1186/s12859-015-0566-4.

Elviz - exploration of metagenome assemblies with an interactive visualization tool

Affiliations

Elviz - exploration of metagenome assemblies with an interactive visualization tool

Michael Cantor et al. BMC Bioinformatics. .

Abstract

Background: Metagenomics, the sequencing of DNA collected from an entire microbial community, enables the study of natural microbial consortia in their native habitats. Metagenomics studies produce huge volumes of data, including both the sequences themselves and metadata describing their abundance, assembly, predicted functional characteristics and environmental parameters. The ability to explore these data visually is critically important to meaningful biological interpretation. Current genomics applications cannot effectively integrate sequence data, assembly metadata, and annotation to support both genome and community-level inquiry.

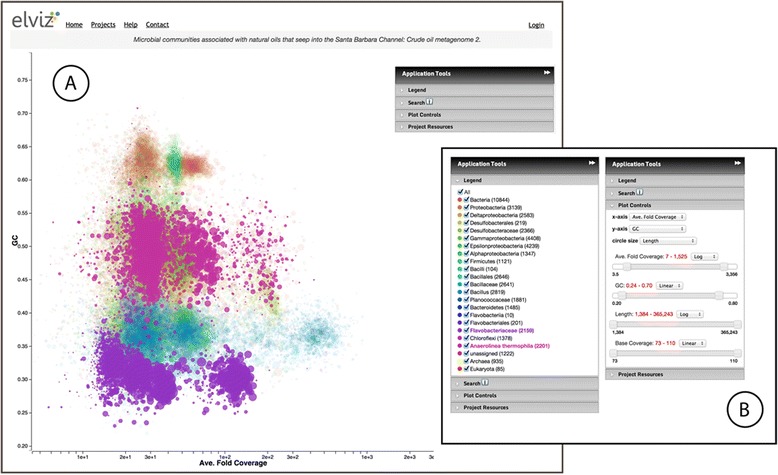
Results: Elviz (Environmental Laboratory Visualization) is an interactive web-based tool for the visual exploration of assembled metagenomes and their complex metadata. Elviz allows scientists to navigate metagenome assemblies across multiple dimensions and scales, plotting parameters such as GC content, relative abundance, phylogenetic affiliation and assembled contig length. Furthermore Elviz enables interactive exploration using real-time plot navigation, search, filters, axis selection, and the ability to drill from a whole-community profile down to individual gene annotations. Thus scientists engage in a rapid feedback loop of visual pattern identification, hypothesis generation, and hypothesis testing.

Conclusions: Compared to the current alternative of generating a succession of static figures, Elviz can greatly accelerate the speed of metagenome analysis. Elviz can be used to explore both user-submitted datasets and numerous metagenome studies publicly available at the Joint Genome Institute (JGI). Elviz is freely available at http://genome.jgi.doe.gov/viz and runs on most current web-browsers.


Figures

Figure 1
Figure 1
The Elviz interface. A. The bubble-plot displays assembled contigs. The floating “Application Tools” panel in the upper right controls plotting parameters. B. “Application Tools” are shown with two different panels expanded. The Legend Panel (Figure 1B left) controls the coloring and highlighting of different data groups in the plot. Here, contigs predicted to belong to Flavobacteriaceae and Anaerolinea thermophilia are highlighted. The Plot Controls panel (Figure 1B right) controls axis selection, plot navigation, and data filtering.
Figure 2
Figure 2
Exploring individual contigs. A. When the mouse moves over contig_11 in the plot, a panel appears showing all of the metadata for this contig. B. Clicking on the contig brings up the Contig Detail Viewer. Here the user can explore gene annotations on the contig, navigating with the slider at the top of the panel. Red and black glyphs represent predicted gene models in forward and reverse orientation respectively. The yellow-filled gene model is currently selected. Details for this annotation appear in tabular form, including the feature name and position, and predicted COG and Pfam classifications.
Figure 3
Figure 3
Elviz search. A. Contigs containing one or more of eight PFAM domains from the mtr gene (see text, Section 2.3) are identified using search, appearing as solid circles ringed in black. Point color still represents predicted phylogeny (see Figure 1B, left) creating a ready visual indication of the distribution of search results across taxa in the sample. B. Because “Emphasize mode” is checked, contigs containing search terms are emphasized and others de-emphasized. C. D. Search result tables present the distribution of contigs with hits across taxa and a count of hits within each contig.

References

    1. Beja O, Spudich EN, Spudich JL, Leclerc M, DeLong EF. Proteorhodopsin phototrophy in the ocean. Nature. 2001;411(6839):786–9. doi: 10.1038/35081051. - DOI - PubMed
    1. Hess M, Sczyrba A, Egan R, Kim TW, Chokhawala H, Schroth G, et al. Metagenomic discovery of biomass-degrading genes and genomes from cow rumen. Science. 2011;331(6016):463–7. doi: 10.1126/science.1200387. - DOI - PubMed
    1. Warnecke F, Luginbuhl P, Ivanova N, Ghassemian M, Richardson TH, Stege JT, et al. Metagenomic and functional analysis of hindgut microbiota of a wood-feeding higher termite. Nature. 2007;450(7169):560–5. doi: 10.1038/nature06269. - DOI - PubMed
    1. Hemme CL, Deng Y, Gentry TJ, Fields MW, Wu L, Barua S, et al. Metagenomic insights into evolution of a heavy metal-contaminated groundwater microbial community. ISME J. 2010;4(5):660–72. doi: 10.1038/ismej.2009.154. - DOI - PubMed
    1. Mason OU, Hazen TC, Borglin S, Chain PS, Dubinsky EA, Fortney JL, et al. Metagenome, metatranscriptome and single-cell sequencing reveal microbial response to Deepwater Horizon oil spill. ISME J. 2012;6(9):1715–27. doi: 10.1038/ismej.2012.59. - DOI - PMC - PubMed

Publication types