

A two-gene blood test for methylated DNA sensitive for colorectal cancer
- PMID: 25928810
- PMCID: PMC4416022
- DOI: 10.1371/journal.pone.0125041
A two-gene blood test for methylated DNA sensitive for colorectal cancer
Abstract
Background: Specific genes are methylated with high frequency in colorectal neoplasia, and may leak into blood. Detection of multiple methylated DNA biomarkers in blood may improve assay sensitivity for colorectal cancer (CRC) relative to a single marker. We undertook a case-control study evaluating the presence of two methylation DNA markers, BCAT1 and IKZF1, in circulation to determine if they were complementary for detection of CRC.
Methods: Methylation-specific PCR assays were developed to measure the level of methylated BCAT1 and IKZF1 in DNA extracted from plasma obtained from colonoscopy-confirmed 144 healthy controls and 74 CRC cases.
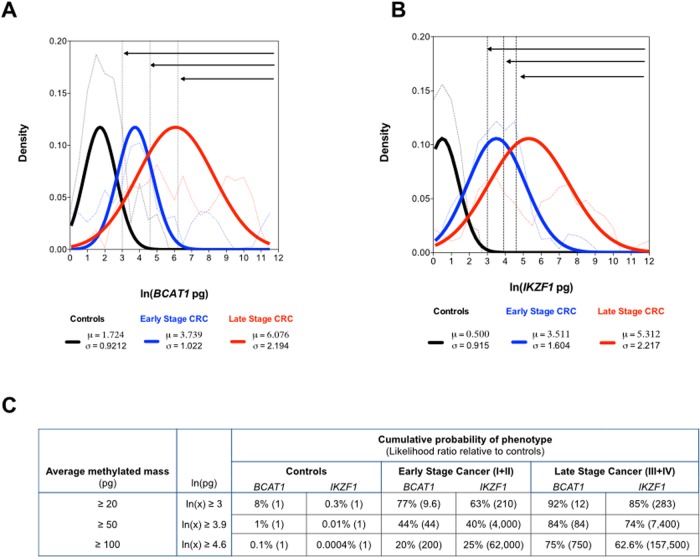
Results: DNA yields ranged from 2 to 730 ng/mL plasma (mean 18.6ng/mL; 95% CI 11-26 ng/mL) and did not correlate with gender, age or CRC status. Methylated BCAT1 and IKZF1 DNA were detected in respectively 48 (65%) and 50 (68%) of the 74 cancers. In contrast, only 5 (4%) and 7 (5%) controls were positive for BCAT1 and IKZF1 DNA methylation, respectively. A two-gene classifier model ("either or" rule) improved segregation of CRC from controls, with 57 of 74 cancers (77%) compared to only 11 of 144 (7.6%) controls being positive for BCAT1 and/or IKZF1 DNA methylation. Increasing levels of methylated DNA were observed as CRC stage progressed.
Conclusions: Detection of methylated BCAT1 and/or IKZF1 DNA in plasma may have clinical application as a novel blood test for CRC. Combining the results from the two methylation-specific PCR assays improved CRC detection with minimal change in specificity. Further validation of this two-gene blood test with a view to application in screening is now indicated.
Conflict of interest statement
Figures


Similar articles
-
Evaluation of an assay for methylated BCAT1 and IKZF1 in plasma for detection of colorectal neoplasia.BMC Cancer. 2015 Oct 6;15:654. doi: 10.1186/s12885-015-1674-2. BMC Cancer. 2015. PMID: 26445409 Free PMC article.
-
Circulating tumour DNA for monitoring colorectal cancer-a prospective cohort study to assess relationship to tissue methylation, cancer characteristics and surgical resection.Clin Epigenetics. 2018 May 16;10:63. doi: 10.1186/s13148-018-0500-5. eCollection 2018. Clin Epigenetics. 2018. PMID: 29796114 Free PMC article. Clinical Trial.
-
Evaluation of a panel of tumor-specific differentially-methylated DNA regions in IRF4, IKZF1 and BCAT1 for blood-based detection of colorectal cancer.Clin Epigenetics. 2021 Jan 21;13(1):14. doi: 10.1186/s13148-020-00999-y. Clin Epigenetics. 2021. PMID: 33478584 Free PMC article.
-
Stool DNA methylation assays in colorectal cancer screening.World J Gastroenterol. 2015 Sep 21;21(35):10057-61. doi: 10.3748/wjg.v21.i35.10057. World J Gastroenterol. 2015. PMID: 26401070 Free PMC article. Review.
-
Value of methylation markers in colorectal cancer (Review).Oncol Rep. 2021 Aug;46(2):177. doi: 10.3892/or.2021.8128. Epub 2021 Jul 2. Oncol Rep. 2021. PMID: 34212989 Review.
Cited by
-
Using Circulating Tumor DNA as a Novel Biomarker to Screen and Diagnose Colorectal Cancer: A Meta-Analysis.J Clin Med. 2023 Jan 4;12(2):408. doi: 10.3390/jcm12020408. J Clin Med. 2023. PMID: 36675337 Free PMC article.
-
DNA methylation detection methods used in colorectal cancer.World J Clin Cases. 2019 Oct 6;7(19):2916-2929. doi: 10.12998/wjcc.v7.i19.2916. World J Clin Cases. 2019. PMID: 31624740 Free PMC article. Review.
-
Diagnostic value of methylated branched chain amino acid transaminase 1/IKAROS family zinc finger 1 for colorectal cancer.World J Gastroenterol. 2023 Sep 28;29(36):5240-5253. doi: 10.3748/wjg.v29.i36.5240. World J Gastroenterol. 2023. PMID: 37901447 Free PMC article.
-
COBRA-Seq: Sensitive and Quantitative Methylome Profiling.Genes (Basel). 2015 Oct 23;6(4):1140-63. doi: 10.3390/genes6041140. Genes (Basel). 2015. PMID: 26512698 Free PMC article.
-
Evaluation of Methylation Biomarkers for Detection of Circulating Tumor DNA and Application to Colorectal Cancer.Genes (Basel). 2016 Dec 15;7(12):125. doi: 10.3390/genes7120125. Genes (Basel). 2016. PMID: 27983717 Free PMC article.
References
-
- Osborne JM. Sample preference for colorectal cancer screening tests: Blood or stool? OJPM. 2012;2(3):326–31.
-
- Hundt S, Haug U, Brenner H. Blood markers for early detection of colorectal cancer: a systematic review. Cancer Epidemiol Biomarkers Prev. 2007;16(10):1935–53. - PubMed
Publication types
MeSH terms
Substances
LinkOut - more resources
Full Text Sources
Other Literature Sources
Medical
