

Toward high-throughput phenotyping: unbiased automated feature extraction and selection from knowledge sources
- PMID: 25929596
- PMCID: PMC4986664
- DOI: 10.1093/jamia/ocv034
Toward high-throughput phenotyping: unbiased automated feature extraction and selection from knowledge sources
Abstract
Objective: Analysis of narrative (text) data from electronic health records (EHRs) can improve population-scale phenotyping for clinical and genetic research. Currently, selection of text features for phenotyping algorithms is slow and laborious, requiring extensive and iterative involvement by domain experts. This paper introduces a method to develop phenotyping algorithms in an unbiased manner by automatically extracting and selecting informative features, which can be comparable to expert-curated ones in classification accuracy.
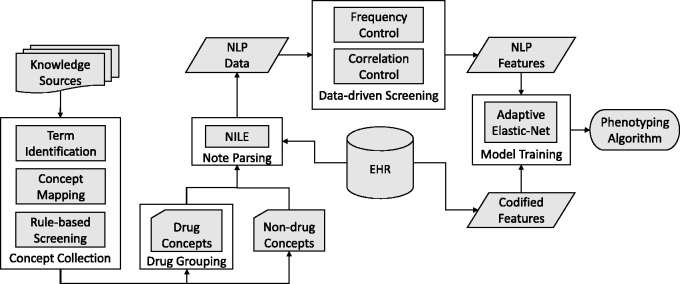
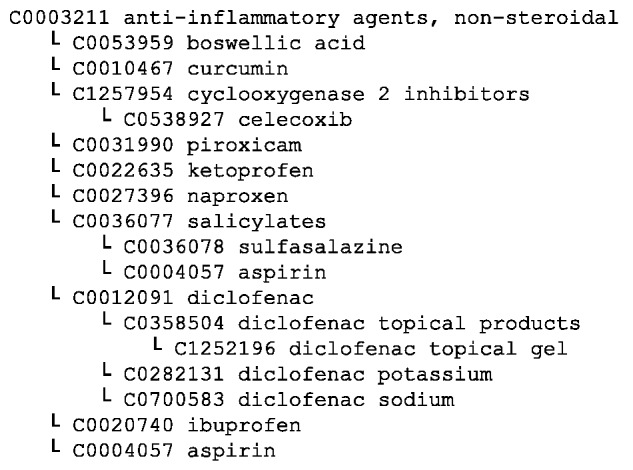
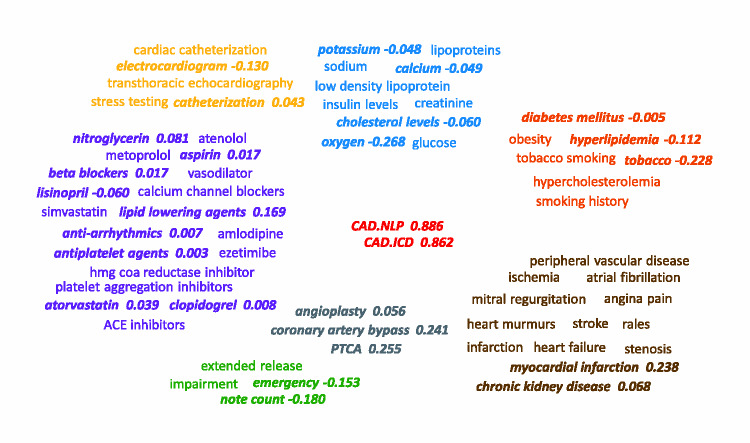
Materials and methods: Comprehensive medical concepts were collected from publicly available knowledge sources in an automated, unbiased fashion. Natural language processing (NLP) revealed the occurrence patterns of these concepts in EHR narrative notes, which enabled selection of informative features for phenotype classification. When combined with additional codified features, a penalized logistic regression model was trained to classify the target phenotype.
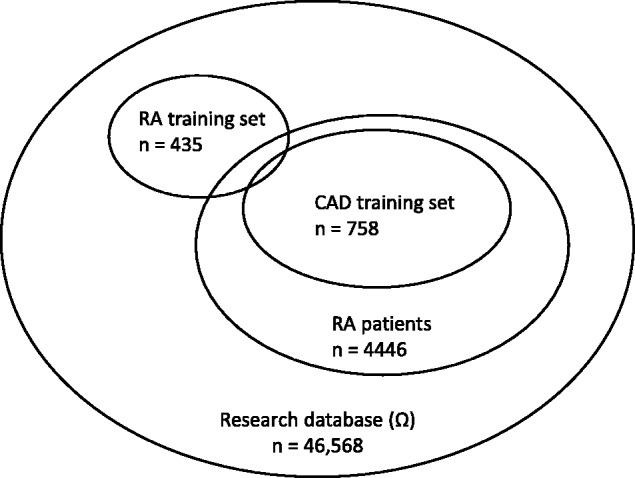
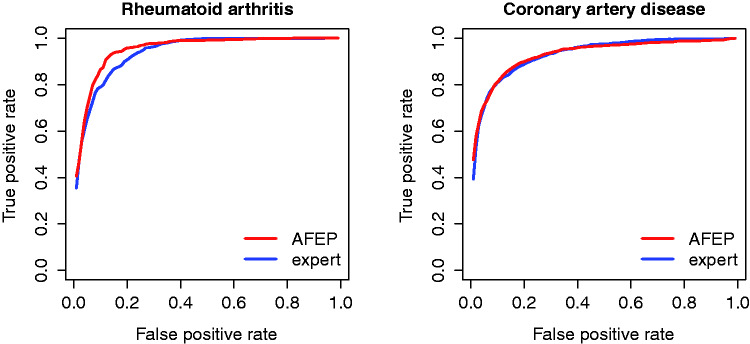
Results: The authors applied our method to develop algorithms to identify patients with rheumatoid arthritis and coronary artery disease cases among those with rheumatoid arthritis from a large multi-institutional EHR. The area under the receiver operating characteristic curves (AUC) for classifying RA and CAD using models trained with automated features were 0.951 and 0.929, respectively, compared to the AUCs of 0.938 and 0.929 by models trained with expert-curated features.
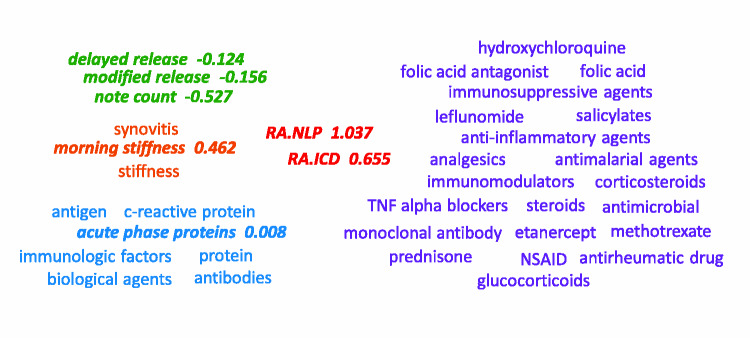
Discussion: Models trained with NLP text features selected through an unbiased, automated procedure achieved comparable or slightly higher accuracy than those trained with expert-curated features. The majority of the selected model features were interpretable.
Conclusion: The proposed automated feature extraction method, generating highly accurate phenotyping algorithms with improved efficiency, is a significant step toward high-throughput phenotyping.
© The Author 2015. Published by Oxford University Press on behalf of the American Medical Informatics Association. All rights reserved. For Permissions, please email: journals.permissions@oup.com.
Figures
References
-
- Charles D, Gabriel M, Furukawa MF. Adoption of electronic health record systems among us non-federal acute care hospitals: 2008-2013. 2014. http://healthit.gov/sites/default/files/oncdatabrief16.pdf. Accessed August 15, 2014.
-
- Ryan PB, Madigan D, Stang PE, et al. Empirical assessment of methods for risk identification in healthcare data: results from the experiments of the Observational Medical Outcomes Partnership. Stat Med. 2012;31:4401–4415. - PubMed
-
- Masica AL, Ewen E, Daoud YA, et al. Comparative effectiveness research using electronic health records: impacts of oral antidiabetic drugs on the development of chronic kidney disease. Pharmacoepidemiol Drug Saf. 2013;22:413–422. - PubMed
Publication types
MeSH terms
Grants and funding
LinkOut - more resources
Full Text Sources
Other Literature Sources
Miscellaneous
