

Phenotypic switch of CD8(+) T cells reactivated under hypoxia toward IL-10 secreting, poorly proliferative effector cells
- PMID: 25929785
- PMCID: PMC7163737
- DOI: 10.1002/eji.201445284
Phenotypic switch of CD8(+) T cells reactivated under hypoxia toward IL-10 secreting, poorly proliferative effector cells
Abstract
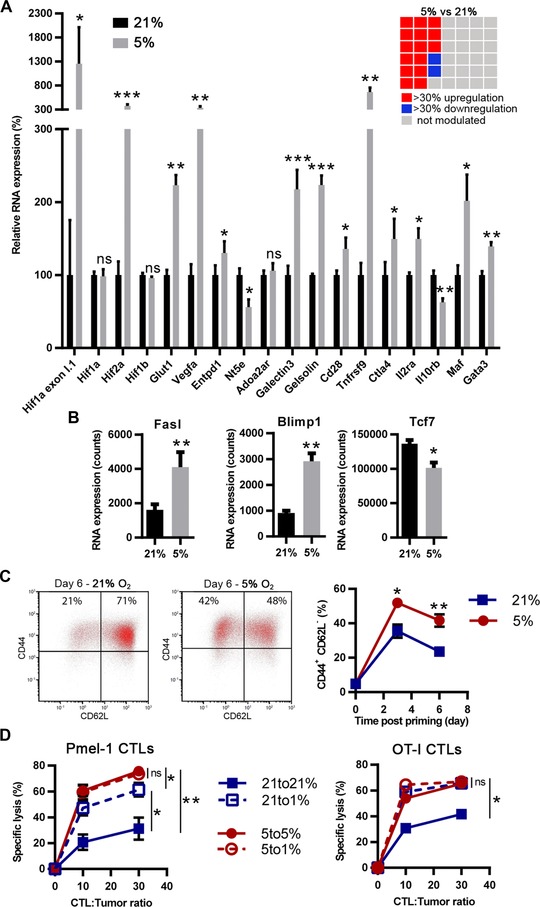
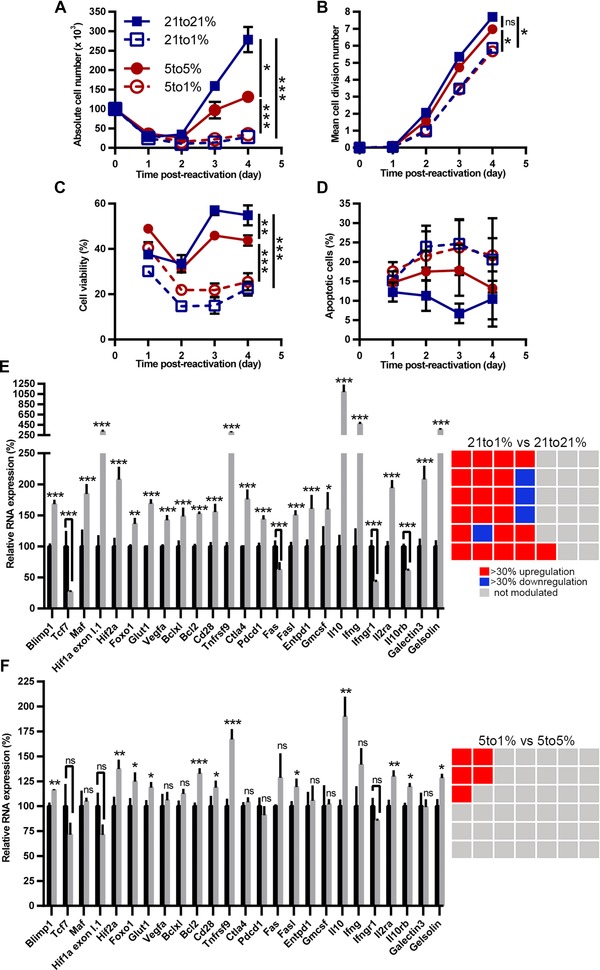
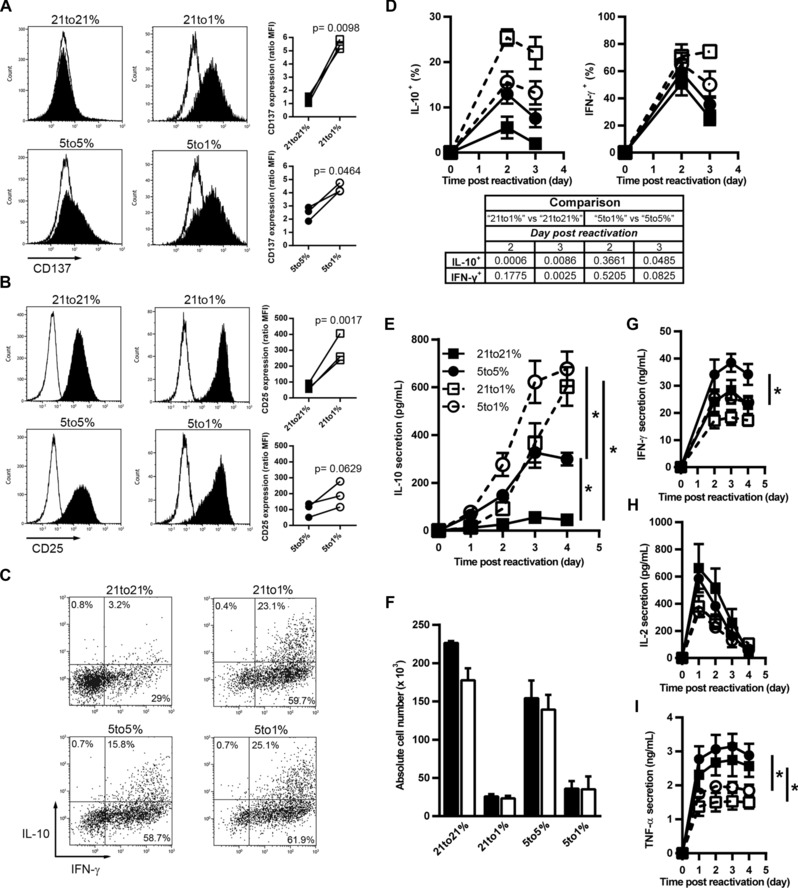
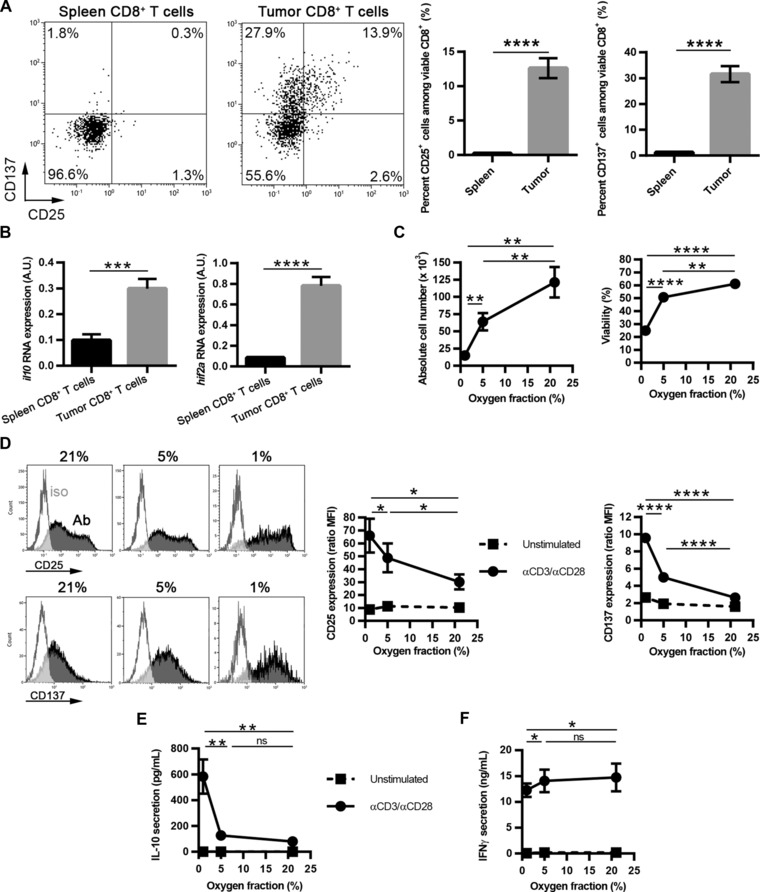
CD8(+) T cells controlling pathogens or tumors must function at sites where oxygen tension is frequently low, and never as high as under atmospheric culture conditions. However, T-cell function in vivo is generally analyzed indirectly, or is extrapolated from in vitro studies under nonphysiologic oxygen tensions. In this study, we delineate the role of physiologic and pathologic oxygen tension in vitro during reactivation and differentiation of tumor-specific CD8(+) T cells. Using CD8(+) T cells from pmel-1 mice, we observed that the generation of CTLs under 5% O2, which corresponds to physioxia in lymph nodes, gave rise to a higher effector signature than those generated under atmospheric oxygen fractions (21% O2). Hypoxia (1% O2) did not modify cytotoxicity, but decreasing O2 tensions during CTL and CD8(+) tumor-infiltrating lymphocyte reactivation dose-dependently decreased proliferation, induced secretion of the immunosuppressive cytokine IL-10, and upregulated the expression of CD137 (4-1BB) and CD25. Overall, our data indicate that oxygen tension is a key regulator of CD8(+) T-cell function and fate and suggest that IL-10 release may be an unanticipated component of CD8(+) T cell-mediated immune responses in most in vivo microenvironments.
Keywords: CD8+ T cell; Hypoxia; IL-10; Oxygen; T-cell reactivation.
© 2015 WILEY-VCH Verlag GmbH & Co. KGaA, Weinheim.
Conflict of interest statement
The authors declare no financial or commercial conflict of interest.
Figures
Similar articles
-
CD134 Costimulation Couples the CD137 Pathway to Induce Production of Supereffector CD8 T Cells That Become IL-7 Dependent.J Immunol. 2007 Aug 15;179(4):2203-14. doi: 10.4049/jimmunol.179.4.2203. J Immunol. 2007. PMID: 17675480
-
CD137 Plays Both Pathogenic and Protective Roles in Type 1 Diabetes Development in NOD Mice.J Immunol. 2017 May 15;198(10):3857-3868. doi: 10.4049/jimmunol.1601851. Epub 2017 Mar 31. J Immunol. 2017. PMID: 28363905 Free PMC article.
-
Differential effects of physiologically relevant hypoxic conditions on T lymphocyte development and effector functions.J Immunol. 2001 Dec 1;167(11):6140-9. doi: 10.4049/jimmunol.167.11.6140. J Immunol. 2001. PMID: 11714773
-
Role of bone marrow stromal cells in the generation of human CD8+ regulatory T cells.Hum Immunol. 2008 Nov;69(11):755-9. doi: 10.1016/j.humimm.2008.08.278. Epub 2008 Sep 24. Hum Immunol. 2008. PMID: 18817823 Review.
-
Immune regulation and cytotoxic T cell activation of IL-10 agonists - Preclinical and clinical experience.Semin Immunol. 2019 Aug;44:101325. doi: 10.1016/j.smim.2019.101325. Epub 2019 Nov 6. Semin Immunol. 2019. PMID: 31706853 Free PMC article. Review.
Cited by
-
Hypoxia Is a Dominant Remodeler of the Effector T Cell Surface Proteome Relative to Activation and Regulatory T Cell Suppression.Mol Cell Proteomics. 2022 Apr;21(4):100217. doi: 10.1016/j.mcpro.2022.100217. Epub 2022 Feb 23. Mol Cell Proteomics. 2022. PMID: 35217172 Free PMC article.
-
Intratumoral Hypoxia Reduces IFN-γ-Mediated Immunity and MHC Class I Induction in a Preclinical Tumor Model.Immunohorizons. 2019 Apr 29;3(4):149-160. doi: 10.4049/immunohorizons.1900017. Immunohorizons. 2019. PMID: 31356176 Free PMC article.
-
Identification of gene expression profiles and immune cell infiltration signatures between low and high tumor mutation burden groups in bladder cancer.Int J Med Sci. 2020 Jan 1;17(1):89-96. doi: 10.7150/ijms.39056. eCollection 2020. Int J Med Sci. 2020. PMID: 31929742 Free PMC article.
-
Memory CD8+ T cells upregulate glycolysis and effector functions under limiting oxygen conditions.Eur J Immunol. 2023 Feb;53(2):e2249918. doi: 10.1002/eji.202249918. Epub 2022 Dec 8. Eur J Immunol. 2023. PMID: 36482267 Free PMC article.
-
Differential gene expression of tumor-infiltrating CD8+ T cells in advanced versus early-stage colorectal cancer and identification of a gene signature of poor prognosis.J Immunother Cancer. 2020 Sep;8(2):e001294. doi: 10.1136/jitc-2020-001294. J Immunother Cancer. 2020. PMID: 32948653 Free PMC article.
References
-
- Ivanovic, Z. , Hypoxia or in situ normoxia: the stem cell paradigm. J. Cell Physiol. 2009. 219: 271–275. - PubMed
-
- Tatum, J. L. , Kelloff, G. J. , Gillies, R. J. , Arbeit, J. M. , Brown, J. M. , Chao, K. S. , Chapman, J. D. et al, Hypoxia: importance in tumor biology, noninvasive measurement by imaging, and value of its measurement in the management of cancer therapy. Int. J. Radiat. Biol. 2006. 82: 699–757. - PubMed
Publication types
MeSH terms
Substances
LinkOut - more resources
Full Text Sources
Other Literature Sources
Molecular Biology Databases
Research Materials
