. 2015 Aug:152:62-75.
doi: 10.1016/j.jsbmb.2015.04.018. Epub 2015 Apr 27.

Genistein increases estrogen receptor beta expression in prostate cancer via reducing its promoter methylation

Affiliations

Genistein increases estrogen receptor beta expression in prostate cancer via reducing its promoter methylation

Abeer M Mahmoud et al. J Steroid Biochem Mol Biol. 2015 Aug.

Abstract

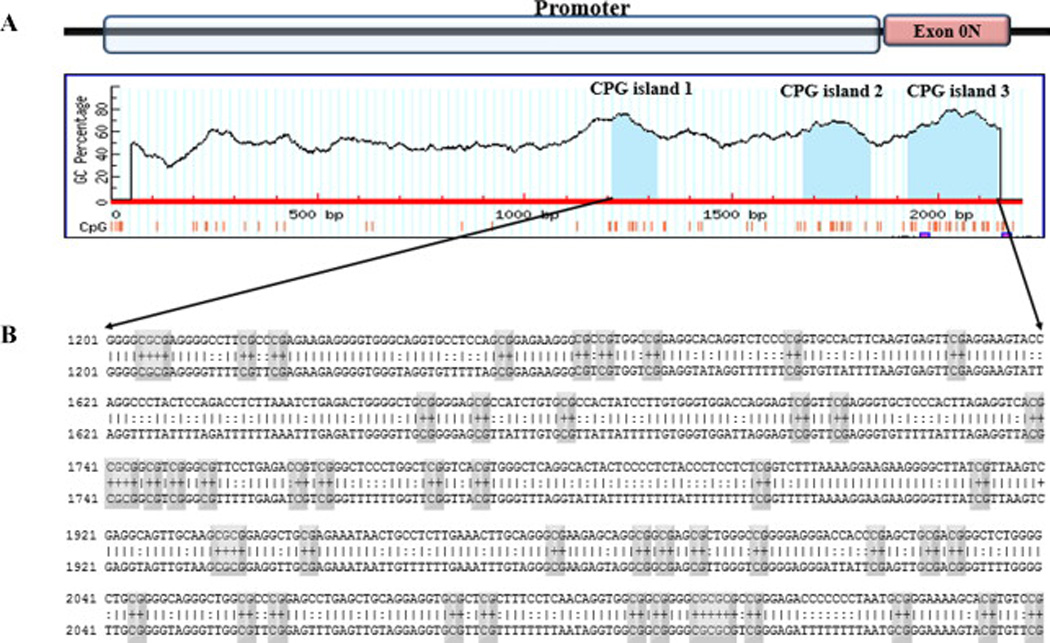
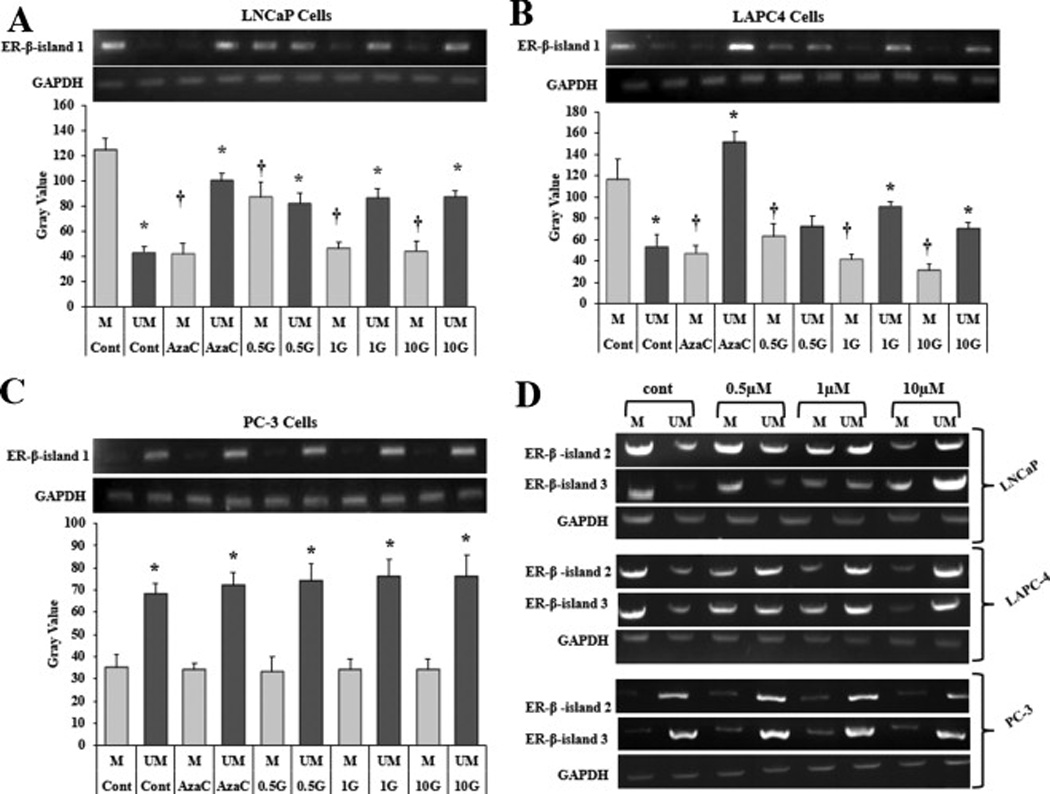
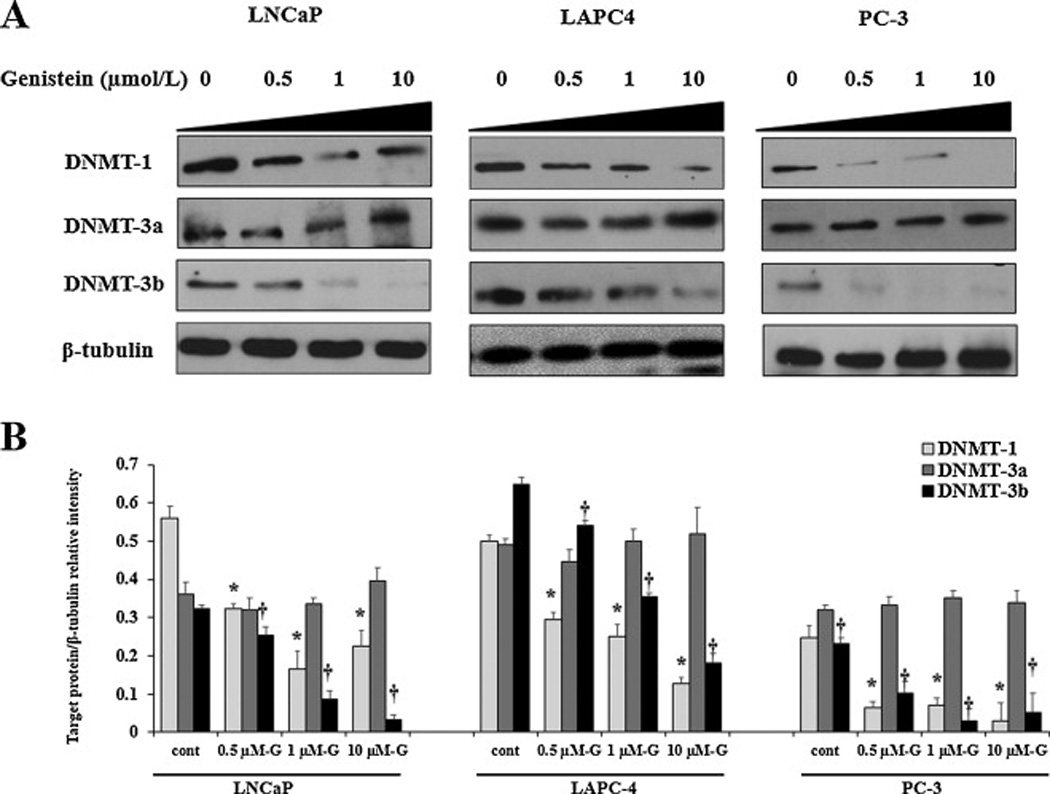
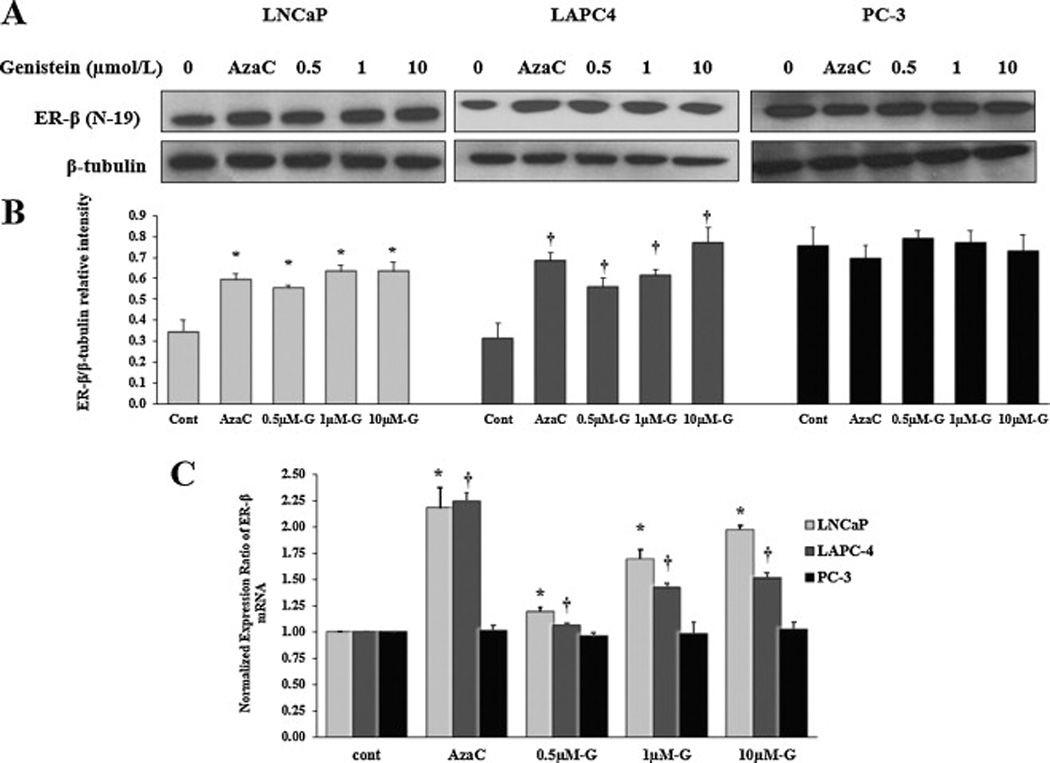
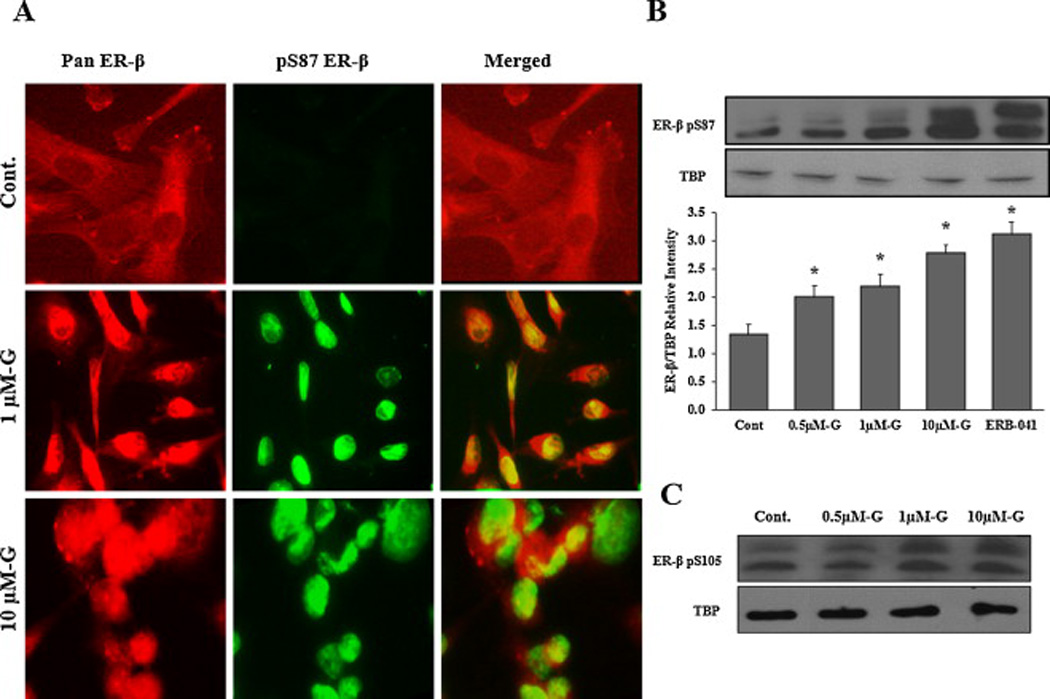
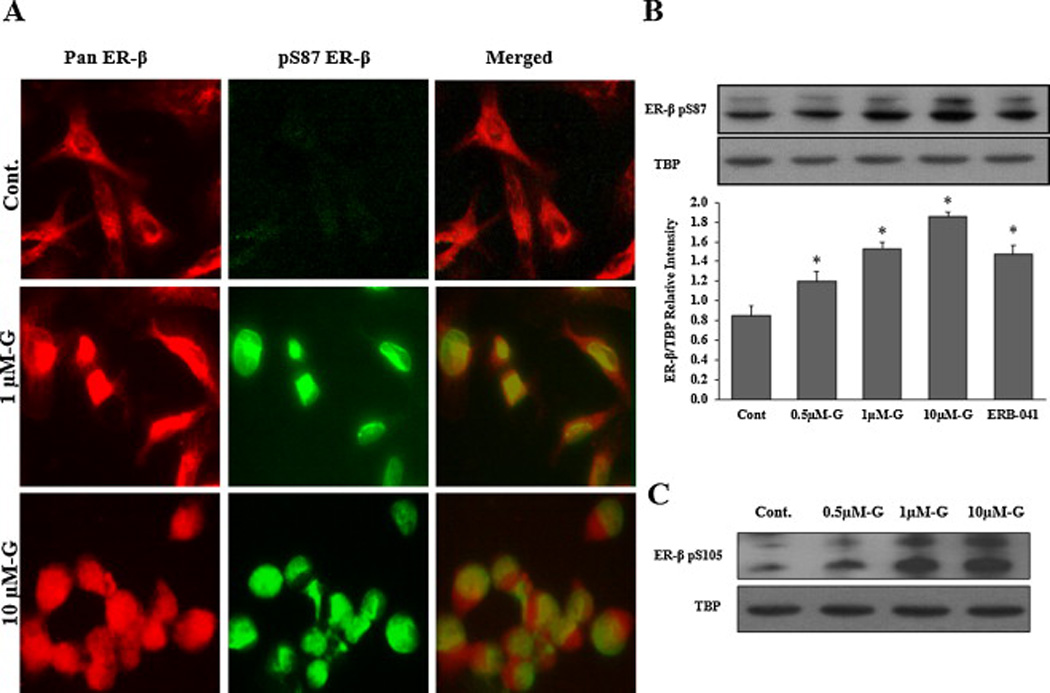
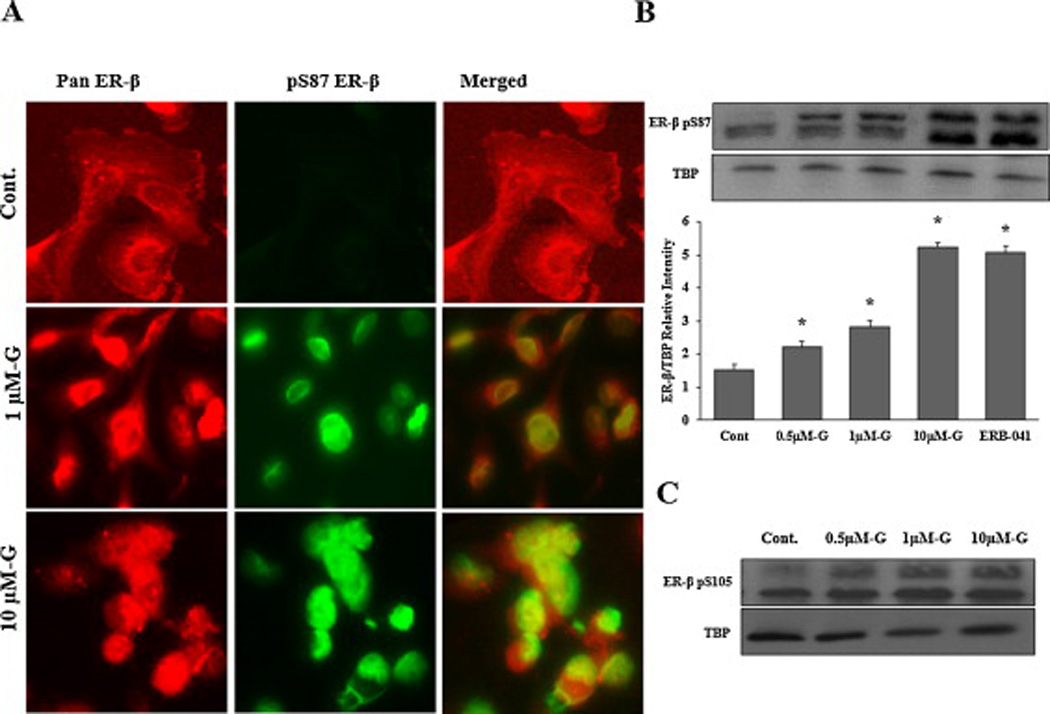
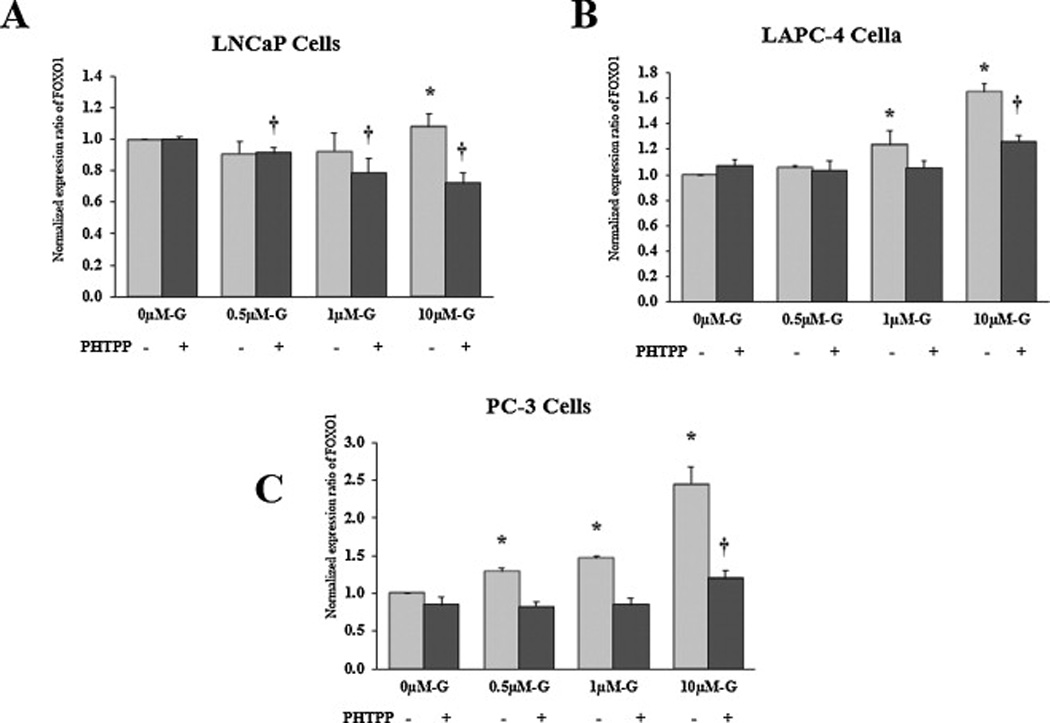
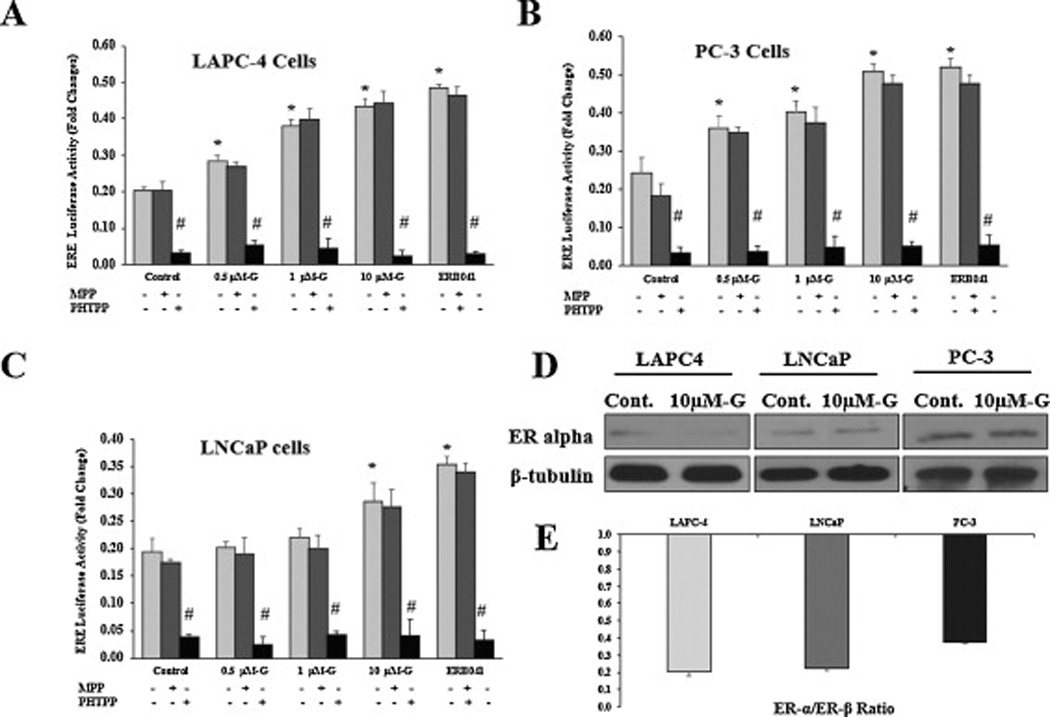
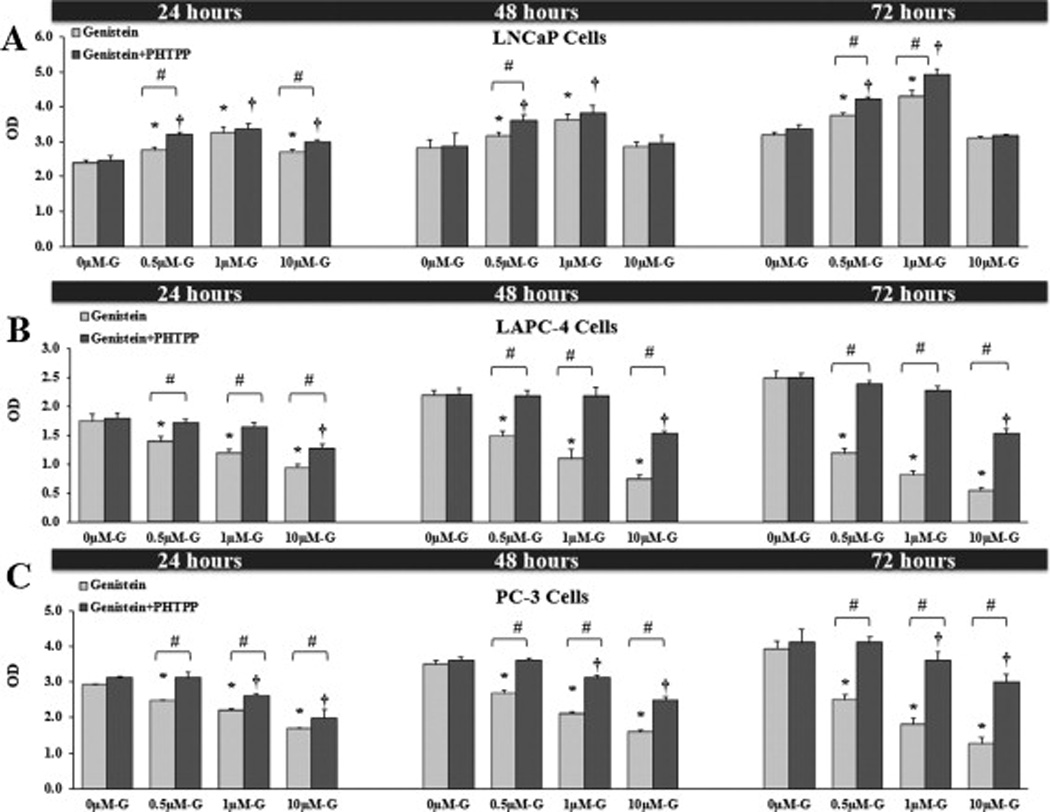
Genistein has protective effects against prostate cancer (PCa) but whether this protection involves an estrogen receptor (ER) β dependent mechanism has yet to be elucidated. ER-β has a tumor suppressor role in PCa and its levels decline with cancer progression which was linked to ER-β promoter hypermethylation. Genistein has been suggested to have demethylating activities in cancer. However, the ability of genistein to reverse ER-β promoter hypermethylation in PCa has not been studied. In addition, there are great discrepancies among studies that examined the effect of genistein on ER-β gene expression. Therefore, we sought to explore effects of genistein on ER-β promoter methylation as a mechanism of modulating ER-β expression using three PCa cell lines, LNCaP, LAPC-4 and PC-3. We also examined the role of ER-β in mediating the preventive action of genistein. Our data demonstrated that genistein at physiological ranges (0.5-10 μmol/L) reduced ER-β promoter methylation significantly with corresponding dose-dependent increases in ER-β expression in LNCaP and LAPC-4 but not in PC-3 cells, which could be attributed to the low basal levels of ER-β promoter methylation in PC-3 cell line. Genistein induced phosphorylation, nuclear translocation and transcriptional activity of ER-β in all three PCa cell lines. Inhibitory effects of genistein on LAPC-4 and PC-3 cell proliferation were diminished using a specific ER-β antagonist. In conclusion, genistein and ER-β act together to prevent PCa cell proliferation; genistein increases ER-β levels via reducing its promoter methylation and ER-β, in turn, mediates the preventive action of genistein.

Keywords: Estrogen receptor β; Genistein; Promoter methylation; Prostate cancer.


Figures

Fig 1
Fig 1. Graphic depiction of the CpG islands in the ER-β gene promoter and exon 0N (AF191544)
A: Three CpG islands from right to left (island 1, 217 bp (1927–2143); island 2, 162 bp (1674–1835); and island 3, 107 bp (1211–1317)) were identified using the software, Methprimer. Two of the predicted CpG islands are located in the promotor and the third one is in the exon 0N. These three CpG islands contain 52 CpG sites. B: Sequence of CpG island in ER-β promoter and exon 0N region where CpG sites are indicated by grey rectangles.
Fig 2
Fig 2. Changes in ER-β DNA methylation pattern in the promoter and exon 0N region in PCa cells after treatment with genistein
Methylation specific PCR of ER-β gene in LNCaP (A), LAPC-4 (B) and PC-3 (C) cells was performed with corresponding diagrammatic representation of relative intensity of bands quantified by the software, image J. Cells were treated with genistein (0.5–10 µmol/L) or vehicle (DMAO). 5-aza-dC (a demethylating agent) was used as a positive control. DNA from treated cells were bisulfite modified and then PCR was done using methylation specific primers and unmethylation specific primers for the first CpG island (exon 0N). Products from the methylation specific PCR were run on agarose gels. All methylation values were normalized to GAPDH. Results represent the means ± standard deviation (SD) of three independent experiments * (P < 0.05) for comparing the UM bands after genistein and 5-aza-dC treatments with the UM band in the vehicle control. † (P < 0.05) for comparing the M bands after genistein and 5-aza-dC treatments with the M band in the vehicle control. D: Methylation specific PCR of ER-β promoter CpG islands (island 2 and 3) after treatment with genistein in LNCaP, LAPC-4 and PC-3 cells. G, genistein, M, methylated, UM, unmethylated.
Fig 3
Fig 3. Effects of genistein on DNMT protein expression in LNCaP, LAPC-4 and PC-3 cells
Western blot analysis of the effect of physiological concentrations of genistein (0.5–10 µmol/L) on protein expression of the three DNMT subtypes, DNMT1, DNMT3a and DNMT3b in PCa cells. Signal relative intensity of DNMT bands was normalized to β-tubulin. Results represent the means ± SD of three independent experiments. * (P < 0.05) and † (P < 0.05) for comparing protein levels after genistein stimulation with vehicle control for DNMT1 and DNMT3b, respectively.
Fig 4
Fig 4. Effects of increasing doses of genistein on the ER-β protein and mRNA in LNCaP, LAPC-4 and PC-3 cells
A: Western blot analysis of the effect of different concentrations of genistein on ER-β protein expression in LNCaP, LAPC-4 and PC-3 cells using ER-β (N-19) antibody. B: Signal relative intensity of ER-β bands was normalized to β-tubulin. C: Quantitative assessment by real-time PCR of ER-β mRNA normalized to the house keeping gene, GAPDH. 5-aza-dC is a demethylating agent used as a positive control. Results represent the means ± SD of three independent experiments. * (P < 0.05) and † (P < 0.05) for comparing ER-β expression after genistein or 5-aza-dC treatments with ER-β expression in the vehicle control in LNCaP and LAPC-4 cells, respectively.
Fig 5
Fig 5. Effects of genistein on ER-β nuclear localization in LAPC-4 cells
A: Cells were treated with DMSO (vehicle) or genistein 1µmol/L and 10µmol/L for 4hr. Then, cells were fixed, immunostained with pan ER-β and pS87 antibodies simultaneously and visualized by the confocal microscope. The red fluorescent staining in the first column is for pan ER-β, the green fluorescent staining in the second column is for pS87 and the third column is for both images merged together using image J software. B: Western blot analysis of ER-β protein phosphorylation at serine 87 in the nuclear protein fraction of LAPC-4 cells treated with genistein. Signal relative intensity of ER-β bands was normalized to Tata Binding Protein (TBP). Results represent the means ± SD of three independent experiments. * (P < 0.05) for comparisons with the vehicle control. C: Western blot analysis of ER-β protein phosphorylation at serine 105 after treatment with genistein.
Fig 6
Fig 6. Effects of genistein on ER-β nuclear localization in LNCaP cells
A: Cells were treated with DMSO (vehicle) or genistein 1µmol/L and 10µmol/L for 4hr. Then, cells were fixed and immunostained with pan ER-β and pS87 antibodies simultaneously and visualized by the confocal microscopy. The red fluorescent staining in the first column is for pan ER-β, the green fluorescent staining in the second column is for pS87 and the third column is for both images merged together using image J software. B: Western blot analysis of ER-β protein phosphorylation at serine 87 in the nuclear protein fraction of LAPC-4 cells treated with genistein. Signal relative intensity of ER-β bands was normalized to Tata Binding Protein (TBP). Results represent the means ± SD of three independent experiments. * (P < 0.05) for comparisons with the vehicle control. C: Western blot analysis of ER-β protein phosphorylation at serine 105 after treatment with genistein.
Fig 7
Fig 7. Effects of genistein on ER-β nuclear localization in PC-3 cells
A: Cells were treated with DMSO (vehicle) or genistein 1µmol/L and 10µmol/L for 4hr. Then, cells were fixed and immunostained with pan ER-β and pS87 antibodies simultaneously and visualized by the confocal microscopy. The red fluorescent staining in the first column is for pan ER-β, the green fluorescent staining in the second column is for pS87 and the third column is for both images merged together using image J software. B: Western blot analysis of ER-β protein phosphorylation at serine 87 in the nuclear protein fraction of LAPC-4 cells treated with genistein. Signal relative intensity of ER-β bands was normalized to Tata Binding Protein (TBP). Results represent the means ± SD of three independent experiments. * (P < 0.05) for comparisons with the vehicle control. C: Western blot analysis of ER-β protein phosphorylation at serine 105 after treatment with genistein.
Fig 8
Fig 8. Effects of genistein on FOXO1 mRNA levels in PCa cells
Quantitative assessment by real-time PCR of FOXO1 mRNA in LNCaP (A), LAPC-4 (B) and PC-3 (C) cells treated with genistein with or without the specific ER-β antagonist, PHTPP. FOXO-1 mRNA was normalized to the house keeping gene, GAPDH. Results represent the means ± SD of three independent experiments. * (P < 0.05) and † (P < 0.05) for comparing FOXO1 mRNA levels after genistein treatment with FOXO1 mRNA level in the vehicle control in the absence and presence of PHTPP, respectively.
Fig 9
Fig 9. Effects of genistein on ER-β transcriptional activity in PCa cells
The effect of genistein alone or in combination with either MPP (ER-α antagonist) or PHTPP (ER-β antagonist) on ERE luciferase activity was measured in LAPC-4 (A), PC-3 (B), and LNCaP (C) cells that were transfected with ERE luciferase reporter. Results represent the means ± SD of three independent experiments. * (P < 0.05) for comparing ERE luciferase activity after genistein treatment with that in the vehicle control. # (P < 0.05) for comparing ERE luciferase activity in the presence of PHTPP with that in the absence of PHTPP in each treatment category. D: Western blot analysis of the effect of 10µmol/L of genistein on ER-α protein expression in the three PCa cell lines compared with the vehicle control. E: graphic representation of the ratio between ER-α and ER-β protein quantified from the Western blots in figures 9D and 4A, respectively using image J software.
Fig 10
Fig 10. Effects of genistein on PCa cell growth and viability
The data represent the mean ± SD of three MTS assay experiments each in triplicate. Graphic presentation of the effects of different concentrations of genistein alone or combined with PHTPP after 24, 48 and 72 hours on LAPC-4 (A), LNCaP (B) and PC-3 (C) cell growth. OD; optical density. * (P < 0.05) and † (P < 0.05) for comparing cell proliferation after genistein treatment with cell proliferation in the vehicle control state in the absence and presence of PHTPP, respectively. # (P < 0.05) for comparing cell proliferation between cells treated with genistein only and cells treated with genistein plus PHTPP within each concentration of genistein.

Similar articles

Cited by

References

    1. Jemal A, Bray F, Center MM, Ferlay J, Ward E, et al. Global cancer statistics. CA Cancer J Clin. 2011;61:69–90. - PubMed
    1. Siegel R, Desantis C, Virgo K, Stein K, Mariotto A, et al. Cancer treatment and survivorship statistics. CA Cancer J Clin. 2012;2012;62:220–241. - PubMed
    1. Kimura T. East meets West: ethnic differences in prostate cancer epidemiology between East Asians and Caucasians. Chin J Cancer. 2011 - PMC - PubMed
    1. Adlercreutz H, Markkanen H, Watanabe S. Plasma concentrations of phyto-oestrogens in Japanese men. Lancet. 1993;342:1209–1210. - PubMed
    1. Morton MS, Chan PS, Cheng C, Blacklock N, Matos-Ferreira A, et al. Lignans and isoflavonoids in plasma and prostatic fluid in men: samples from Portugal, Hong Kong, and the United Kingdom. Prostate. 1997;32:122–128. - PubMed

Publication types

MeSH terms