

Photon-in photon-out hard X-ray spectroscopy at the Linac Coherent Light Source
- PMID: 25931076
- PMCID: PMC4416677
- DOI: 10.1107/S1600577515004488
Photon-in photon-out hard X-ray spectroscopy at the Linac Coherent Light Source
Abstract
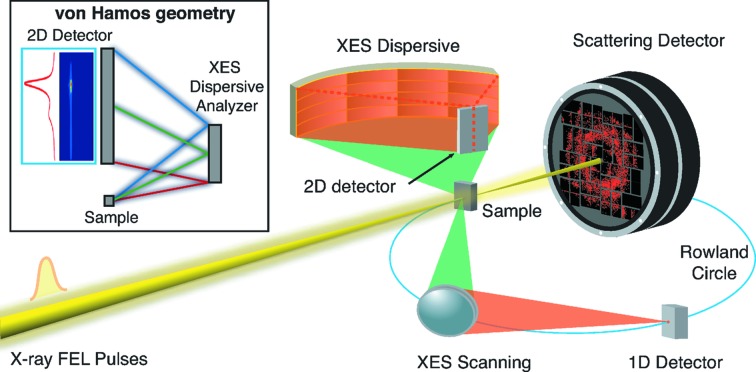
X-ray free-electron lasers (FELs) have opened unprecedented possibilities to study the structure and dynamics of matter at an atomic level and ultra-fast timescale. Many of the techniques routinely used at storage ring facilities are being adapted for experiments conducted at FELs. In order to take full advantage of these new sources several challenges have to be overcome. They are related to the very different source characteristics and its resulting impact on sample delivery, X-ray optics, X-ray detection and data acquisition. Here it is described how photon-in photon-out hard X-ray spectroscopy techniques can be applied to study the electronic structure and its dynamics of transition metal systems with ultra-bright and ultra-short FEL X-ray pulses. In particular, some of the experimental details that are different compared with synchrotron-based setups are discussed and illustrated by recent measurements performed at the Linac Coherent Light Source.
Keywords: FEL; XES; XRS; hard X-ray emission spectroscopy.
Figures
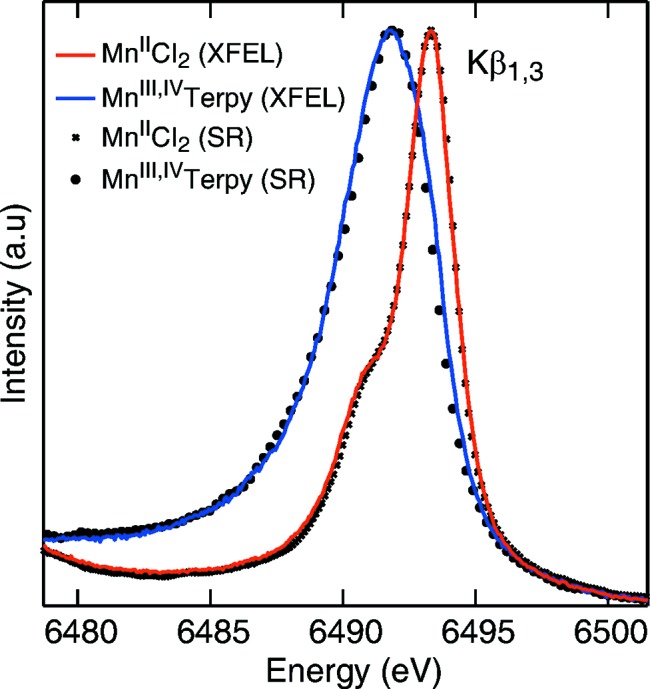
 spectra from MnIICl2 (red) and redox-sensitive
  (blue) collected at the CXI instrument. The symbols show the spectra from the MnII and
  complexes collected with a similar setup at SSRL beamline 6-2 for comparison purposes. Figure reprinted with permission from Alonso-Mori et al. (2012a
▶).
complexes collected with a similar setup at SSRL beamline 6-2 for comparison purposes. Figure reprinted with permission from Alonso-Mori et al. (2012a
▶).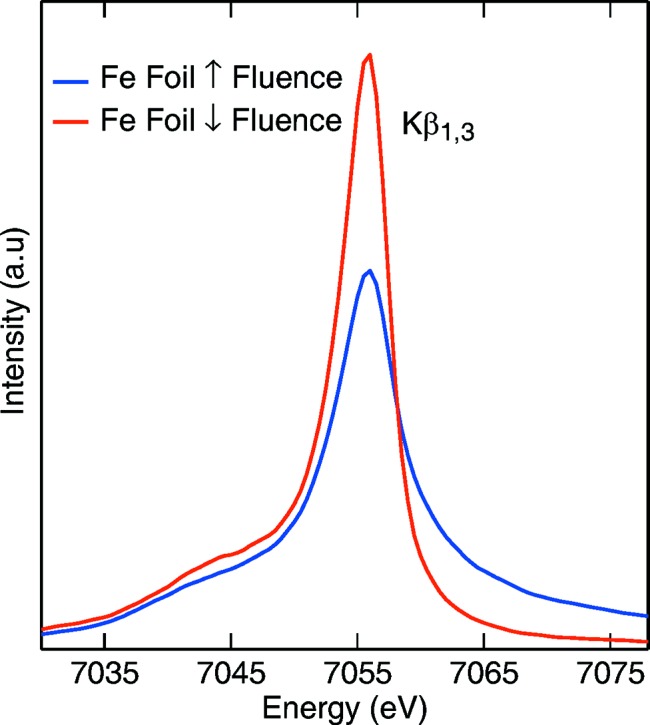 spectra collected at the XPP instrument. The blue curve was recorded with unfocused beam. The red curve was recorded with the beam being tightly focused.
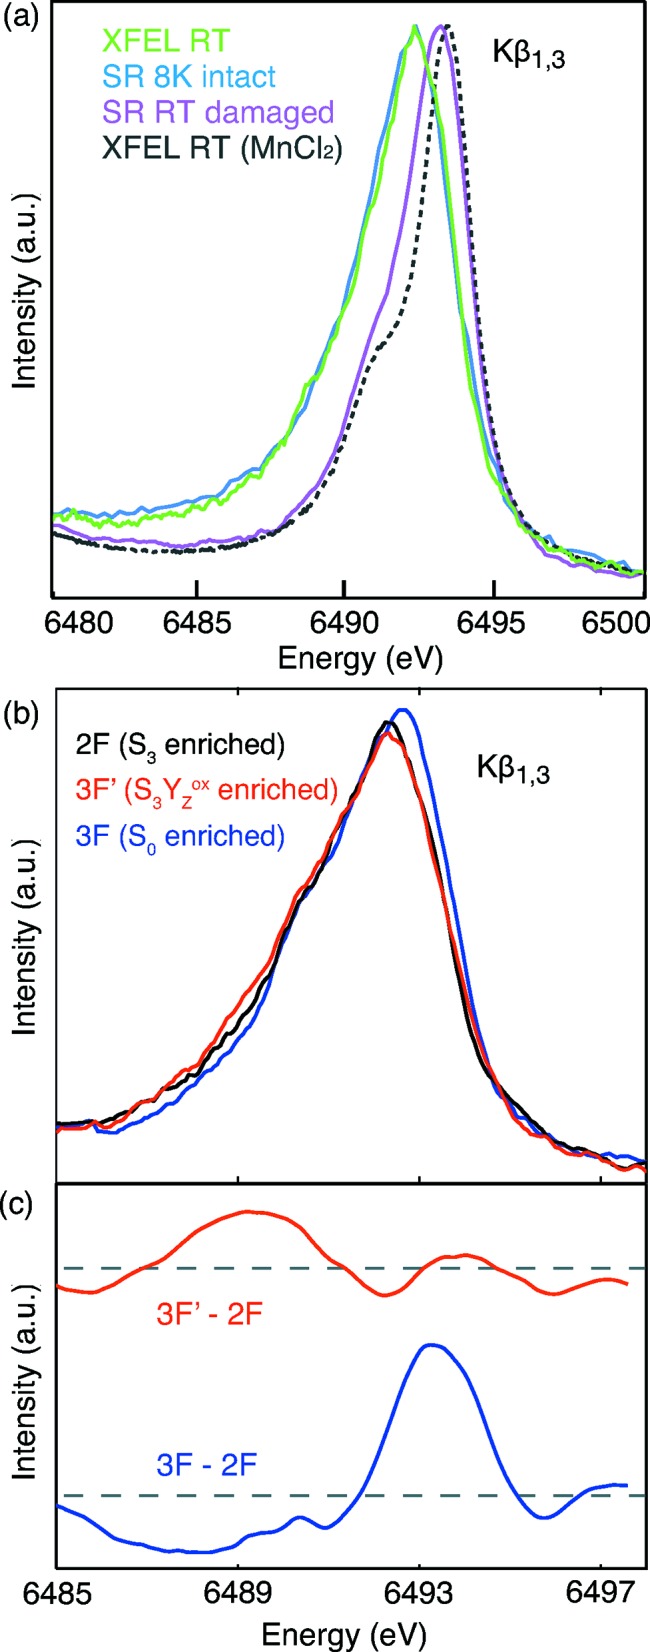
 XES spectra of PSII measured in the dark stable S1 state at the CXI instrument at RT (green), at a synchrotron at 8 K (blue) and at a synchrotron at RT (pink) in comparison with the spectrum of MnCl2 (grey). (b) RT XES of PSII in three different states of the photosynthetic cycle measured at CXI. (c) Differences between the LCLS Mn XES of PSII in the 2F and the transient 3F′ state (red) and in the 2F and 3F state (blue). Before calculating the difference curves, spectra were smoothed by cubic polynomial fitting. Figure reprinted with permission from Kern et al. (2013, 2014 ▶).
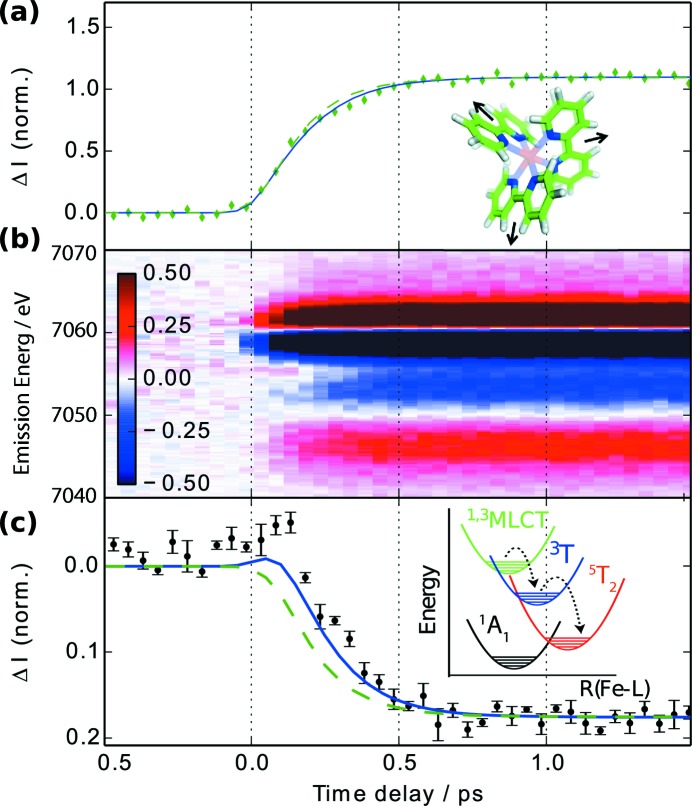 difference spectra (b) and kinetic modelling of spin crossover dynamics [(a) and (c)] for Fe(bpy)3. After excitation into the metal–ligand charge transfer state, transition into the HS 5T2 state [inset in (c)] causes an increase of the Fe-to-ligand distance [inset in (a)]. The difference signal measured at a fluorescence energy of 7061 eV [(a) green diamonds] and 7054 eV [(c) black symbols]. The data have been overlaid with results from global fits including (blue lines) and excluding (green dashed lines) population of and intermediate 3T2 triplet state. Courtesy of Zhang et al. (2014).
References
-
- Alonso-Mori, R. et al. (2012a). Proc. Natl. Acad. Sci. USA, 109, 19103–19107.
-
- Amann, J. et al. (2012). Nat. Photon. 6, 693.
-
- Ament, L. J. P., van Veenendaal, M., Devereaux, T. P., Hill, J. P. & van den Brink, J. (2011). Rev. Mod. Phys. 83, 705.
-
- Badro, J., Rueff, J.-P., Vanko, G., Monaco, G., Fiquet, G. & Guyot, F. (2004). Science, 305, 383–386. - PubMed
Publication types
LinkOut - more resources
Full Text Sources
