

Water window ptychographic imaging with characterized coherent X-rays
- PMID: 25931102
- PMCID: PMC4416689
- DOI: 10.1107/S1600577515005524
Water window ptychographic imaging with characterized coherent X-rays
Abstract
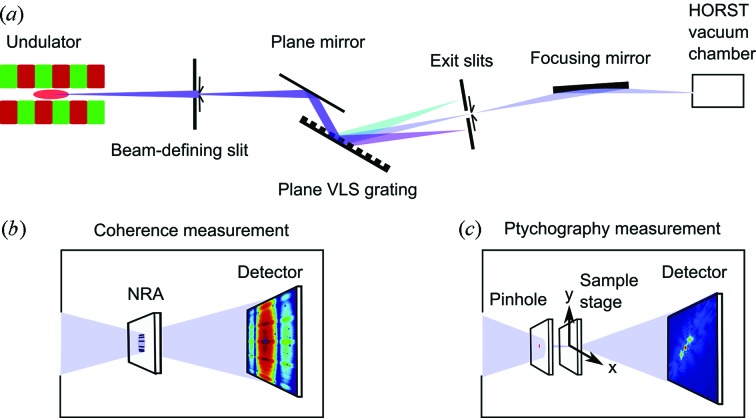
A ptychographical coherent diffractive imaging experiment in the water window with focused soft X-rays at 500 eV is reported. An X-ray beam with high degree of coherence was selected for ptychography at the P04 beamline of PETRA III synchrotron radiation source. The beam coherence was measured with the newly developed non-redundant array method, and a coherence length of 4.1 µm and global degree of coherence of 35% at 100 µm exit slit opening in the vertical direction were determined. A pinhole, 2.6 µm in size, selected the coherent part of the beam that was used to obtain ptychographic reconstruction results of a lithographically manufactured test sample and a fossil diatom. The achieved resolution was 53 nm for the test sample and was only limited by the size of the detector. The diatom was imaged at a resolution better than 90 nm.
Keywords: diatom; non-redundant array; ptychography; water window imaging.
Figures
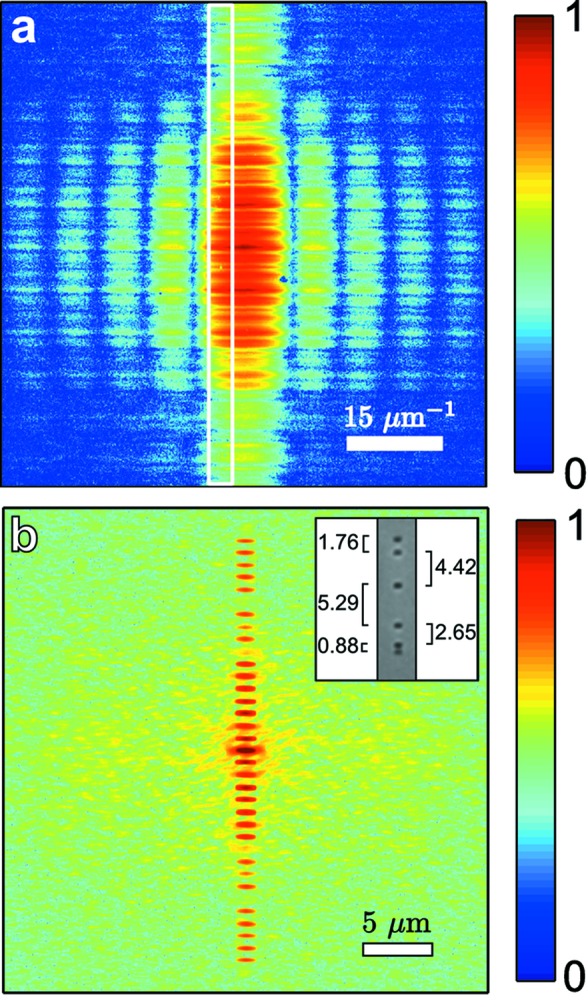
 = 100 µm. The white rectangle indicates the area used for the analysis. (b) The Fourier transform of the NRA diffraction pattern. Both images are displayed on a logarithmic scale. (Inset) Optical microscope image of the NRA and its aperture separations shown in micrometers.
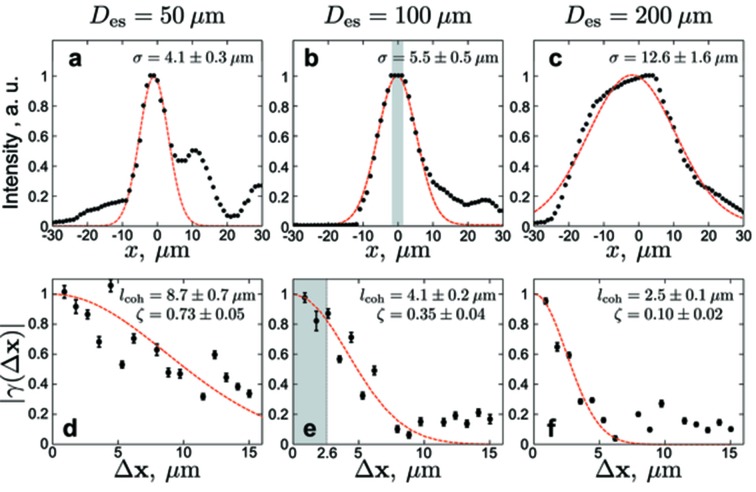 at 500 eV. Black dots indicate measured data and dashed lines represent Gaussian fits. (a)–(c) Intensity profiles measured with scans of a 1.5 µm pinhole. (d)–(f) Modulus of the CCF
  . The gray shaded areas in (b) and (e) indicate the coherent part of the beam selected by the beam-defining 2.6 µm pinhole. The r.m.s. values σ of the beam size obtained from Gaussian fits, the coherence length
  , as well as the values of the global degree of coherence ζ determined from equation (4) are also shown. For the Gaussian fits we used the data points up to 9 µm in (e) and up to 7 µm in (f).
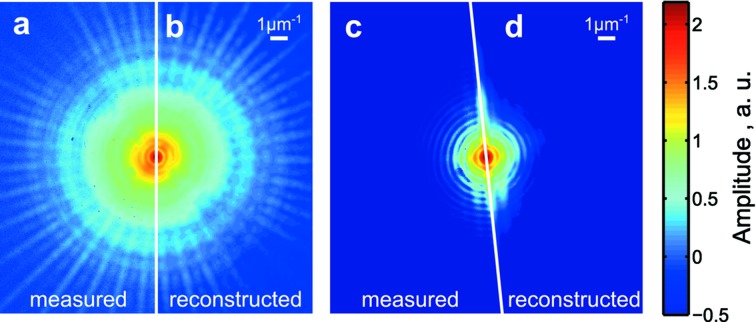
Similar articles
-
Ptychographic coherent x-ray diffractive imaging in the water window.Opt Express. 2011 Jan 17;19(2):1037-50. doi: 10.1364/OE.19.001037. Opt Express. 2011. PMID: 21263642
-
High-dynamic-range coherent diffractive imaging: ptychography using the mixed-mode pixel array detector.J Synchrotron Radiat. 2014 Sep;21(Pt 5):1167-74. doi: 10.1107/S1600577514013411. Epub 2014 Aug 7. J Synchrotron Radiat. 2014. PMID: 25178008 Free PMC article.
-
Versatility of a hard X-ray Kirkpatrick-Baez focus characterized by ptychography.J Synchrotron Radiat. 2013 May;20(Pt 3):490-7. doi: 10.1107/S0909049513005372. Epub 2013 Apr 4. J Synchrotron Radiat. 2013. PMID: 23592629
-
Characterization of spatial coherence of synchrotron radiation with non-redundant arrays of apertures.J Synchrotron Radiat. 2014 Jul;21(Pt 4):722-8. doi: 10.1107/S1600577514006857. Epub 2014 May 13. J Synchrotron Radiat. 2014. PMID: 24971966
-
Coherence in X-ray physics.Naturwissenschaften. 2001 Jun;88(6):249-60. doi: 10.1007/s001140100221. Naturwissenschaften. 2001. PMID: 11544952 Review.
Cited by
-
Directly observing intracellular nanoparticle formation with nanocomputed tomography.Sci Adv. 2020 Oct 23;6(43):eaba3190. doi: 10.1126/sciadv.aba3190. Print 2020 Oct. Sci Adv. 2020. PMID: 33097531 Free PMC article.
-
Domain morphology, boundaries, and topological defects in biophotonic gyroid nanostructures of butterfly wing scales.Sci Adv. 2016 Jun 10;2(6):e1600149. doi: 10.1126/sciadv.1600149. eCollection 2016 Jun. Sci Adv. 2016. PMID: 27386575 Free PMC article.
-
Investigation of the polarization state of dual APPLE-II undulators.J Synchrotron Radiat. 2016 Jan;23(1):176-81. doi: 10.1107/S1600577515021645. Epub 2016 Jan 1. J Synchrotron Radiat. 2016. PMID: 26698061 Free PMC article.
-
Soft X-ray diffraction patterns measured by a LiF detector with sub-micrometre resolution and an ultimate dynamic range.J Synchrotron Radiat. 2020 May 1;27(Pt 3):625-632. doi: 10.1107/S1600577520002192. Epub 2020 Mar 16. J Synchrotron Radiat. 2020. PMID: 32381762 Free PMC article.
-
A comparison of absorption and phase contrast for X-ray imaging of biological cells.J Synchrotron Radiat. 2018 Sep 1;25(Pt 5):1490-1504. doi: 10.1107/S1600577518009566. Epub 2018 Aug 27. J Synchrotron Radiat. 2018. PMID: 30179189 Free PMC article.
References
-
- Abbey, B. (2013). JOM, 65, 1183–1201.
-
- Bertilson, M., von Hofsten, O., Vogt, U., Holmberg, A. & Hertz, H. M. (2009). Opt. Express, 17, 11057–11065. - PubMed
-
- Bunk, O., Dierolf, M., Kynde, S., Johnson, I., Marti, O. & Pfeiffer, F. (2008). Ultramicroscopy, 108, 481–487. - PubMed
-
- Burdet, N., Morrison, G. R., Huang, X., Shi, X., Clark, J. N., Zhang, F., Civita, M., Harder, R. & Robinson, I. K. (2014). Opt. Express, 22, 10294–10303. - PubMed
-
- Chang, C., Naulleau, P., Anderson, E. & Attwood, D. (2000). Opt. Commun. 182, 25–34.
Publication types
LinkOut - more resources
Full Text Sources
