. 2015 Jun 12;290(24):15146-62.
doi: 10.1074/jbc.M114.630681. Epub 2015 Apr 30.

Analysis of Human Dopamine D3 Receptor Quaternary Structure

Affiliations

Analysis of Human Dopamine D3 Receptor Quaternary Structure

Sara Marsango et al. J Biol Chem. .

Abstract

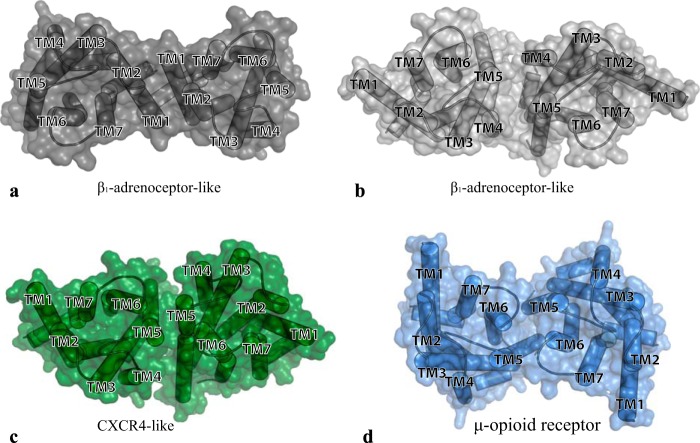
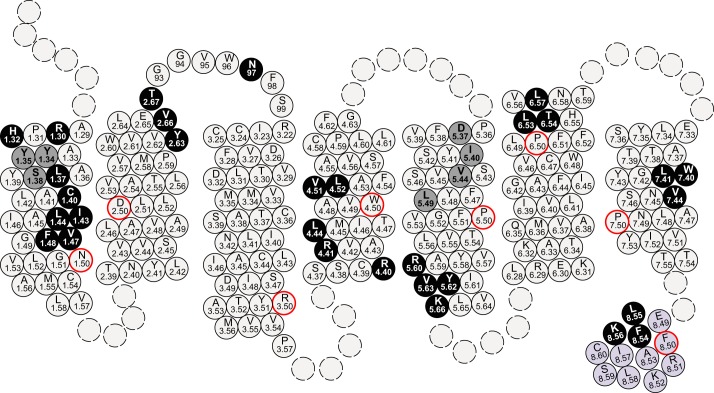
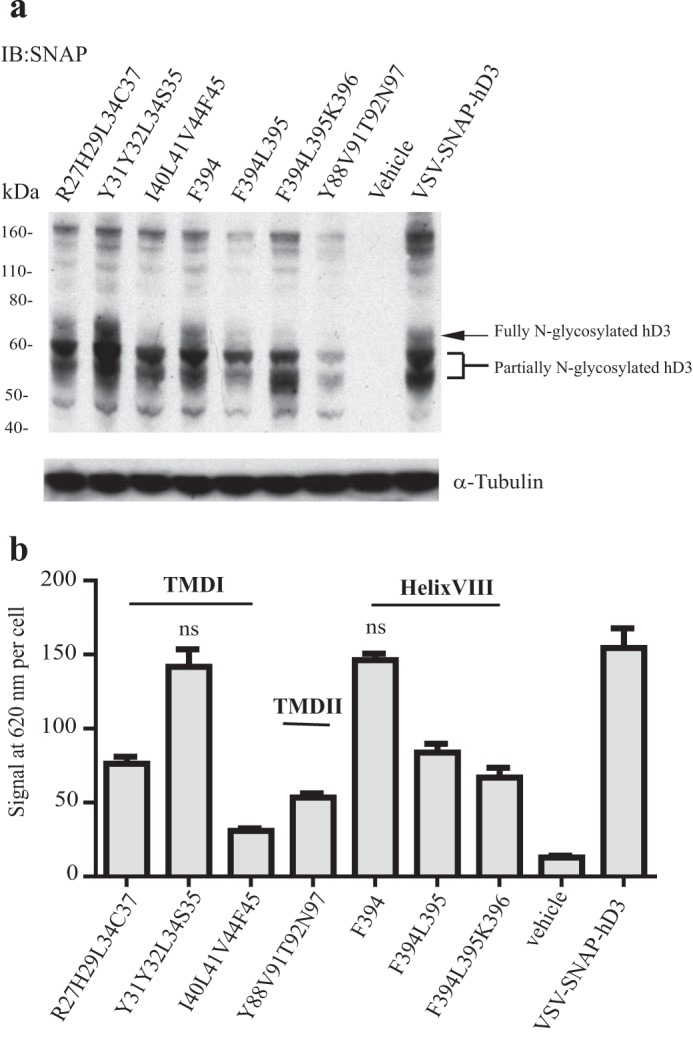
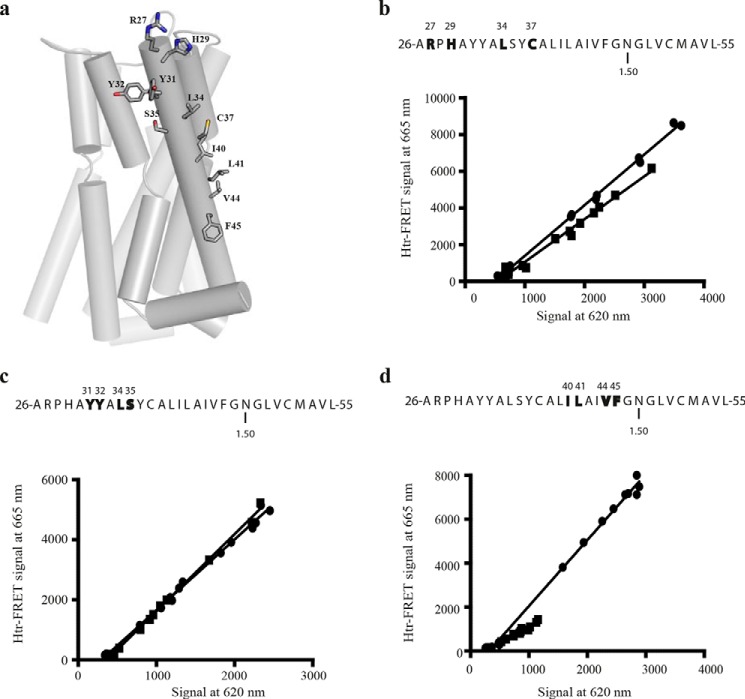
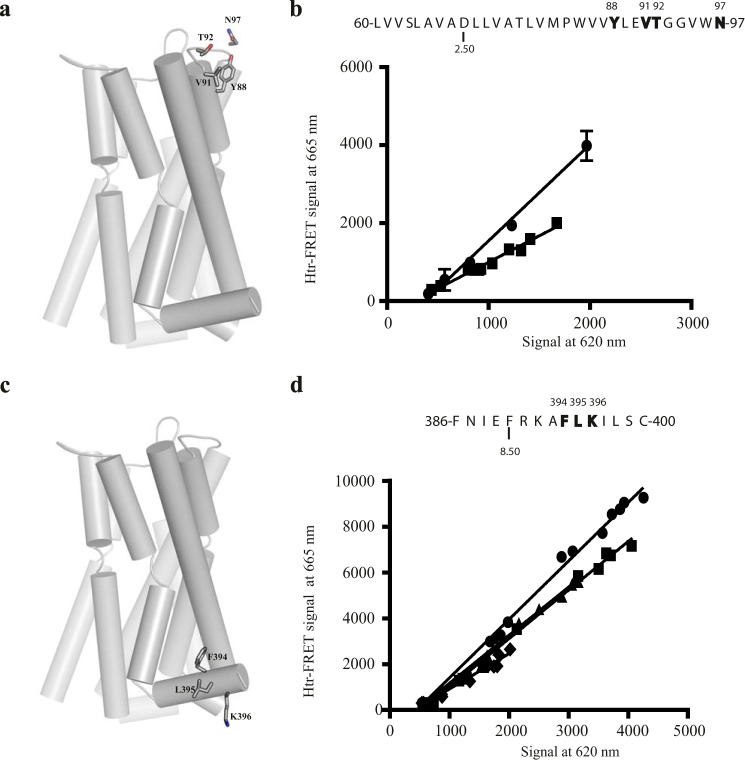
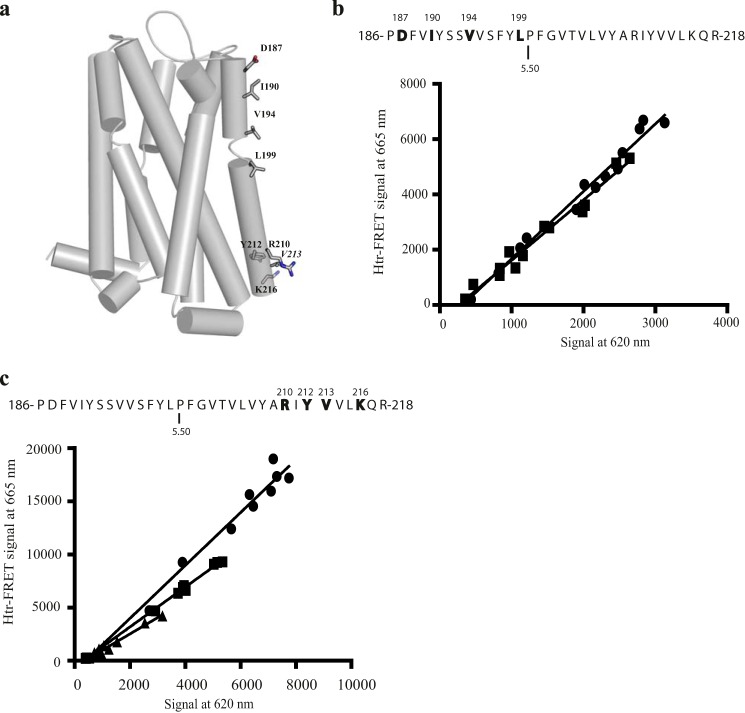
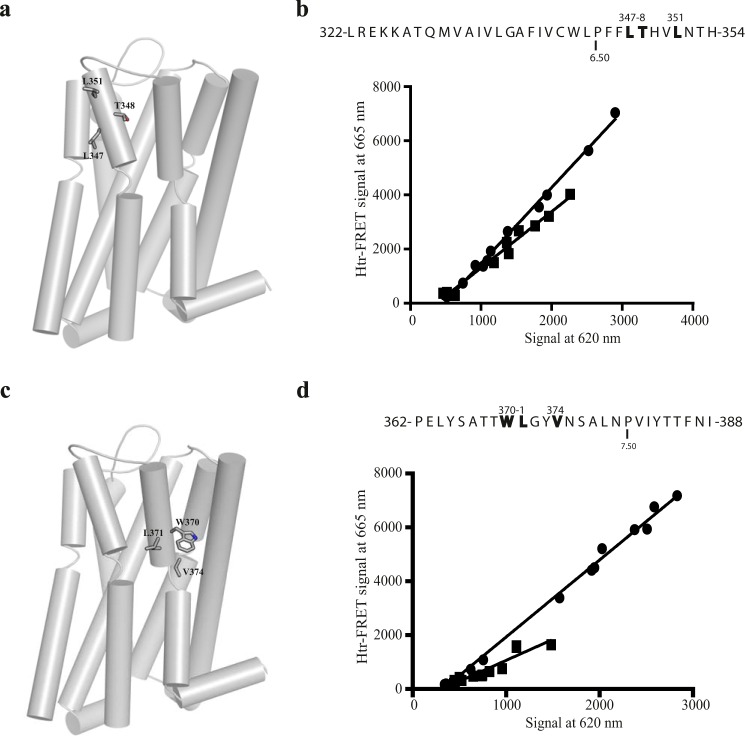
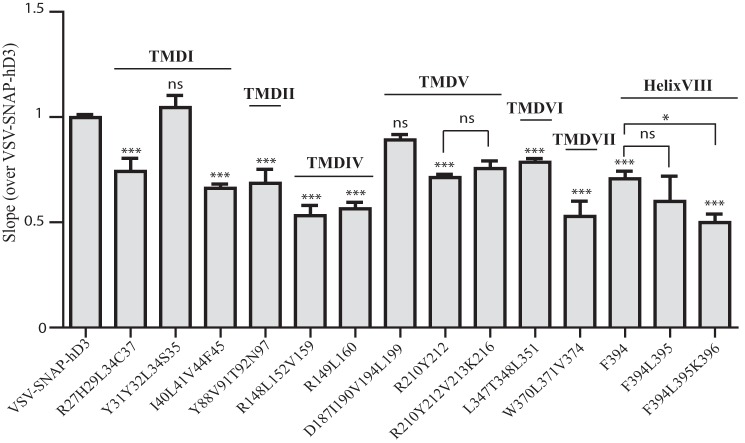
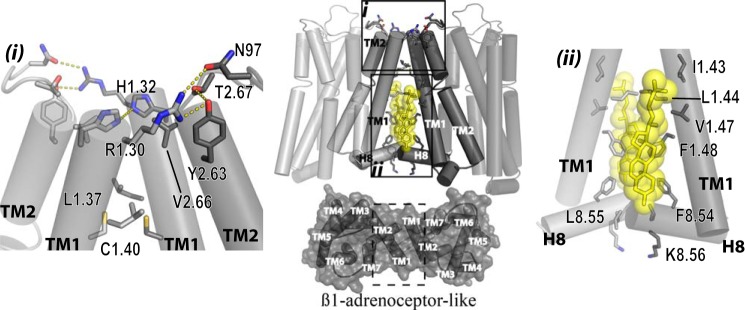
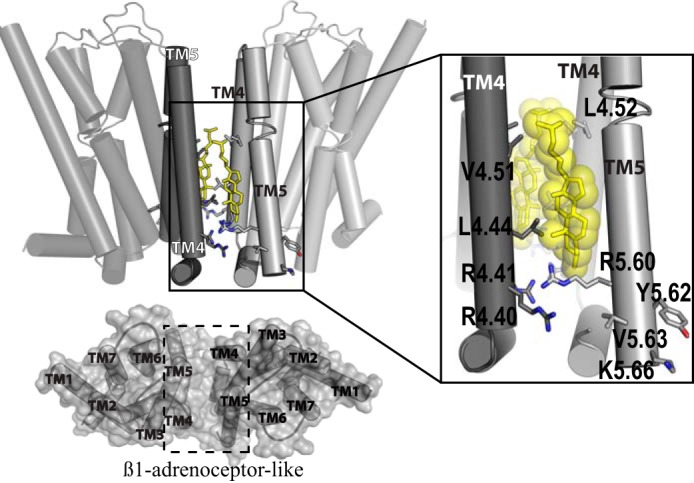
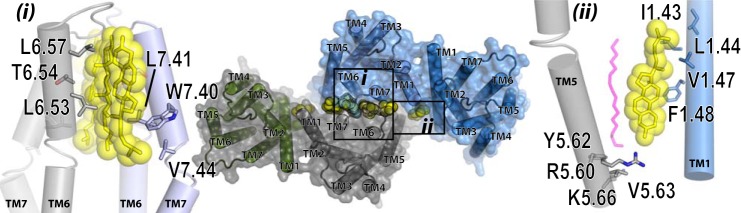
The dopamine D3 receptor is a class A, rhodopsin-like G protein-coupled receptor that can form dimers and/or higher order oligomers. However, the molecular basis for production of these complexes is not well defined. Using combinations of molecular modeling, site-directed mutagenesis, and homogenous time-resolved FRET, the interfaces that allow dopamine D3 receptor monomers to interact were defined and used to describe likely quaternary arrangements of the receptor. These were then compared with published crystal structures of dimeric β1-adrenoreceptor, μ-opioid, and CXCR4 receptors. The data indicate important contributions of residues from within each of transmembrane domains I, II, IV, V, VI, and VII as well as the intracellular helix VIII in the formation of D3-D3 receptor interfaces within homo-oligomers and are consistent with the D3 receptor adopting a β1-adrenoreceptor-like quaternary arrangement. Specifically, results suggest that D3 protomers can interact with each other via at least two distinct interfaces: the first one comprising residues from transmembrane domains I and II along with those from helix VIII and a second one involving transmembrane domains IV and V. Moreover, rather than existing only as distinct dimeric species, the results are consistent with the D3 receptor also assuming a quaternary structure in which two transmembrane domain I-II-helix VIII dimers interact to form a "rhombic" tetramer via an interface involving residues from transmembrane domains VI and VII. In addition, the results also provide insights into the potential contribution of molecules of cholesterol to the overall organization and potential stability of the D3 receptor and possibly other GPCR quaternary structures.

Keywords: G protein-coupled receptor, dopamine receptor, homodimer, tetramer, GPCR quaternary structure, molecular modeling, fluorescence resonance energy transfer.


Figures

FIGURE 1.
FIGURE 1.
Molecular models of alternative hD3 receptor dimeric arrangements. hD3-hD3 interactions may be mediated by interfaces of dimerization composed of residues from TMD I-II and helix VII as observed in a number of different receptors (a) and/or TMD IV-V interactions as observed in the turkey β1-adrenoreceptor (b). TMD V-V interactions, as observed in the CXCR4 chemokine receptor (c) or by TMD V-VI interactions (d), as observed in the μ-opioid receptor.
FIGURE 2.
FIGURE 2.
Organization and expression of a SNAP-tagged form of hD3. a, schematic representation of hD3 modified at the N terminus by the incorporation of a signal sequence derived from the metabotropic glutamate receptor 5 (mGluR SS), the VSV epitope tag, and the SNAP-tag polypeptide to produce the VSV-SNAP-hD3 construct. b, lysates from HEK293T cells transiently transfected with an empty vector or with VSV-SNAP-hD3 were resolved by SDS-PAGE after previous treatment with (+) or without (−) peptide-N-glycosidase F (PNGase F) and immunoblotted (IB) with an anti-SNAP antiserum (upper panel) or an anti-α-tubulin antiserum (lower panel). c, HEK293T cells transfected with increasing amounts of VSV-SNAP-hD3 were incubated with the htrFRET energy donor SNAP-Lumi4-Tb (10 nm). SNAP-Lumi4-Tb cell surface binding was determined by fluorescent emission at 620 nm and standardized for cell number. d, in cells expressing VSV-SNAP-hD3 combinations of SNAP-Lumi4-Tb (10 nm) as energy donors and increasing concentrations of the htrFRET energy acceptor SNAP-Red resulted in a bell-shaped distribution of resonance energy transfer (circles) from SNAP-Lumi4-Tb to SNAP-Red. Equivalent experiments were performed on cells expressing VSV-SNAP-EGFR (squares) at equal levels of cell surface expression as defined by binding and emission at 620 nm of SNAP-Lumi4-Tb (d, inset, open bars = mock transfection; filled bars = corresponding receptor). e, htrFRET assays were performed on HEK293T cells transfected with increasing amounts of VSV-SNAP-hD3 (circles) or VSV-SNAP-EGFR (squares) and labeled with an optimal combination of SNAP-Lumi4-Tb (10 nm) and SNAP-Red (100 nm). Cell surface expression (signal at 620 nm) was plotted against energy transfer (signal at 665 nm).
FIGURE 3.
FIGURE 3.
The topology of VSV-SNAP-hD3. All amino acids of hD3 receptor located within TMD I-TMD VII, extracellular loop 1, and helix VIII are shown and designated by the corresponding Ballesteros-Weinstein residue location number. The most highly conserved residue in each TMD (X.50) is shown in a red circle. VSV-SNAP-hD3 mutants were generated by alanine substitutions. Residues identified to be important for hD3-hD3 quaternary structure stability as defined in htrFRET studies are shown in black circles, whereas residues modified that did not appear to be involved in the formation of a homomeric interface are shown in gray circles.
FIGURE 4.
FIGURE 4.
Expression and cell surface delivery of VSV-SNAP-hD3 variants. a, lysates from HEK293T cells transiently transfected with an empty vector, with VSV-SNAP-hD3 construct, or each VSV-SNAP-hD3 mutant variant of interest were resolved by SDS-PAGE and immunoblotted (IB) with anti-SNAP antiserum (upper panel) or anti-α-tubulin antiserum (lower panel). b, HEK293T cells transfected to express wild type VSV-SNAP-hD3 or each VSV-SNAP-hD3 mutant of interest were incubated with 10 nm SNAP-Lumi4-Tb; cell surface binding was determined as described in Fig. 2.
FIGURE 5.
FIGURE 5.
Role of residues in TMD I in hD3-hD3 interactions. a, tertiary structure of hD3 receptor with TMD I residues that were mutated to alanine shown as sticks. b–d, in each case the primary structure of TMD I is presented via the one-letter amino acid code. Amino acids that were replaced with alanine are in bold and are denoted by their position in the primary sequence of hD3. Asparagine residue 1.50 is also indicated. Representative htrFRET assays performed in HEK293T cells transfected with increasing amounts of Arg-27,His-29,Leu-34,Cys-37 VSV-SNAP-hD3 (b, squares), Tyr-31,Tyr-32,Leu-34,Ser-35 VSV-SNAP-hD3 (c, squares), or Ile-40,Leu-41,Val-44,Phe-45 VSV-SNAP-hD3 (d, squares) were compared with those performed on HEK293T cells transfected with increasing amounts of VSV-SNAP-hD3 (b–d, circles). The plots shown were analyzed by linear regression. See Fig. 10 for analysis of the full data set.
FIGURE 6.
FIGURE 6.
Role of residues in TMD II and helix VIII in hD3-hD3 interactions. a, tertiary structure of hD3 receptor with TMD II residues that were mutated to alanine shown as sticks. b, the primary structure of TMD II is presented via the one-letter amino acid code. Amino acids that were replaced with alanine are in bold and are denoted by their position in the primary sequence of hD3. Aspartic acid 2.50 is also indicated. HtrFRET assays performed in HEK293T cells transfected with increasing amounts of VSV-SNAP-hD3 (circles) or Tyr-88,Val-91,Thr-92,Asn-97 VSV-SNAP-hD3 (squares). c, the primary structure of helix VIII is presented via the one-letter amino acid code; amino acids that were replaced with alanine are in bold. d, HtrFRET assays performed in HEK293T cells transfected with increasing amounts of VSV-SNAP-hD3 (circles), Phe-394 VSV-SNAP-hD3 (squares), Phe-394,Leu-395 VSV-SNAP-hD3 (triangles), or Phe-394,Leu-395,Lys-396 VSV-SNAP-hD3 (diamonds). The plots shown were analyzed by linear regression. See Fig. 10 for analysis of the full data set.
FIGURE 7.
FIGURE 7.
Role of TMD V in hD3-hD3 interactions. a, tertiary structure of hD3 with TMD V residues that were mutated to alanine shown as sticks. b and c, the primary structure of TMD V is presented via the one-letter amino acid code. Amino acids that were replaced with alanine are in bold and are denoted by their position in the primary sequence of hD3. Proline 5.50 is also indicated. HtrFRET assays performed in HEK293T cells transfected with increasing amounts of VSV-SNAP-hD3 (b and c, circles) and either Asp-187,Ile-190,Val-194,Leu-199 VSV-SNAP-hD3 (b, squares) or Arg-210, Tyr-212 VSV-SNAP-hD3 (c, square), or Arg-210, Tyr-212, Val-213, Lys-216 VSV-SNAP-hD3 (c, triangles) construct. The plots shown were analyzed by linear regression. See Fig. 10 for quantitative analysis.
FIGURE 8.
FIGURE 8.
Role of TMD IV in hD3-hD3 interactions. a, tertiary structure of hD3 with TMD IV residues that were mutated to alanine shown as sticks. b and c, the primary structure of TMD IV is presented via the one-letter amino acid code. Amino acids that were replaced with alanine are in bold and are denoted by their position in the primary sequence of hD3. Tryptophan 4.50 is also indicated. HtrFRET assays performed in HEK293T cells transfected with increasing amounts of VSV-SNAP-hD3 (b and c, circles) and either Arg-148,Leu-152,Val-159 VSV-SNAP-hD3 (b, squares) or Arg-149,Leu-160 VSV-SNAP-hD3 (c, squares) construct. The plots shown were analyzed by linear regression. See Fig. 10 for quantitative analysis.
FIGURE 9.
FIGURE 9.
Roles of TMD VI and TMD VII in hD3-hD3 interactions. a, tertiary structure of hD3 with TMD VI residues that were mutated to alanine shown as sticks. b, the primary structure of TMD VI is presented via the one-letter amino acid code. Amino acids that were replaced with alanine are in bold and are denoted by their position in the primary sequence of hD3. Proline 6.50 is also indicated. c, tertiary structure of hD3 with TMD VII residues that were mutated to alanine shown as sticks. d, the primary structure of TMD VII is presented via the one-letter amino acid code. Amino acids that were replaced with alanine are in bold and are denoted by their position in the primary sequence of hD3. Proline 7.50 is also indicated. HtrFRET assays performed in HEK293T cells transfected with increasing amounts of VSV-SNAP-hD3 (b and d, circles) or Leu-347,Thr-348,Leu-351 VSV-SNAP-hD3 (b, squares), or Trp-370,Leu-371,Val-374 VSV-SNAP-hD3 (d, squares) construct. The plots shown were analyzed by linear regression. See Fig. 10 for quantitative analysis.
FIGURE 10.
FIGURE 10.
Many regions of the helical domains of hD3 contribute to effective oligomerization. The slope values of 665 nm over 620 nm fluorescence emission for each mutant described in Figs. 5–9 were normalized to those obtained with VSV-SNAP-hD3 (which was included as control in each individual experiment). Data are the means ± S.E. of at least three independent experiments. Statistical analysis was performed by one-way analysis of variance, with Dunnett's test for multiple comparisons where appropriate, for example when comparing VSV-SNAP-hD3, Phe-394,Leu-395 VSV-SNAP-hD3, and Phe-394,Leu-395,Lys-396 VSV-SNAP-hD3 to Phe-394 VSV-SNAP-hD3. ns, not significant. p < 0.05 (*) and p < 0.0001 (***) compared with VSV-SNAP-hD3 or to the indicated receptor. Mutants that produce a significant reduction in the slope are predicted to contain residues that contribute to the organizational structure of hD3.
FIGURE 11.
FIGURE 11.
Molecular modeling of potential dimeric arrangement: the TMD I-TMD II-helix VIII interface. Center panel, general view of a model of an hD3 dimer generated by TMD I-TMD II and helix VIII residues (opaque light and dark gray) as the interacting interfaces (upper panel) and organized with a β1-adrenoreceptor-like arrangement (lower panel). Residues in gray sticks are those that produced htrFRET reduction when mutated to alanine. Yellow sticks and spheres show cholesterols as observed in β2-adrenoreceptor and serotonin 5-HT2B atomic level receptor structures. Inset (i) indicates residues from the extracellular side of TMD I and TMD II as well as external loop 1 that when mutated reduce htrFRET. Arg-1.30 from 1 hD3 protomer forms hydrogen bonds with Tyr-2.63, Thr-2.67, and Asn-97 of external loop 1. His-1.32 interacts with the same residue of the other protomer. Leu-1.37 and Cys-1.40 form a hydrophobic interaction between protomers. Inset (ii) shows details of the intracellular side of TMD I and helix VIII. Leu-1.44 interacts both with the same residue of the other protomer and with Ile-1.43, Val-1.47, and Phe-1.48 via a cholesterol molecule (yellow sticks and sphere). Phe-8.54, Leu-8.55, and Lys-8.56 form an extended interacting surface between helix VIII from each monomer.
FIGURE 12.
FIGURE 12.
Molecular modeling of potential dimeric arrangement: the TMD IV-TMD V interface. Left panel, general view of a model of a hD3 dimer that employs residues from TMD IV and TMD V (opaque light and dark gray) as interacting surfaces (upper panel) and organized with a β1-adrenoreceptor-like arrangement (lower panel). Residues in gray sticks when mutated to alanine induce htrFRET reduction; yellow sticks indicate a possible cholesterol molecule mediating the interaction between protomers. Right panel, detail of the interaction between protomers. Residues of TMD IV extensively interact with a cholesterol molecule, positioned as observed in the P2Y12 receptor atomic level structure, whereas only Arg-5.60 is actively involved in this interacting interface (indeed adding Val-5.63 and Lys-5.66 to the Arg-5.60 and Tyr-5.62 mutant did not further reduce htrFRET).
FIGURE 13.
FIGURE 13.
Molecular modeling of hD3 in tetrameric arrangements. Model of hD3 in a tetrameric arrangement as result of a dimer + dimer interactions. Each dimer is shown as a semi-transparent surface, whereas predicted cholesterols are shown as yellow spheres forming a buffer between the two dimers. Inset (i) shows details of the TMD VI and TMD VII interface, and the residues shown in sticks (gray and light blue) were found experimentally to affect hD3 quaternary structure. Yellow sticks and spheres depict predicted cholesterol molecules in positions as observed in adenosine A2A receptor, μ-opioid receptor, and the P2Y12 receptor structures. Inset (ii) shows details of the predicted interaction between TMD V Arg-5.60 and Tyr-5.63 (in gray sticks) of one dimer and the TMD I cholesterol (in yellow sticks and spheres). A predicted palmitoyl moiety, bound to Cys-8.60, is also shown in magenta semi-transparent sticks.

Similar articles

Cited by

References

    1. Milligan G. (2013) The prevalence, maintenance, and relevance of G protein-coupled receptor oligomerization. Mol. Pharmacol. 84, 158–169 - PMC - PubMed
    1. Ferré S., Casadó V., Devi L. A., Filizola M., Jockers R., Lohse M. J., Milligan G., Pin J. P., Guitart X. (2014) G protein-coupled receptor oligomerization revisited: functional and pharmacological perspectives. Pharmacol. Rev. 66, 413–434 - PMC - PubMed
    1. Milligan G. (2004) G protein-coupled receptor dimerization: function and ligand pharmacology. Mol. Pharmacol. 66, 1–7 - PubMed
    1. Milligan G. (2009) G protein-coupled receptor hetero-dimerization: contribution to pharmacology and function. Br. J. Pharmacol. 158, 5–14 - PMC - PubMed
    1. Lohse M. J. (2010) Dimerization in GPCR mobility and signaling. Curr. Opin. Pharmacol. 10, 53–58 - PubMed

Publication types

Substances