. 2015 Jun 5;290(23):14679-91.
doi: 10.1074/jbc.M115.643817. Epub 2015 Apr 30.

Apelin Enhances Brown Adipogenesis and Browning of White Adipocytes

Affiliations

Apelin Enhances Brown Adipogenesis and Browning of White Adipocytes

Aung Than et al. J Biol Chem. .

Abstract

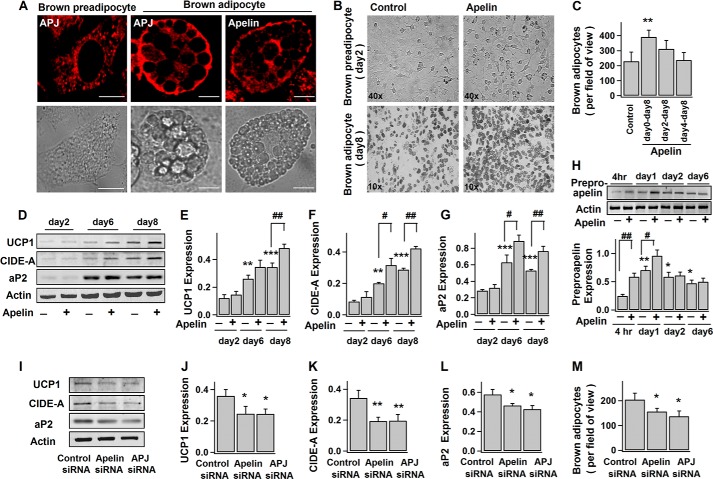
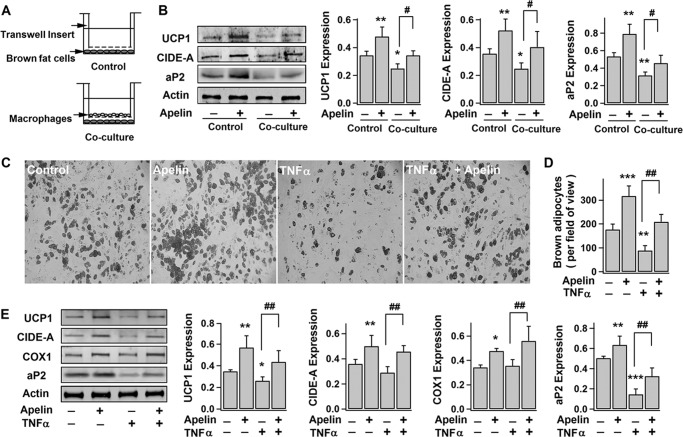
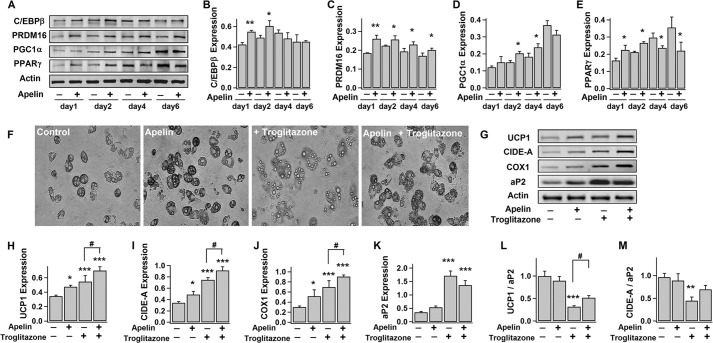
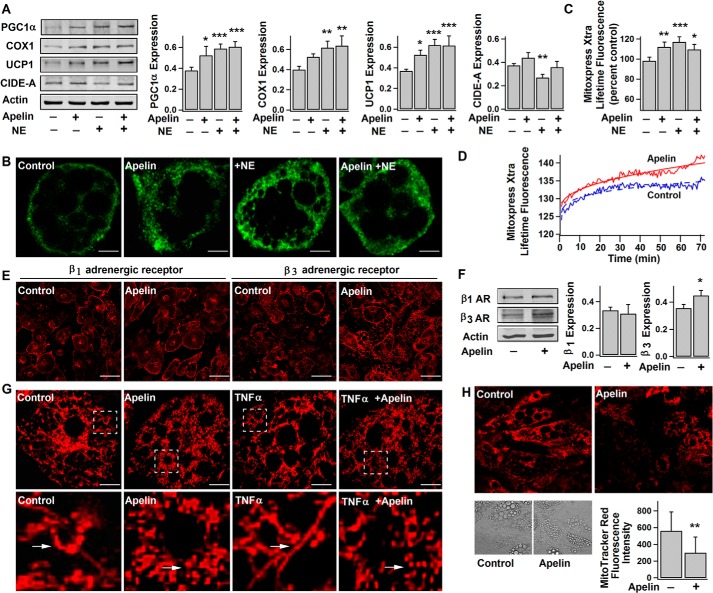
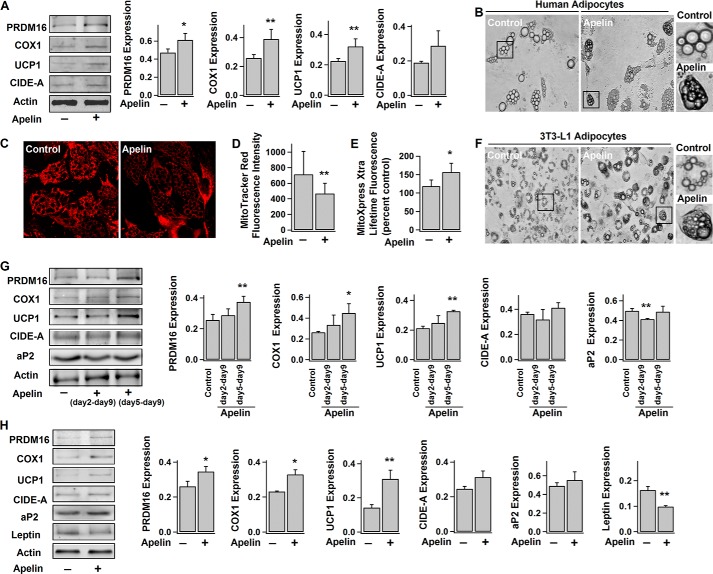
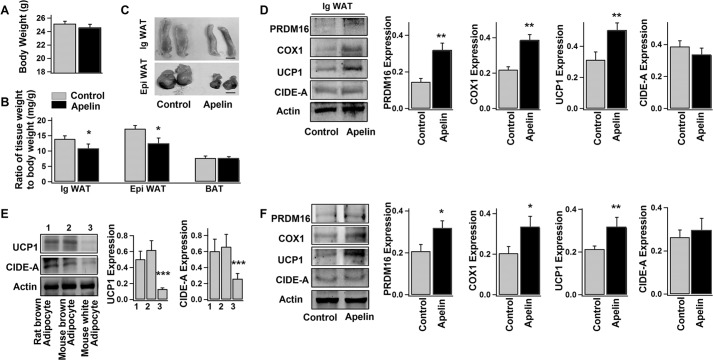
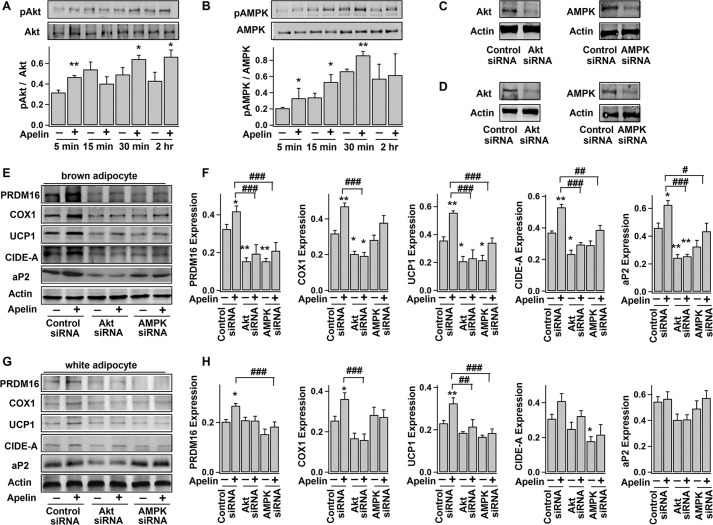
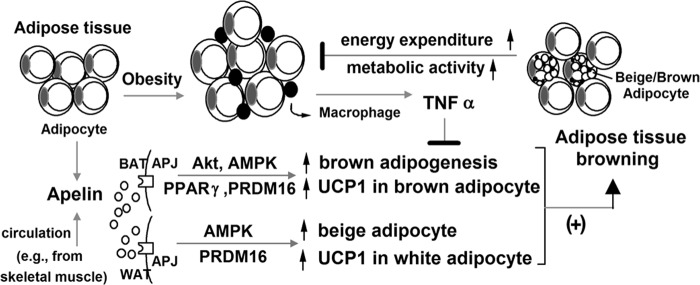
Brown adipose tissue expends energy in the form of heat via the mitochondrial uncoupling protein UCP1. Recent studies showed that brown adipose tissue is present in adult humans and may be exploited for its anti-obesity and anti-diabetes actions. Apelin is an adipocyte-derived hormone that plays important roles in energy metabolism. Here, we report that apelin-APJ signaling promotes brown adipocyte differentiation by increasing the expressions of brown adipogenic and thermogenic transcriptional factors via the PI3K/Akt and AMPK signaling pathways. It is also found that apelin relieves the TNFα inhibition on brown adipogenesis. In addition, apelin increases the basal activity of brown adipocytes, as evidenced by the increased PGC1α and UCP1 expressions, mitochondrial biogenesis, and oxygen consumption. Finally, we provide both in vitro and in vivo evidence that apelin is able to increase the brown-like characteristics in white adipocytes. This study, for the first time, reveals the brown adipogenic and browning effects of apelin and suggests a potential therapeutic route to combat obesity and related metabolic disorders.

Keywords: apelin, adipocyte, adipose tissue, browning, uncoupling protein 1, metabolic diseases.


Figures

FIGURE 1.
FIGURE 1.
Apelin-APJ receptor enhances brown adipocyte differentiation. A, confocal images of immunostained apelin and APJ receptor in brown fat cells and their corresponding bright field images. Scale bars, 10 μm. B–H, brown preadipocytes were induced to differentiate into adipocytes without (−) (control) or (+) with exposure to 100 nm pyr-apelin13 for different periods of time. B, representative images of brown preadipocytes (day 2) and adipocytes (day 8). C, number of brown adipocytes (multiloculated cells) (at day 8) per field of view (×10); mean ± S.E. (error bars) (n = 4). D–G, time course of the protein expression levels during adipogenesis: UCP1 (∼33 kDa), CIDE-A (∼26 kDa), aP2 (∼16 kDa), and actin (∼42 kDa). The representative immunoblots and the statistics (mean ± S.E., n = 4) of the blot densities normalized to actin density (protein expressions at day 2 regarded as control). H, representative immunoblot of preproapelin (∼8 kDa) expression in brown fat cells at different stages of differentiation and the statistics (mean ± S.E., n = 4; blot densities were normalized to that of actin) (expression at 4 h as control). I–M, brown preadipocytes were transfected with control, apelin, or APJ siRNA 2–3 days before the induction of differentiation. The representative immunoblot of protein expressions (day 10) and the statistics (mean ± S.E., n = 4; blot densities were normalized to that of actin) are shown in I–L. The number of brown adipocytes (day 8) per field of view (×10) (mean ± S.E., n = 4) is shown in M. Each sample contains the same amount of total proteins (as the loading control). Using Student's t test, *, p < 0.05; **, p < 0.01 versus control; #, p < 0.05; ##, p < 0.01 between the indicated pairs.
FIGURE 2.
FIGURE 2.
Apelin improves TNFα- and macrophage-impaired brown adipocyte differentiation. A and B, brown preadipocytes were co-cultured with primary rat macrophages during the first 2 days of differentiation, followed by continuing differentiation for 8 days. A, illustration of Transwell co-culturing system. The representative immunoblots of protein expressions (UCP1, CIDE-A, aP2, actin) (day 10) in brown adipocytes and the statistics (mean ± S.E. (error bars), n = 4) of blot densities normalized to that of actin are shown in B. C–E, brown preadipocytes were induced to differentiate into brown adipocytes for 8–10 days, without (−) (control) or with (+) exposure to pyr-apelin13 and/or 10 ng/ml TNFα. Shown are representative bright field images (C) and the number of brown adipocytes (at day 8) per field of view (×10) (mean ± S.E., n = 4) (D). The representative immunoblots of UCP1, CIDE-A, COX1 (∼57 kDa), aP2, and actin expressions (day 10) and the statistics (mean ± S.E., n = 4) of blot densities normalized to that of actin are shown in E. Using one-way ANOVA, *, p < 0.05; **, p < 0.01; ***, p < 0.001 versus control (no treatment); #, p < 0.05; ##, p < 0.01 between the indicated pairs.
FIGURE 3.
FIGURE 3.
Apelin increases the expressions of brown adipogenic and thermogenic transcriptional factors. A–E, time course of the expressions of C/EBPβ (∼45 kDa), PRDM16 (∼170 kDa), PGC1α (∼90 kDa), PPARγ (∼57 kDa), and actin during brown adipocyte differentiation, without (−) or with (+) exposure to pyr-apelin13. The representative immunoblots and the statistics (mean ± S.E. (error bars), n = 4; blot densities were normalized to actin density; *, p < 0.05; **, p < 0.01 versus untreated; Student's t test) are shown in A and B–E, respectively. F–M, brown preadipocytes were induced to differentiate into brown adipocytes for 8–10 days, without (−) (control) or with (+) exposure to pyr-apelin13 and/or 10 μm troglitazone (added at day 2). The representative bright field images of brown adipocytes and immunoblots of UCP1, CIDE-A, COX1, aP2, and actin expressions in brown adipocytes are shown in F and G, respectively. The statistics (mean ± S.E., n = 4) of the blot densities normalized to that of actin are shown in H–K. UCP1/aP2 and CIDE-A/aP2 are density ratios of UCP1, CIDE-A, and aP2 (L and M). Using one-way ANOVA, *, p < 0.05; **, p < 0.01; ***, p < 0.001 versus untreated; #, p < 0.05 between the indicated pairs.
FIGURE 4.
FIGURE 4.
Apelin increases UCP1 expression and basal metabolic activity in brown adipocytes. After 3–4 days without (−) (control) or with (+) exposure to pyr-apelin13, brown adipocytes (day 10) were treated without (−) or with (+) 1 μm NE for 6 h. A, representative immunoblots and statistics (mean ± S.E. (error bars), n = 4, blot densities were normalized to that of actin) of PGC1α, COX1, UCP1, CIDE-A, and actin expressions in brown adipocytes. Using one-way ANOVA, *, p < 0.05; **, p < 0.01; ***, p < 0.001 versus untreated. B, confocal images of immunostained UCP1 in differently treated brown adipocytes. Scale bars, 10 μm. C and D, lifetime fluorescence value of MitoXpress-Xtra assessed as an indication of O2 consumption rate in brown adipocytes. The statistics (mean ± S.E., n = 6 at 60 min) and the real-time responses of average fluorescence value are shown in C and D, respectively. E, confocal images of immunostained β1-AR and β3-AR in brown adipocytes. Scale bars, 50 μm. F, representative immunoblots of β1-AR (∼65 kDa) and β3-AR (∼44 kDa) expressions in brown adipocytes, and the statistics (mean ± S.E., n = 4) of the blot densities normalized to that of actin. G, the representative confocal images of mitochondria (detected by MitoTracker Red) (top lane) and their corresponding magnified images of insets (bottom lane) in brown adipocytes (day 10) after treatment without or with pyr-apelin13 and/or 10 ng/ml TNFα (2–3 days). Scale bars, 10 μm. H, the representative confocal images showing the changes of mitochondrial membrane potential (detected by MitoTracker Red) and the statistics of fluorescence intensity (mean ± S.E., n = 12 cells, from 3–4 independent experiments). Using Student's t test, *, p < 0.05; **, p < 0.01 versus untreated.
FIGURE 5.
FIGURE 5.
Apelin increases the browning characteristics in white adipocytes. A–E, human white adipocytes (day 14) were treated without (−) (control) or with (+) exposure to pyr-apelin13 for 4 days. F and G, 3T3-L1 adipocytes were treated without (−) (control) or with (+) exposure to pyr-apelin13 (days 2–9 or days 5–9). Shown are the representative immunoblots of protein expressions (PRDM16, COX1, UCP1, CIDE-A, ap2, and actin) in human (A) and 3T3-L1 adipocytes (G) with their respective statistics (mean ± S.E. (error bars), n = 4–5, normalized to actin density). B and F, representative bright field images of differently treated human and 3T3-L1 adipocytes. C and D, representative confocal images of human adipocytes showing the changes of mitochondrial membrane potential (detected by MitoTracker Red) and the statistics of fluorescence intensity (mean ± S.E., n = 12). E, lifetime fluorescence value of MitoXpress-Xtra assessed as an indication of OCR (mean ± S.E., n = 6, at 60 min) in human adipocytes. H, human mesenchymal stem cells were induced to differentiate into adipocytes without (−) or with (+) exposure to pyr-apelin13. Shown are the representative immunoblots of PRDM16, COX1, UCP1, CIDE-A, aP2, leptin (∼16 kDa), and actin expressions (day 14) and the statistics (mean ± S.E., n = 4–5, normalized to actin density). Using Student's t test, *, p < 0.05; **, p < 0.01 versus control/no treatment.
FIGURE 6.
FIGURE 6.
Both in vivo and in vitro mouse experiments confirm the apelin stimulation on WAT browning. Shown are average body weights (A) and weights of inguinal WAT (Ig WAT), epididymal WAT (Epi WAT), and interscapular BAT (B) relative to the total body weights of the control and apelin-treated mice (mean ± S.E. (error bars), n = 8 mice/group). C, representative images of inguinal WAT and epididymal WAT isolated from the control and apelin-treated mice. Scale bar, 4 mm. D, representative immunoblots of protein expressions (PRDM16, COX1, UCP1, CIDE-A, and actin) in inguinal WAT isolated from the control and apelin-treated mice and the statistics of the blot density normalized to that of actin (mean ± S.E., n = 4 mice/group). E, representative immunoblots and the statistics (mean ± S.E., n = 3) of UCP1 and CIDE-A expressions in adipocytes (day 10) differentiated from different preadipose cells (1, preadipocytes isolated from rat interscapular BAT; 2, mouse interscapular BAT; 3, mouse inguinal WAT). F, representative immunoblots of protein expressions (PRDM16, COX1, UCP1, CIDE-A, and actin) and the respective statistics (mean ± S.E., n = 4, normalized to actin density) from the white adipocytes (day 8, differentiated from preadipocytes of mouse inguinal WAT) treated without (−) (control) or with (+) pyr-apelin13 for 4 days. Using Student's t test, *, p < 0.05; **, p < 0.01; ***, p < 0.001 versus control.
FIGURE 7.
FIGURE 7.
Signaling pathways underlying the apelin-induced brown adipocyte differentiation and browning characteristics of white adipocytes. A and B, time course of the phosphorylation and total protein levels of Akt (∼60 kDa) and AMPK (∼62 kDa) during brown adipocyte differentiation, without (−) (control) or with (+) exposure to pyr-apelin13. Top panels, representative immunoblots; bottom panels, statistics (mean ± S.E. (error bars), n = 3) of the optical density ratio between pAkt and Akt or between pAMPK and AMPK (*, p < 0.05; **, p < 0.01 versus control; Student's t test). C and D, Western blot analyses of Akt and AMPK expressions in brown preadipocytes (C) and 3T3-L1 adipocytes (D), 2 days after transfection with control siRNA, Akt siRNA, or AMPK siRNA. E and F, brown preadipocytes were transfected with control siRNA, Akt siRNA, or AMPK siRNA 1–2 days before they were induced to differentiate into adipocytes, without (−) (control) or (+) with exposure to pyr-apelin13. Shown are representative immunoblots and the statistics (mean ± S.E., n = 4, normalized to actin density) of PRDM16, COX1, UCP1, CIDE-A, aP2, and actin expressions in differentiated brown adipocytes (day 10). G and H, 3T3-L1 adipocytes (day 4) were transfected with control siRNA, Akt siRNA, or AMPK siRNA, 1–2 days before treatment without (−) (control) or with (+) pyr-apelin13 (for 4 days). The representative immunoblots and the statistics (mean ± S.E., n = 4, normalized to actin density) are shown accordingly. Using one-way ANOVA, *, p < 0.05; **, p < 0.01 versus control; #, p < 0.05; ##, p < 0.01; ###, p < 0.001 between the indicated pairs.
FIGURE 8.
FIGURE 8.
Apelin-induced adipose tissue browning.

References

    1. Chechi K., Carpentier A. C., Richard D. (2013) Understanding the brown adipocyte as a contributor to energy homeostasis. Trends Endocrinol. Metab. 24, 408–420 - PubMed
    1. Lidell M. E., Enerbäck S. (2010) Brown adipose tissue: a new role in humans? Nat. Rev. Endocrinol. 6, 319–325 - PubMed
    1. Cypess A. M., Lehman S., Williams G., Tal I., Rodman D., Goldfine A. B., Kuo F. C., Palmer E. L., Tseng Y. H., Doria A., Kolodny G. M., Kahn C. R. (2009) Identification and importance of brown adipose tissue in adult humans. N. Engl. J. Med. 360, 1509–1517 - PMC - PubMed
    1. van Marken Lichtenbelt W. D., Vanhommerig J. W., Smulders N. M., Drossaerts J. M., Kemerink G. J., Bouvy N. D., Schrauwen P., Teule G. J. (2009) Cold-activated brown adipose tissue in healthy men. N. Engl. J. Med. 360, 1500–1508 - PubMed
    1. Yoneshiro T., Aita S., Matsushita M., Kayahara T., Kameya T., Kawai Y., Iwanaga T., Saito M. (2013) Recruited brown adipose tissue as an antiobesity agent in humans. J. Clin. Invest. 123, 3404–3408 - PMC - PubMed

Publication types

MeSH terms