. 2015 Jun 5;348(6239):1155-60.
doi: 10.1126/science.aaa5111. Epub 2015 Apr 30.

Cell biology. Reversible centriole depletion with an inhibitor of Polo-like kinase 4

Affiliations

Cell biology. Reversible centriole depletion with an inhibitor of Polo-like kinase 4

Yao Liang Wong et al. Science. .

Abstract

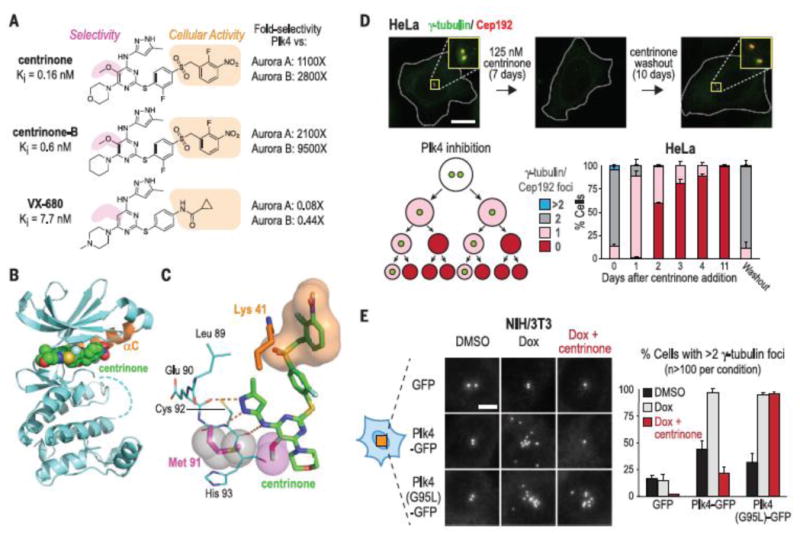
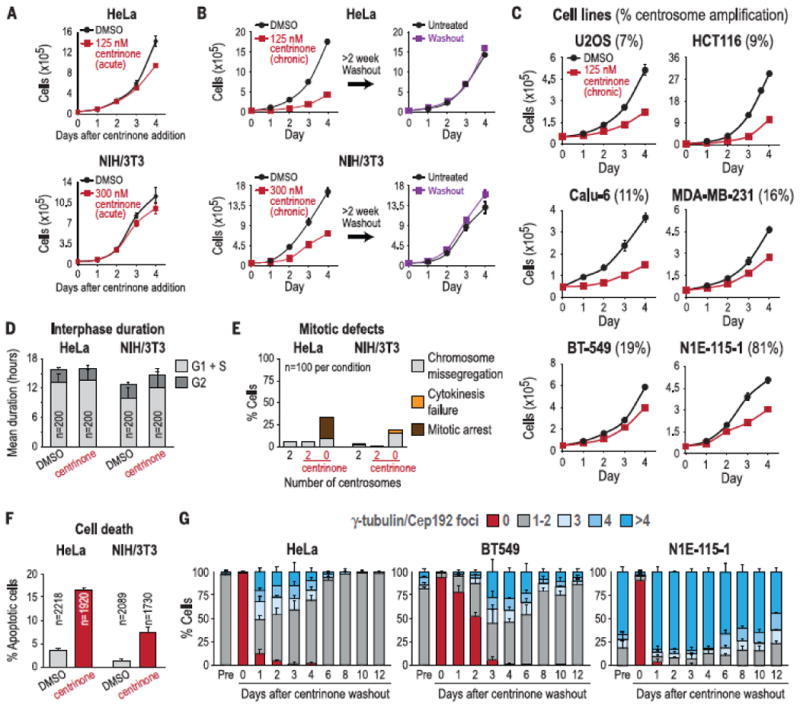
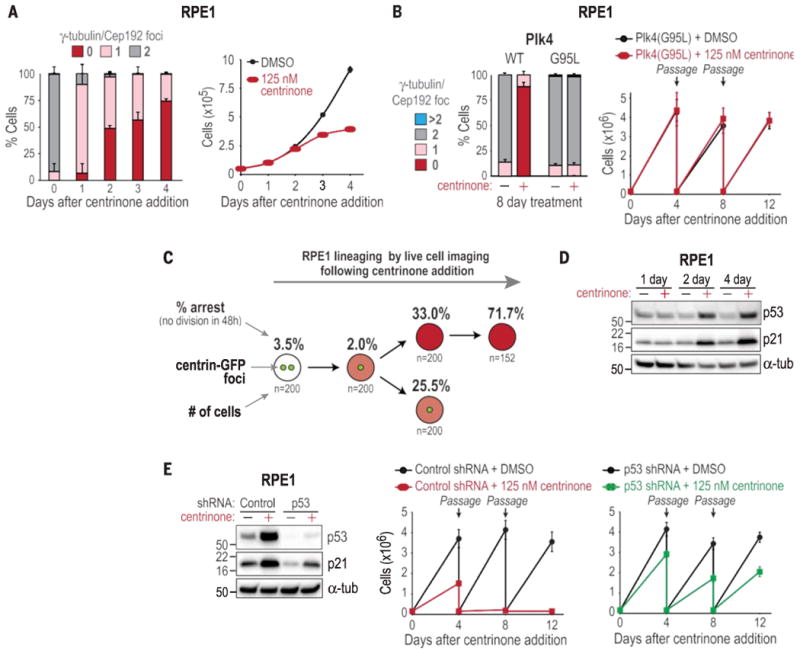
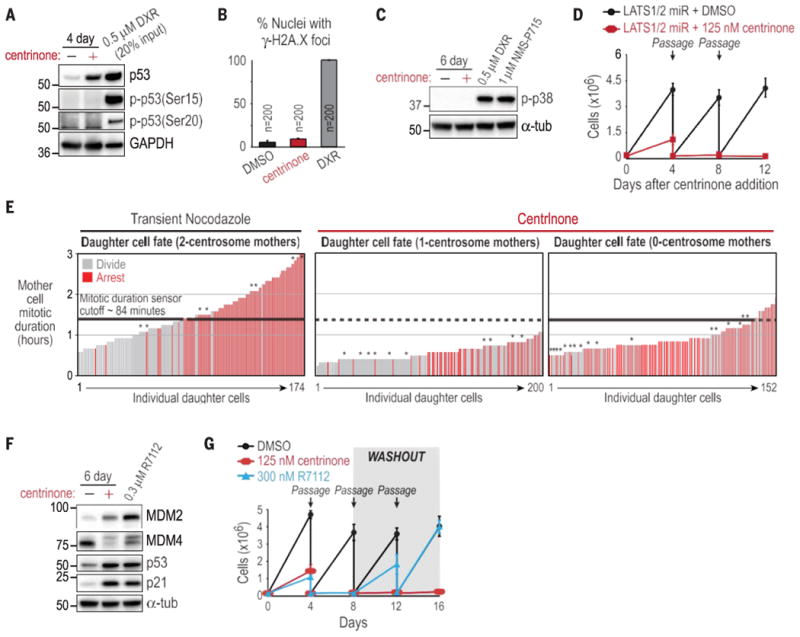
Centrioles are ancient organelles that build centrosomes, the major microtubule-organizing centers of animal cells. Extra centrosomes are a common feature of cancer cells. To investigate the importance of centrosomes in the proliferation of normal and cancer cells, we developed centrinone, a reversible inhibitor of Polo-like kinase 4 (Plk4), a serine-threonine protein kinase that initiates centriole assembly. Centrinone treatment caused centrosome depletion in human and other vertebrate cells. Centrosome loss irreversibly arrested normal cells in a senescence-like G1 state by a p53-dependent mechanism that was independent of DNA damage, stress, Hippo signaling, extended mitotic duration, or segregation errors. In contrast, cancer cell lines with normal or amplified centrosome numbers could proliferate indefinitely after centrosome loss. Upon centrinone washout, each cancer cell line returned to an intrinsic centrosome number "set point." Thus, cells with cancer-associated mutations fundamentally differ from normal cells in their response to centrosome loss.


Figures

Fig. 1
Fig. 1
Centrinone is a selective Plk4 inhibitor that reversibly depletes centrioles from cells. (A) Chemical structures, Ki values, and selectivities [Plk4 versus Aurora A/B; Ki (kinase)/Ki (Plk4)] of the centrinones and VX-680 (B) Crystal structure of the centrinone-Plk4 kinase domain complex (orange αC helix). (C) Close-up of centrinone in the Plk4 active site. The aminopyrazole moiety of centrinone hydrogen bonds (orange dashes) with the main chain carbonyl of Glu90 and the carbonyl and amide nitrogen of Cys92. The 5-methoxy substituent (magenta spheres) packs against the Met91 side chain (magenta stick and gray spheres). The benzyl sulfone moiety (orange surface) wraps around Lys41 (orange). (D) HeLa cells 7 days after centrinone addition and 10 days after centrinone washout. (Insets: 3.3× magnified). Scale bar, 10 mm. Schematic shows progressive centrosome depletion after Plk4 inhibition. Bar graph shows the centrosome number distribution after centrinone addition and washout. (E) g-Tubulin foci in NIH/3T3 cells induced to overexpress wild-type or centrinone-resistant (G95L) Plk4-GFP. Scale bar, 5 mm. Data in (D) and (E) are means T SD; number of experiments (N) = 3.
Fig. 2
Fig. 2
Transformed cells proliferate indefinitely in the absence of centrosomes. (A) Proliferation curves of HeLa and NIH/3T3 cells immediately after addition of centrinone or DMSO (control). (B) Proliferation curves after chronic (>2 weeks) centrinone treatment (left), or after chronic centrinone treatment followed by drug washout for >2 weeks (right). (C) Proliferation curves after chronic (>2 weeks) centrinone treatment in cell lines with varying degrees of centrosome amplification. Numbers in parentheses are percentages of cells exhibiting centrosome amplification in untreated population. Data in (A) to (C) are means T SEM (N = 3). (D) G1+S and G2 durations measured in HeLa and NIH/3T3 cells coexpressing GFP-PCNA and H2B-RFP (see fig. S6). Data are means T SD. (E) Percentage of cells exhibiting mitotic defects measured in HeLa and NIH/3T3 cells coexpressing centrin-GFP and H2B-RFP (see fig. S7). (F) Percentage of cells undergoing cell death in HeLa and NIH/3T3 cells, measured by using a fluorescent caspase substrate. Data are means T SD (N = 2). (G) Graphs showing centrosome number distribution over time after centrinone washout from HeLa, BT-549, and N1E-115-1 cells treated long-term (>2 weeks). The centrosome number distribution in untreated cells (“Pre” bars) is also shown for each cell line. Data are means T SD (N = 3).
Fig. 3
Fig. 3
Centrosome loss triggers a p53-dependent arrest in normal cells. (A) Centro- some number distribution (left; data are means T SD; N = 3) and proliferation (right, data are means T SEM; N = 3) of RPE1 cells after centrinone addition. (B) (left) Centro- some number distribution in RPE1 cells expressing WT or centrinone-resistant G95L (homozygous knock-in at the endogenous locus) Plk4. (Right) Passaging assay on RPE1 Plk4 G95L cells. Data are means T SD (N = 2). (C) Lineage analysis showing the percentage of RPE1 cells with the indicated number of centrosomes arresting in each generation after centrinone addition (N = 2). Cells coexpressing centrin-GFP and H2B-RFP were initially filmed in both GFP and RFP channels to count centrosomes and monitor mother cell mitosis. Daughter cell fate was subsequently tracked by using RFP only. Arrest was the inability to enter mitosis within 48 hours of cell birth. (D) Western blot of p53 and p21 in RPE1 cells. a-tub, a-tubulin. (E) Western blot of RPE1 cells expressing control or p53 shRNA, and passaging assay of RPE1 cells expressing control or p53 shRNA after centrinone addition. Data are means T SD (N = 2).
Fig. 4
Fig. 4
The irreversible G1 arrest after centrosome loss occurs via an unidentified mechanism. (A) Western blot for p53 phosphoepitopes associated with DNA damage in RPE1 cells treated with centrinone or doxorubicin as a positive control. (B) Quantification of g-H2A.X foci in RPE1 nuclei. Data are means T SD (N = 3). (C) Western blot of activated p38 in RPE1 cells. (D) Passaging assay of RPE1 cells expressing LATS1/2 microRNA, after addition of centrinone. (E) Daughter cell fate in RPE1 cells coexpressing centrin-GFP and H2B-RFP. Vertical bars represent measurements from individual daughter cells. Bar height is the time their mother spent in mitosis, and color indicates arrest (red) or division (gray). Asterisks indicate chromosome missegregation in the mother cell. Daughter cell fate after nocodazole treatment of mother cells with a normal two-centrosome complement (left) confirms the existence of a mitotic duration sensor that arrests daughter cells if the mother cell spends more than ∼84 min (black dashed lines on all plots) in mitosis. (F) Western blot of RPE1 cells treated with centrinone or R7112. (G) Passaging assay of RPE1 cells after addition (day 0) and washout (day 8) of centrinone or R7112. Data in (D) and (G) are means T SD (N = 2).

Comment in

References

    1. Drummond IA. Curr Opin Cell Biol. 2012;24:24–30. - PMC - PubMed
    1. Schatten H. Histochem Cell Biol. 2008;129:667–686. - PMC - PubMed
    1. Brito DA, Gouveia SM, Bettencourt-Dias M. Curr Opin Cell Biol. 2012;24:4–13. - PubMed
    1. Färat-Karalar EN, Stearns T. Philos Trans R Soc Lond B Biol Sci. 2014;369:20130460. - PMC - PubMed
    1. Boveri T. Zur Frage der Entstehung maligner Tumoren. Gustav Fischer Verlag; Jena, Germany: 1914.

Publication types

Associated data