. 2015 Jun 5;348(6239):1160-3.
doi: 10.1126/science.aaa1356. Epub 2015 Apr 30.

Aging stem cells. A Werner syndrome stem cell model unveils heterochromatin alterations as a driver of human aging

Affiliations

Aging stem cells. A Werner syndrome stem cell model unveils heterochromatin alterations as a driver of human aging

Weiqi Zhang et al. Science. .

Erratum in

Abstract

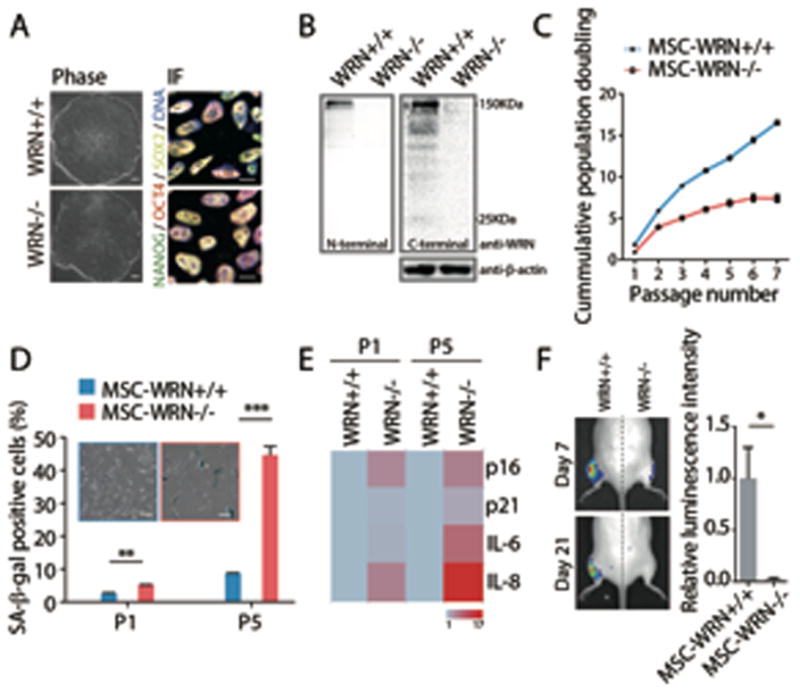
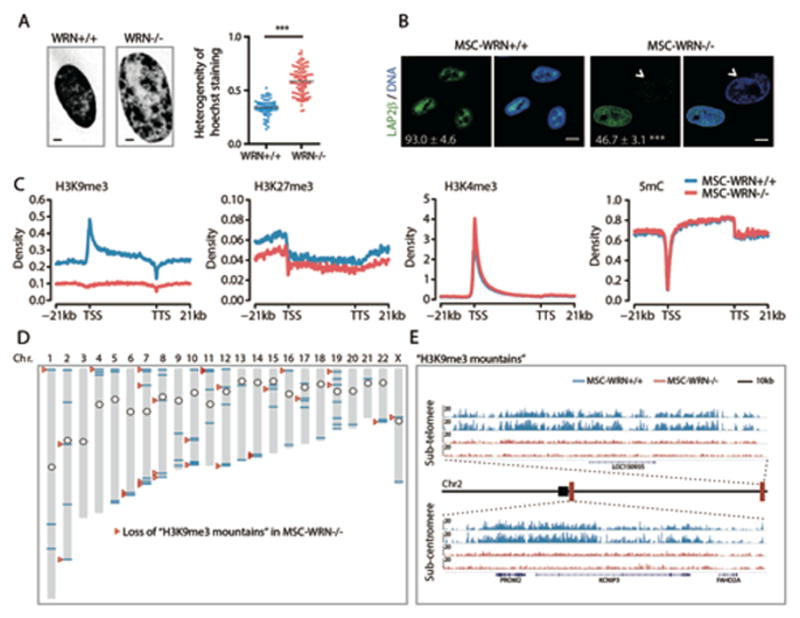
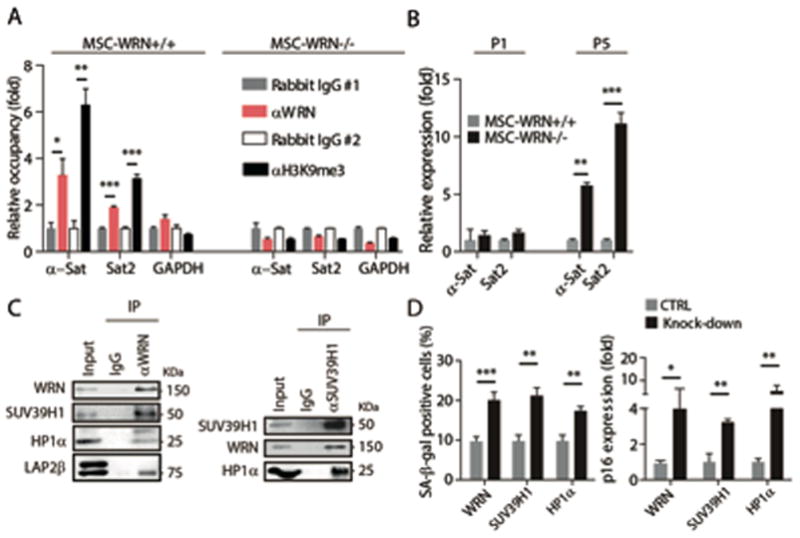
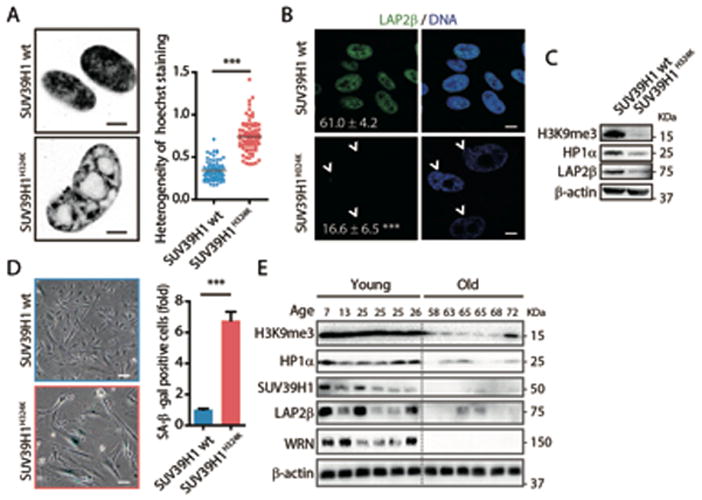
Werner syndrome (WS) is a premature aging disorder caused by WRN protein deficiency. Here, we report on the generation of a human WS model in human embryonic stem cells (ESCs). Differentiation of WRN-null ESCs to mesenchymal stem cells (MSCs) recapitulates features of premature cellular aging, a global loss of H3K9me3, and changes in heterochromatin architecture. We show that WRN associates with heterochromatin proteins SUV39H1 and HP1α and nuclear lamina-heterochromatin anchoring protein LAP2β. Targeted knock-in of catalytically inactive SUV39H1 in wild-type MSCs recapitulates accelerated cellular senescence, resembling WRN-deficient MSCs. Moreover, decrease in WRN and heterochromatin marks are detected in MSCs from older individuals. Our observations uncover a role for WRN in maintaining heterochromatin stability and highlight heterochromatin disorganization as a potential determinant of human aging.


Figures

Fig. 1
Fig. 1. WRN-deficient MSCs exhibit phenotypes associated with premature cellular senescence
(A) Morphology and immunofluorescence analyses of pluripotency markers in ESCs. Scale bar, 100 μm and 10 μm, respectively. (B) Western blot analysis of WRN expression in ESCs using anti-WRN N-terminal (ab200) and C-terminal (SC-5629) antibodies. (C) Growth curve analyzing the accumulative population doubling of MSCs. (D) Senescence-associated (SA)-β-gal staining in passage 1 (P1) and P5 MSCs. Scale bar, 50μm. (E) Quantitative RT-PCR analysis of the indicated genes in P1 and P5 MSCs. Transcript levels were normalized to MSCs-WRN+/+ group. Genes with greater mean value are color coded towards red. (F) Photon flux from muscle of NOD-SCID mouse transplanted with MSCs-WRN+/+ (left) and MSCs-WRN−/− (right) expressing luciferase. All data are represented as mean + SEM. *P<0.05, **P<0.01, ***P<0.001 by t test; n=3.
Fig. 2
Fig. 2. Epigenomic analyses of WRN-deficient MSCs
(A) Left, Chromatin structure of MSCs shown by Hoechst 33342 staining of the nucleus. Scale bar, 5μm.; Right, C.V. value of nuclear Hoechst staining intensity used to evaluate the heterogeneity (pixel-to-pixel variation) of Hoechst intensity. (B) Immunofluorescence analyses of LAP2β expression in MSC-WRN+/+ and MSC-WRN−/− at P5. Arrowheads denote abnormal nuclei with decreased LAP2β expression (percentage of LAP2β–positive nuclei in corner). Scale bar, 10 μm. (C) Enrichment of H3K9me3, H3K27me3, H3K4me3, and 5mC on the gene bodies and 21kb upstream of TSS and 21kb downstream of TTS regions in human genome. (D) Sketch map of “H3K9me3 mountain” distribution over 23 chromosomes. The blue lines indicate 73 “H3K9me3 mountains” present in MSCs-WRN+/+ whereas 48 (65.8%) of them are localized within 5 Mb regions around the telomeres or centromeres. The red arrowheads indicate 28 “H3K9me3 mountains” which are lost in MSCs-WRN−/−. The circles indicate the centromeres of chromosomes. (E) Representative images showing two “H3K9me3 mountains” on chromosome 2 in the sub-telomere or sub-centromere regions in P5 MSCs-WRN−/− and MSCs-WRN+/+. Two biological replicates of each sample are presented. Black square denotes the centromere; red rectangles denote the position of the presented sub-telomere and sub-centromere regions, respectively. All data are represented as mean + SEM. ***P<0.001 by t test; n=3.
Fig. 3
Fig. 3. WRN associates with centromeric heterochromatin, and forms a molecular complex with SUV39H1 and HP1α
(A) Enrichment of WRN and H3K9me3 within the region of α-Sat or Sat2 as measured by ChIP-qPCR. (B) Quantitative RT-PCR analysis of centromeric repetitive element transcripts in MSCs at the indicated passages. (C) Left, co-immunoprecipitation of SUV39H1, HP1α, and LAP2β protein with endogenous WRN protein; Right, co-immunoprecipitation of WRN and HP1α with endogenous SUV39H1 in wild-type MSCs. (D) SA-β-gal staining (left) and p16 transcript (right) analyses in wild-type MSCs transduced with control lentiviral vector (CTRL) or lentiviral vector encoding for the indicated shRNA (Knock-down). All data are represented as mean + SEM. *P<0.05, **P<0.01, and ***P<0.001 by t test; n=3.
Fig. 4
Fig. 4. SUV39H1H324K mutant MSCs exhibit defective nuclear envelope and heterochromatin, as well as phenotypes of premature cellular senescence
(A) As described in Fig 2A, Left, Hoechst staining images of the nucleus; Right, C.V. value of nuclear Hoechst staining intensity used to evaluate the heterogeneity (pixel-to-pixel variation) of Hoechst intensity. (B) Immunofluorescence analyses of LAP2β expression in MSCs. Arrowheads denote the abnormal nuclei with decreased LAP2β (Percentages of normal nuclei presented at corner). Scale bar, 20 μm. (C) Western blot analysis of the indicated proteins in MSCs. (D) SA-β-gal staining in MSCs at P5. Scale bar, 50 μm. (E) Western blot analysis of the indicated proteins in human primary MSCs derived from old and young healthy individuals at P4 (see Table S4). All data are represented as mean + SEM. *P<0.05, ***P<0.001 by t test; n=3.

Comment in

References

    1. Kudlow BA, Kennedy BK, Monnat RJ., Jr Nat Rev Mol Cell Biol. 2007;8:394–404. - PubMed
    1. Lopez-Otin C, Blasco MA, Partridge L, Serrano M, Kroemer G. Cell. 2013;153:1194–1217. - PMC - PubMed
    1. Pegoraro G, et al. Nature cell biology. 2009;11:1261–1267. - PMC - PubMed
    1. Greer EL, et al. Nature. 2010;466:383–387. - PMC - PubMed
    1. Liu GH, et al. Nature. 2011;472:221–225. - PMC - PubMed

Publication types

MeSH terms