

Induction of Photosynthetic Carbon Fixation in Anoxia Relies on Hydrogenase Activity and Proton-Gradient Regulation-Like1-Mediated Cyclic Electron Flow in Chlamydomonas reinhardtii
- PMID: 25931521
- PMCID: PMC4453779
- DOI: 10.1104/pp.15.00105
Induction of Photosynthetic Carbon Fixation in Anoxia Relies on Hydrogenase Activity and Proton-Gradient Regulation-Like1-Mediated Cyclic Electron Flow in Chlamydomonas reinhardtii
Abstract
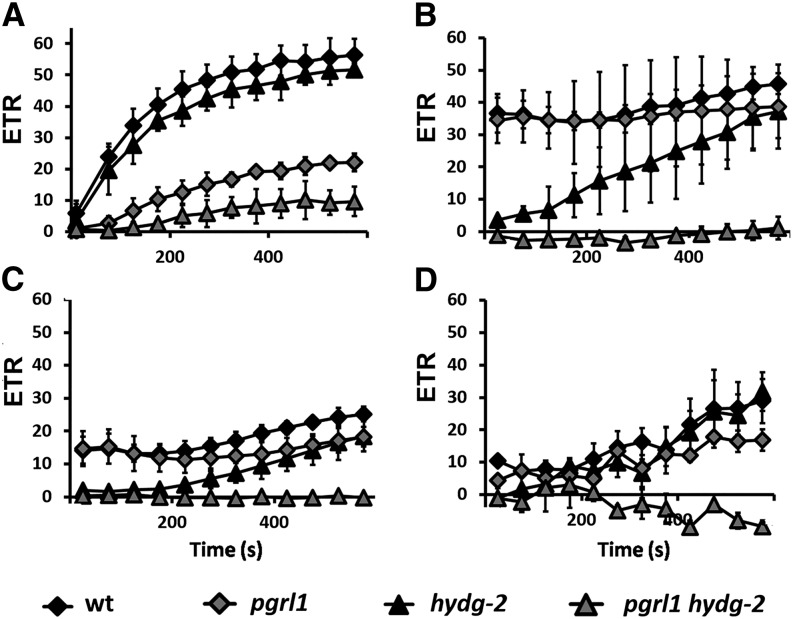
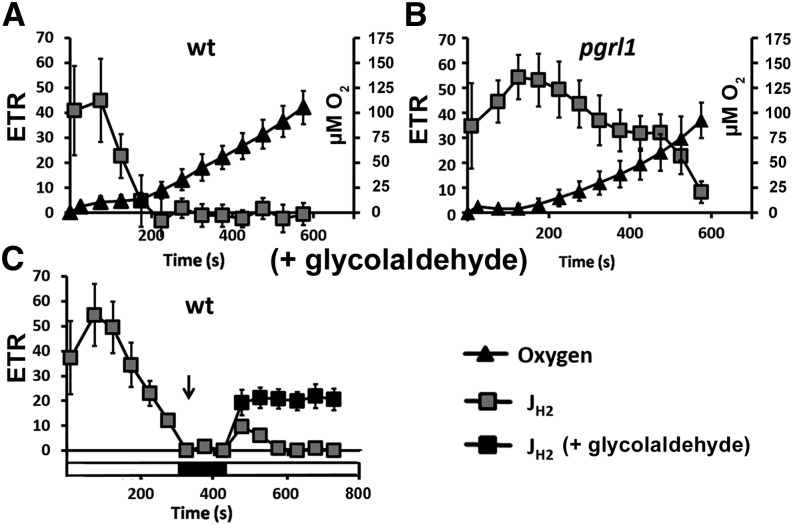
The model green microalga Chlamydomonas reinhardtii is frequently subject to periods of dark and anoxia in its natural environment. Here, by resorting to mutants defective in the maturation of the chloroplastic oxygen-sensitive hydrogenases or in Proton-Gradient Regulation-Like1 (PGRL1)-dependent cyclic electron flow around photosystem I (PSI-CEF), we demonstrate the sequential contribution of these alternative electron flows (AEFs) in the reactivation of photosynthetic carbon fixation during a shift from dark anoxia to light. At light onset, hydrogenase activity sustains a linear electron flow from photosystem II, which is followed by a transient PSI-CEF in the wild type. By promoting ATP synthesis without net generation of photosynthetic reductants, the two AEF are critical for restoration of the capacity for carbon dioxide fixation in the light. Our data also suggest that the decrease in hydrogen evolution with time of illumination might be due to competition for reduced ferredoxins between ferredoxin-NADP(+) oxidoreductase and hydrogenases, rather than due to the sensitivity of hydrogenase activity to oxygen. Finally, the absence of the two alternative pathways in a double mutant pgrl1 hydrogenase maturation factor G-2 is detrimental for photosynthesis and growth and cannot be compensated by any other AEF or anoxic metabolic responses. This highlights the role of hydrogenase activity and PSI-CEF in the ecological success of microalgae in low-oxygen environments.
© 2015 American Society of Plant Biologists. All Rights Reserved.
Figures


Similar articles
-
Control of hydrogen photoproduction by the proton gradient generated by cyclic electron flow in Chlamydomonas reinhardtii.Plant Cell. 2011 Jul;23(7):2619-30. doi: 10.1105/tpc.111.086876. Epub 2011 Jul 15. Plant Cell. 2011. PMID: 21764992 Free PMC article.
-
Proton gradient regulation 5-mediated cyclic electron flow under ATP- or redox-limited conditions: a study of ΔATpase pgr5 and ΔrbcL pgr5 mutants in the green alga Chlamydomonas reinhardtii.Plant Physiol. 2014 May;165(1):438-52. doi: 10.1104/pp.113.233593. Epub 2014 Mar 12. Plant Physiol. 2014. PMID: 24623849 Free PMC article.
-
Combined increases in mitochondrial cooperation and oxygen photoreduction compensate for deficiency in cyclic electron flow in Chlamydomonas reinhardtii.Plant Cell. 2014 Jul;26(7):3036-50. doi: 10.1105/tpc.114.126375. Epub 2014 Jul 2. Plant Cell. 2014. PMID: 24989042 Free PMC article.
-
Alternative electron flows (water-water cycle and cyclic electron flow around PSI) in photosynthesis: molecular mechanisms and physiological functions.Plant Cell Physiol. 2010 Dec;51(12):1951-63. doi: 10.1093/pcp/pcq173. Epub 2010 Nov 10. Plant Cell Physiol. 2010. PMID: 21068108 Review.
-
Regulatory network of proton motive force: contribution of cyclic electron transport around photosystem I.Photosynth Res. 2016 Sep;129(3):253-60. doi: 10.1007/s11120-016-0227-0. Epub 2016 Feb 8. Photosynth Res. 2016. PMID: 26858094 Review.
Cited by
-
Membrane Inlet Mass Spectrometry: A Powerful Tool for Algal Research.Front Plant Sci. 2020 Sep 4;11:1302. doi: 10.3389/fpls.2020.01302. eCollection 2020. Front Plant Sci. 2020. PMID: 33013952 Free PMC article.
-
Reciprocal regulation of photosynthesis and mitochondrial respiration by TOR kinase in Chlamydomonas reinhardtii.Plant Direct. 2019 Nov 14;3(11):e00184. doi: 10.1002/pld3.184. eCollection 2019 Nov. Plant Direct. 2019. PMID: 31832599 Free PMC article.
-
Water-splitting-based, sustainable and efficient H2 production in green algae as achieved by substrate limitation of the Calvin-Benson-Bassham cycle.Biotechnol Biofuels. 2018 Mar 19;11:69. doi: 10.1186/s13068-018-1069-0. eCollection 2018. Biotechnol Biofuels. 2018. PMID: 29560024 Free PMC article.
-
Absolute quantification of selected photosynthetic electron transfer proteins in Chlamydomonas reinhardtii in the presence and absence of oxygen.Photosynth Res. 2018 Aug;137(2):281-293. doi: 10.1007/s11120-018-0502-3. Epub 2018 Mar 28. Photosynth Res. 2018. PMID: 29594952
-
A PSII photosynthetic control is activated in anoxic cultures of green algae following illumination.Commun Biol. 2023 May 12;6(1):514. doi: 10.1038/s42003-023-04890-3. Commun Biol. 2023. PMID: 37173420 Free PMC article.
References
-
- Allen JF. (2003) Cyclic, pseudocyclic and noncyclic photophosphorylation: new links in the chain. Trends Plant Sci 8: 15–19 - PubMed
-
- Alric J. (2010) Cyclic electron flow around photosystem I in unicellular green algae. Photosynth Res 106: 47–56 - PubMed
-
- Alric J. (2014) Redox and ATP control of photosynthetic cyclic electron flow in Chlamydomonas reinhardtii. II. Involvement of the PGR5-PGRL1 pathway under anaerobic conditions. Biochim Biophys Acta 1837: 825–834 - PubMed
-
- Appel J, Phunpruch S, Steinmüller K, Schulz R (2000) The bidirectional hydrogenase of Synechocystis sp. PCC 6803 works as an electron valve during photosynthesis. Arch Microbiol 173: 333–338 - PubMed
-
- Arnon DI. (1955) The chloroplast as a complete photosynthetic unit. Science 122: 9–16 - PubMed
Publication types
MeSH terms
Substances
LinkOut - more resources
Full Text Sources
Other Literature Sources
