. 2015 Jun;168(2):598-614.
doi: 10.1104/pp.114.252908. Epub 2015 Apr 30.

An R2R3-MYB Transcription Factor Regulates Eugenol Production in Ripe Strawberry Fruit Receptacles

Affiliations

An R2R3-MYB Transcription Factor Regulates Eugenol Production in Ripe Strawberry Fruit Receptacles

Laura Medina-Puche et al. Plant Physiol. 2015 Jun.

Abstract

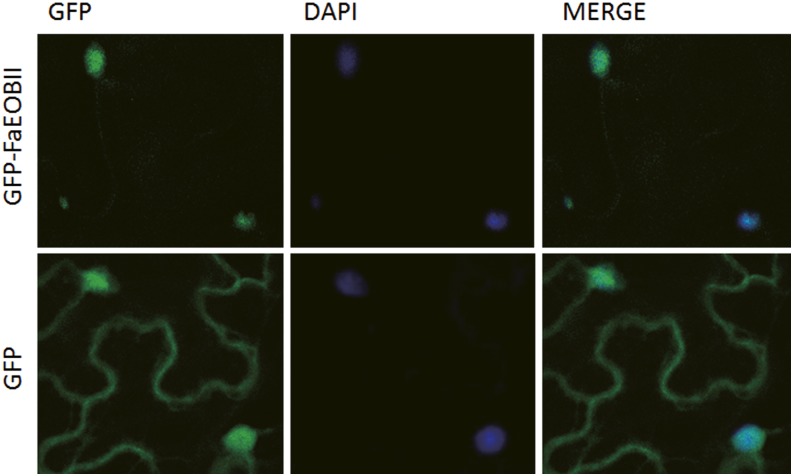
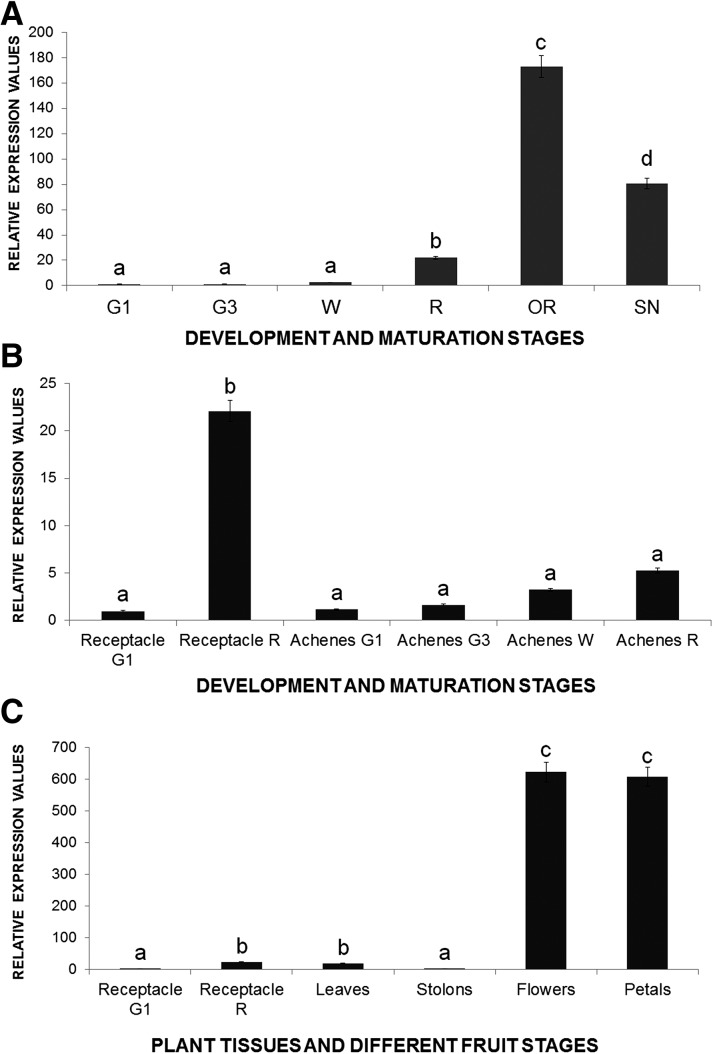
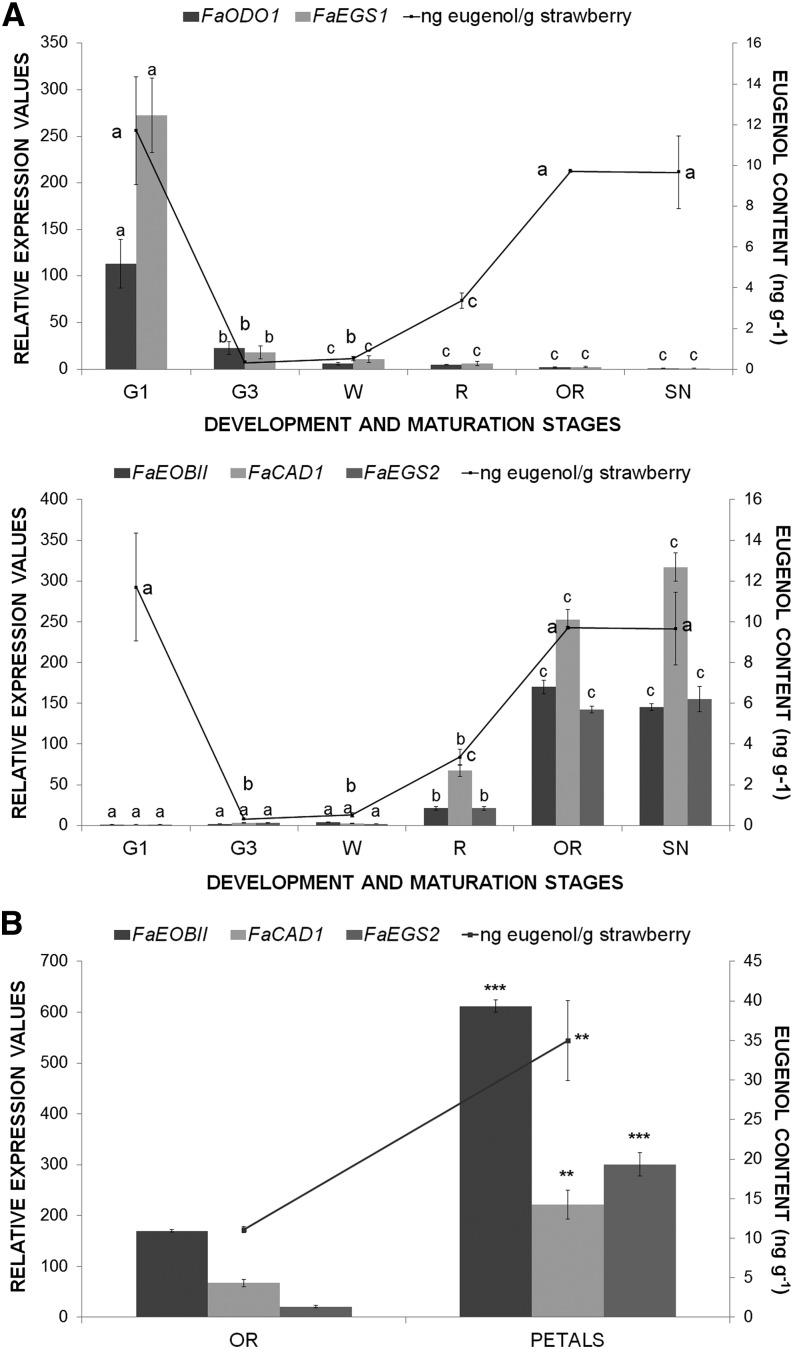
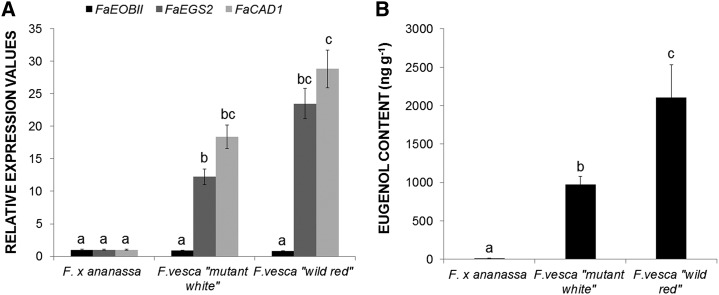
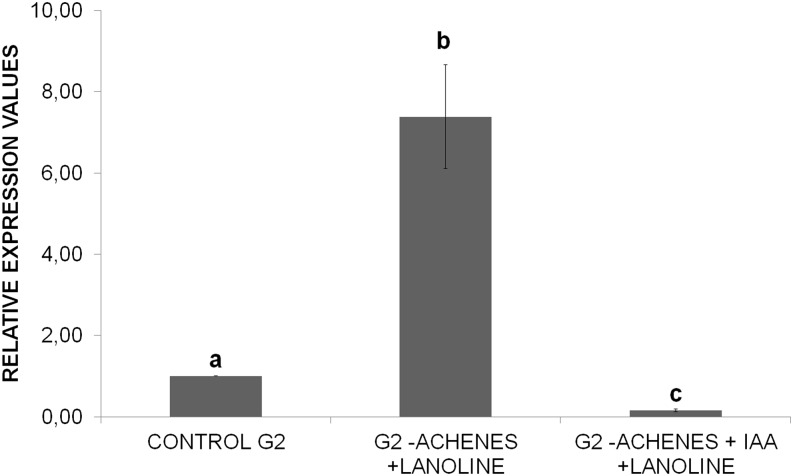
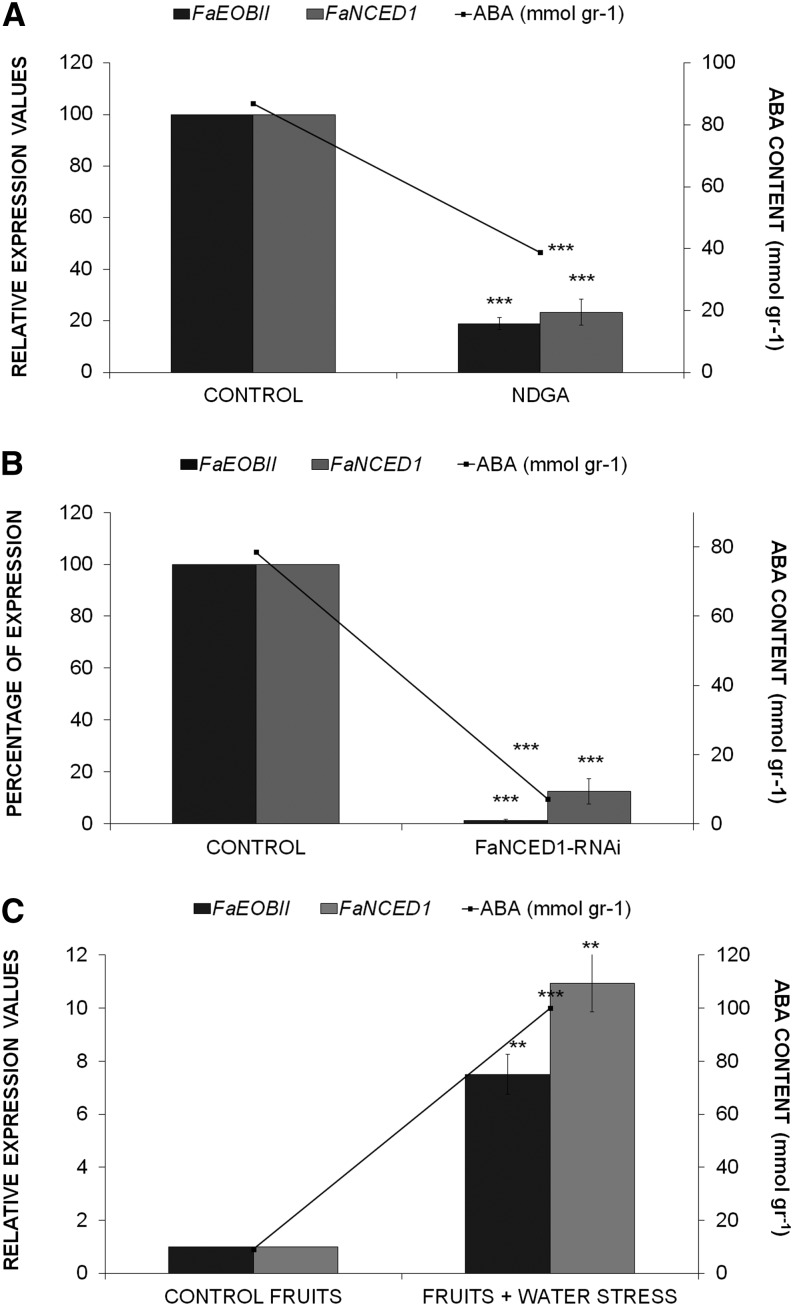
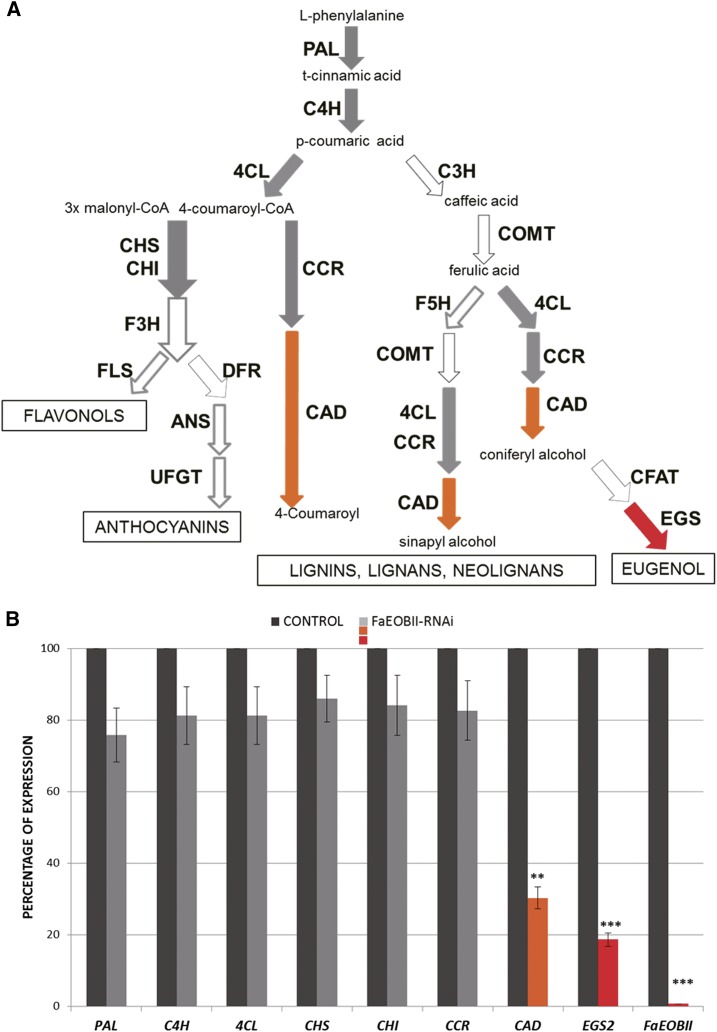
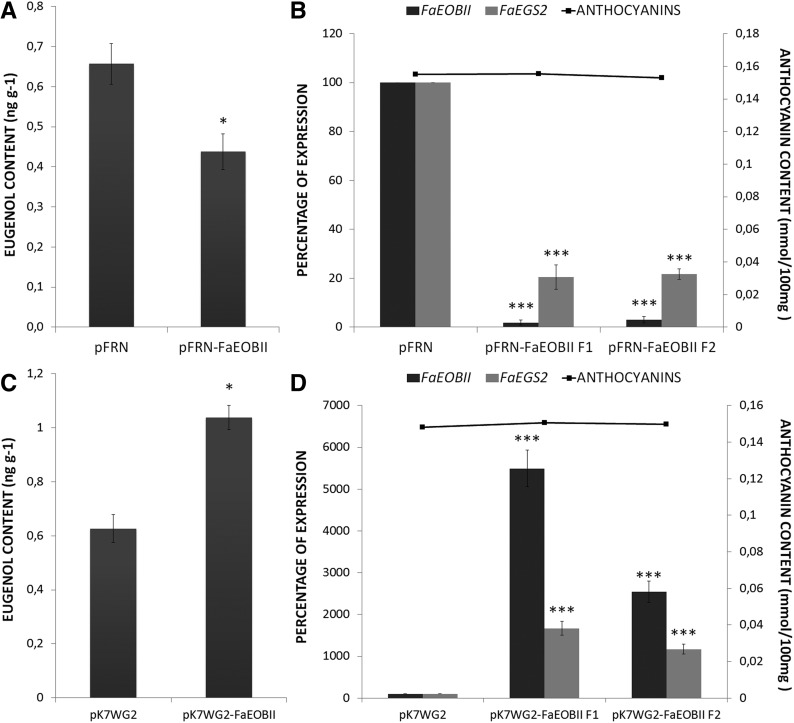
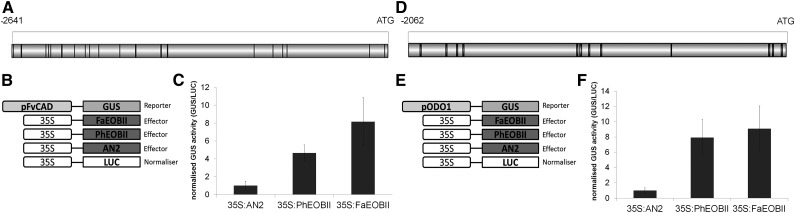
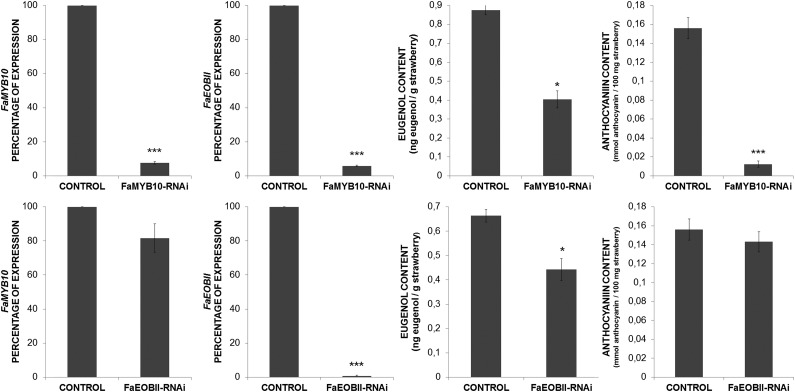
Eugenol is a volatile phenylpropanoid that contributes to flower and ripe fruit scent. In ripe strawberry (Fragaria × ananassa) fruit receptacles, eugenol is biosynthesized by eugenol synthase (FaEGS2). However, the transcriptional regulation of this process is still unknown. We have identified and functionally characterized an R2R3 MYB transcription factor (emission of benzenoid II [FaEOBII]) that seems to be the orthologous gene of PhEOBII from Petunia hybrida, which contributes to the regulation of eugenol biosynthesis in petals. The expression of FaEOBII was ripening related and fruit receptacle specific, although high expression values were also found in petals. This expression pattern of FaEOBII correlated with eugenol content in both fruit receptacle and petals. The expression of FaEOBII was repressed by auxins and activated by abscisic acid, in parallel to the ripening process. In ripe strawberry receptacles, where the expression of FaEOBII was silenced, the expression of cinnamyl alcohol dehydrogenase1 and FaEGS2, two structural genes involved in eugenol production, was down-regulated. A subsequent decrease in eugenol content in ripe receptacles was also observed, confirming the involvement of FaEOBII in eugenol metabolism. Additionally, the expression of FaEOBII was under the control of FaMYB10, another R2R3 MYB transcription factor that regulates the early and late biosynthetic genes from the flavonoid/phenylpropanoid pathway. In parallel, the amount of eugenol in FaMYB10-silenced receptacles was also diminished. Taken together, these data indicate that FaEOBII plays a regulating role in the volatile phenylpropanoid pathway gene expression that gives rise to eugenol production in ripe strawberry receptacles.


Figures

Figure 1.
Figure 1.
Nuclear location of the FaEOBII protein in plant cells. Fluorescence signal was detected using a confocal microscope from GFP-FaEOBII (top row) and GFP (bottom row) expression under the control of the 35S promoter in N. benthamiana leaf epidermis cells. The MERGE column shows merged views of the GFP and DAPI images.
Figure 2.
Figure 2.
Analysis by qRT-PCR of FaEOBII expression in developing fruit receptacles (A), achenes (B), and plant tissues (C) of F. ananassa ‘Camarosa.’ G1, Small-sized green fruit; G3, full-sized green fruit; W, white stage; R, ripe stage; OR, overripe stage; SN, senescent stage. Quantification is based on cycle threshold (Ct) values. Relative expression values were calculated relative to receptacles in the G1 stage in all cases, which was assigned an arbitrary value equal to unity. Values are means ± sd of five independent experiments. Statistical significance was determined by one-way ANOVA. Letters indicate significant differences (P < 0.05, Scheffe’s post hoc test).
Figure 3.
Figure 3.
Analysis of spatiotemporal changes in gene expression and content of eugenol. A, Bars represent the developmental expression of strawberry FaODO1, FaEGS1, FaEOBII, FaCAD1, and FaEGS2 genes in receptacles of F. ananassa ‘Camarosa’ obtained by qRT-PCR. B, Bars represent relative expression values of FaEOBII, FaCAD, and FaEGS2 genes in overripe receptacles versus petals. Stages are as defined in Figure 2. Lines represent gas chromatography (GC)-mass spectrometry (MS) quantification of eugenol. Values are given in nanograms of eugenol per gram of strawberry. One-way ANOVA was performed on log-transformed data, and letters indicate significant differences (P < 0.05, lsd post hoc test).
Figure 4.
Figure 4.
Analysis of gene expression changes and eugenol content. A, Analysis by qRT-PCR of EOBII, EGS2, and CAD1 gene expression in red ripe receptacles of the cultivated strawberry F. ananassa ‘Camarosa’ and in the wild strawberries F. vesca Mutant White and F. vesca Wild Red of cv Reina de los Valles. Quantification is based on Ct values as described in “Materials and Methods.” The increase in the mRNA value was relative to the F. ananassa Ct value of each experiment, which was assigned an arbitrary value equal to unity. Mean values ± sd of six independent experiments are shown. Statistical significance was determined by one-way ANOVA. Letters indicate significant differences (P < 0.05, Scheffe’s post hoc test). B, GC-MS quantification of eugenol in strawberry fruit varieties. Values are given in nanograms of eugenol per gram of strawberry. One-way ANOVA was performed on log-transformed data, and letters indicate significant differences (P < 0.05, lsd post hoc test).
Figure 5.
Figure 5.
Analysis of the effects of removing achenes from G2 developing fruits of F. ananassa ‘Camarosa’ on FaEOBII expression by qRT-PCR. Quantification is based on Ct values as described in “Materials and Methods.” Increase in the mRNA value was relative to the receptacle G2 Ct value of each experiment, which was assigned an arbitrary value equal to unity. Values are means ± sd of five independent experiments. CONTROL G2, Middle-sized green fruit receptacle; G2-ACHENES + LANOLINE, G2 fruit receptacles without achenes for 5 d covered by a lanolin paste; G2-ACHENES + IAA + LANOLINE, G2 fruit receptacle without achenes for 5 d treated with the synthetic auxin IAA as a lanolin paste with 1 mm IAA. Statistical significance was determined by one-way ANOVA. Letters indicate significant differences (P < 0.05, Scheffe’s post hoc test).
Figure 6.
Figure 6.
Analysis by qRT-PCR of FaEOBII and FaNCED1 expression (bars) and quantification of ABA concentration (lines). A, CONTROL, Green-white fruits injected with water; NDGA, green-white fruits injected with NDGA (100 μm). B, CONTROL, Control fruits agroinfiltrated with the empty pFRN vector; FaNCED1-RNAi, transgenic strawberry fruits agroinfiltrated with the pFRN-FaNCED1 construct. C, CONTROL FRUITS, Fruits with the pedicels immersed in Murashige and Skoog medium with Suc; FRUITS + WATER STRESS, fruits with their pedicels kept in the air. Mean values ± sd of five independent experiments are shown. Statistical significance with respect to the reference sample (CONTROL) was determined by Student’s t test: **, P < 0.01; and ***, P < 0.001.
Figure 7.
Figure 7.
FaEOBII silencing effect on the expression of the structural genes belonging to the volatile phenylpropanoid biosynthesis pathway. A, Schematic diagram of the phenylpropanoid pathway in plants. White arrows indicate nonanalyzed genes. Gray arrows represent genes with no significant transcriptomic changes when FaEOBII is silenced. Orange and red arrows represent genes with significant transcriptomic changes in FaEOBII-silenced fruits. C4H, Cinnamate 4-hydroxylase; 4CL, 4-coumarate:CoA ligase; CHS, chalcone synthase; F3H, flavanone 3-hydroxylase; FLS, flavonol synthase; DFR, dihydroflavonol-4-reductase; ANS, anthocyanidin synthase (also called LDOX, leucoanthocyanidin dioxygenase); UFGT, UDP-flavonoid glucosyltransferase; C3H, p-coumarate 3-hydroxylase; COMT, caffeic O-methyltransferase; F5H, ferulic acid 5-hydroxylase; CCR, cynnamoyl CoA reductase; CAD, cynnamyl alcohol dehydrogenase. B, Analysis by qRT-PCR of the expression of genes involved in the phenylpropanoid pathway in FaEOBII-silenced fruits agroinfiltrated with the pFRN-FaEOBII construct, compared with control fruits agroinfiltrated with the empty pFRN vector only. The silencing level is expressed as a percentage. Statistical significance with respect to the reference sample (CONTROL) was determined by Student’s t test: **, P < 0.01; and ***, P < 0.001.
Figure 8.
Figure 8.
GC-MS quantification of eugenol, qRT-PCR analysis, and anthocyanin measurements in FaEOBII transitory transgenic fruit receptacles. A and C, GC-MS quantification of eugenol in strawberry fruit receptacles with FaEOBII expression silenced (pFRN-FaEOBII) with respect to control fruits (pFRN; A) and FaEOBII expression increased (pK7WG2-FaEOBII) with respect to control fruits (pK7WG2; C). Values are given in nanograms per gram. Statistical significance with respect to the reference sample (pFRN or pK7WG2) was determined by Student’s t test: *, P < 0.05. B and D, Bars represent the analysis by qRT-PCR of FaEOBII and FaEGS2 expression in transgenic strawberry fruits agroinfiltrated with the pFRN-FaEOBII construct and in control fruits agroinfiltrated with the empty pFRN vector (B) and with the pK7WG2-FaEOBII construct and in control fruits agroinfiltrated with the empty pK7WG2 vector (D). The silencing and overexpression levels are expressed as percentages. Quantification is based on Ct values as described in “Materials and Methods.” The values refer to the mRNA Ct value of control samples, which were assigned an arbitrary value equal to unity. Mean values ± sd of three independent experiments are shown. Lines represent anthocyanin content quantified on fruits analyzed. Statistical significance with respect to the reference sample (pFRN or pK7WG2) was determined by Student’s t test: ***, P < 0.001.
Figure 9.
Figure 9.
Transactivation of the CAD1 promoter of F. vesca and the ODO1 promoter of petunia ‘Mitchell’ by EOBII in N. benthamiana leaves. A and D, Schematic diagram of pFvCAD1 and pODO1 promoters using the PLACE online database (www.dna.affrc.go.jp) and DOG 2.0.1 for Windows (Illustrator of Protein Domain Structures). The bars at the top indicate the lengths of the promoter fragments relative to the ATG codon. The locations of the MBSII boxes are shown using black lines. B and E, Constructs used for the transactivation assays. C and F, Normalized GUS activity after coinfiltration with A. tumefaciens harboring any of the effector constructs with the pFvCAD1:GUS or the pODO1:GUS reporter construct. Coinfiltration with the CaMV 35S:AN2 effector was used to show EOBII specificity. Coinfiltration with 35S:LUC enabled normalization (averages ± se).
Figure 10.
Figure 10.
Identification of FaEOBII-binding motifs in vitro. A, Position weight matrix representation of the top-scoring 9-mer obtained in the seed-and-wobble algorithm. B, Box plot of enrichment scores (E-scores) containing all possible 7 mers indicated representing the MBSIIg and MBSII elements. Blue boxes represent quartiles 25% to 75%, and the black line represents the median of the distribution (quartile 50%). Bars indicate quartiles 1% to 25% (above) and 75% to 100% (below).
Figure 11.
Figure 11.
qRT-PCR analysis of FaMYB10 and FaEOBII transcript levels and eugenol and anthocyanin content determination in transgenic agroinfiltrated fruits injected with the corresponding RNAi construct. Statistical significance with respect to the control simple was determined by Student’s t test: *, P < 0.05; and ***, P < 0.001 (n = 10).

Similar articles

Cited by

References

    1. Aharoni A, De Vos CH, Wein M, Sun Z, Greco R, Kroon A, Mol JN, O’Connell AP (2001) The strawberry FaMYB1 transcription factor suppresses anthocyanin and flavonol accumulation in transgenic tobacco. Plant J 28: 319–332 - PubMed
    1. Aragüez I, Osorio S, Hoffmann T, Rambla JL, Medina-Escobar N, Granell A, Botella MÁ, Schwab W, Valpuesta V (2013) Eugenol production in achenes and receptacles of strawberry fruits is catalyzed by synthases exhibiting distinct kinetics. Plant Physiol 163: 946–958 - PMC - PubMed
    1. Asif M, Dhawan P, Nath P (2000) A simple procedure for the isolation of high quality RNA from ripening banana fruit. Plant Mol Biol Rep 18: 109–115
    1. Aubert C, Pitrat M (2006) Volatile compounds in the skin and pulp of Queen Anne’s pocket melon. J Agric Food Chem 54: 8177–8182 - PubMed
    1. Benítez-Burraco A, Blanco-Portales R, Redondo-Nevado J, Bellido ML, Moyano E, Caballero JL, Muñoz-Blanco J (2003) Cloning and characterization of two ripening-related strawberry (Fragaria × ananassa cv. Chandler) pectate lyase genes. J Exp Bot 54: 633–645 - PubMed

Publication types

MeSH terms

LinkOut - more resources