. 2015 May 1;348(6234):574-8.
doi: 10.1126/science.aaa1511.

Bacterial division. Mechanical crack propagation drives millisecond daughter cell separation in Staphylococcus aureus

Affiliations

Bacterial division. Mechanical crack propagation drives millisecond daughter cell separation in Staphylococcus aureus

Xiaoxue Zhou et al. Science. .

Abstract

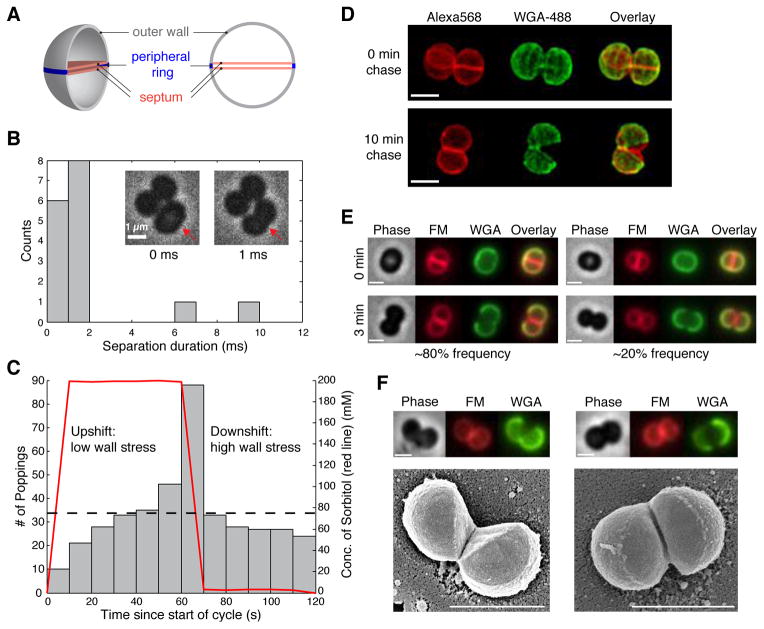
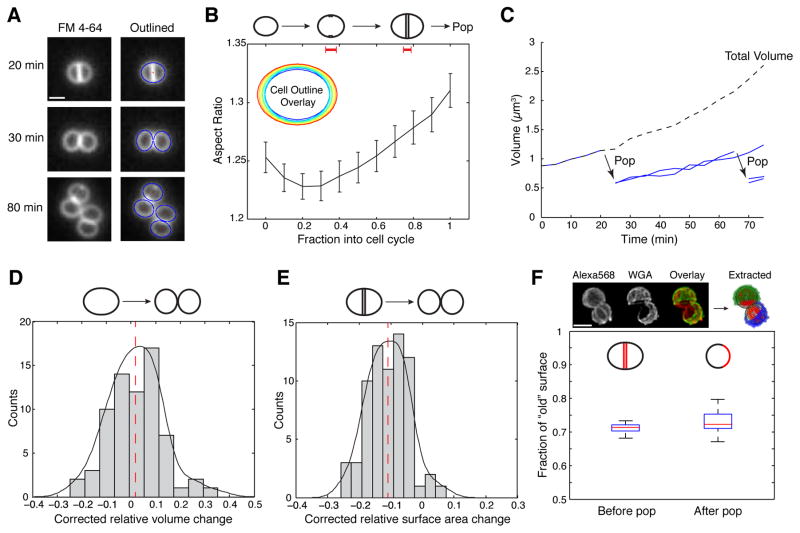
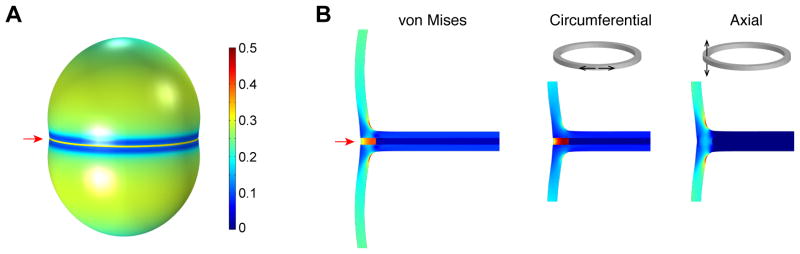
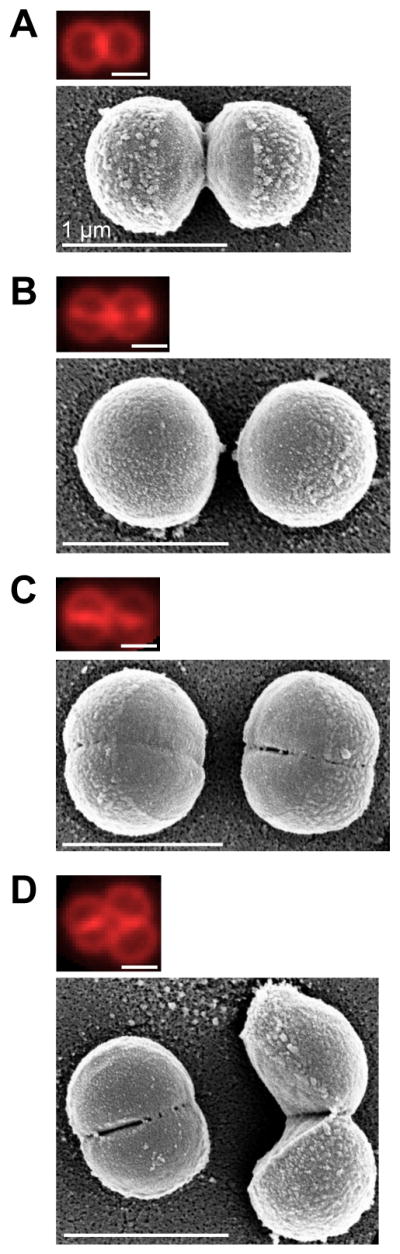
When Staphylococcus aureus undergoes cytokinesis, it builds a septum, generating two hemispherical daughters whose cell walls are only connected via a narrow peripheral ring. We found that resolution of this ring occurred within milliseconds ("popping"), without detectable changes in cell volume. The likelihood of popping depended on cell-wall stress, and the separating cells split open asymmetrically, leaving the daughters connected by a hinge. An elastostatic model of the wall indicated high circumferential stress in the peripheral ring before popping. Last, we observed small perforations in the peripheral ring that are likely initial points of mechanical failure. Thus, the ultrafast daughter cell separation in S. aureus appears to be driven by accumulation of stress in the peripheral ring and exhibits hallmarks of mechanical crack propagation.


Figures

Figure 1
Figure 1. Daughter cell separation in S. aureus occurs within milliseconds with characteristics of mechanical crack propagation
(A) A schematic diagram of the cell wall prior to daughter cell separation. (B) Snapshots of S. aureus strain Newman “popping” (inset) and histogram of daughter cell separation duration captured by phase contrast microscopy at 1000 frames/s (n=16). (C) Distribution of cumulative counts of popping events plotted over the 2-min oscillatory period for 200 mM osmotic shocks. Red line denotes the concentration of sorbitol in the medium, and dashed line denotes average popping counts assuming a uniform distribution (n=400). (D) 3D SIM images of fixed Newman cells labeled with fluorescent WGA (green), which marks the outer wall and followed by 0 or 10 min of growth in the absence of WGA. Cell surfaces and septa were stained with NHS-Alexa-568 (red). (E) Time-lapse epifluorescence images of Newman cells labeled with WGA (green) before (0 min) and after (3 min) popping. Corresponding phase-contrast (grey), membrane staining with FM 4-64 (red), and overlay of WGA and FM signals are also displayed. Two types of old wall geometry after popping were observed: hinged (left, ~80%) and non-hinged (right, ~20%). (F) Correlative light and scanning electron microscopy on Newman cells labeled with WGA followed by 10-min chase showing the two types of WGA labeling patterns as in (E). Scale bars: 1 μm.
Figure 2
Figure 2. Cell volume increases continuously throughout the cell cycle
(A) Time-lapse images of S. aureus cells stained with FM 4-64 (left) and outlined by fitting with ellipses (right). (B) Average aspect ratio of S. aureus cells throughout the cell cycle (from immediately after previous popping to ready-to-pop) and overlay of the cell outlines (inset) from a typical cell at different points of the cell cycle colored from blue (early) to red (late). Error bars denote standard errors (n=27). Red bars on top indicate the time fraction into the cell cycle when septation starts (left, 0.35 ± 0.03 SEM) and completes (right, 0.77 ± 0.02 SEM), respectively (n=26). (C) Representative traces of cell volume as a function of time following a microcolony starting from a single cell; solid blue traces indicate cell volumes of individual cells before popping and the dashed black line denotes the total cell volume of all the cells present at a given time. Cell volume and surface area were estimated from the 2D cell outlines by fitting to ellipses and assuming prolate cell shapes (i.e., that each cell was rotationally symmetric around the long axis). (D, E) Distribution of relative changes in volume (D) and surface area (E) during popping, after correcting for baseline growth rate. Black solid line represents kernel density estimate of the distribution and red dashed line denotes the average (2% ± 10% SD for volume, −11% ± 6.5% SD for surface area, n=69). (F) (top) 3D SIM images and corresponding extracted data (see also Fig. S5); (bottom) fraction of old surface before (0.71 ± 0.01 SD, n=15) and after (0.73 ± 0.03 SD, n=36) popping. Cells were modeled as ellipsoids and the contribution of the old, WGA-labeled wall to the daughter cells’ total surface area was measured by fitting a plane to the old/new boundary (Fig. S5A). Scale bars: 1 μm.
Figure 3
Figure 3. High stress in the peripheral ring prepares the cell for popping
(A) Von Mises stress distribution in the “ready-to-pop” S. aureus cell wall (state 3 in Fig. S6) modeled as a linear elastic material (see Supplementary Materials for details of model construction). Color represents the relative magnitude of stress. The stress at the peripheral ring (red arrow), where the cell wall splits open during popping, is higher than elsewhere in the outer wall. (B) Enlarged views of a cut-through slice of the cell in (A) shows high von Mises stress at the peripheral ring (red arrow) as well as the stress distribution in the circumferential and axial directions respectively.
Figure 4
Figure 4. Correlative SEM reveals cell-cycle dependent early signs of mechanical fracture
(A–D) Representative correlative fluorescence (top) and SEM images (bottom) of S. aureus Newman cells stained with FM 4-64, showing the cell surface features at different stages of the cell cycle. 98% (n=54) of the cells with visible holes (blind analysis, see Methods) had completed septa, while only 49% (n=108) of the cells with completed septa had holes.

References

    1. Wu LJ, Errington J. Nucleoid occlusion and bacterial cell division. Nat Rev Microbiol. 2012;10:8–12. - PubMed
    1. Typas A, Banzhaf M, Gross CA, Vollmer W. From the regulation of peptidoglycan synthesis to bacterial growth and morphology. Nat Rev Microbiol. 2012;10:123–136. - PMC - PubMed
    1. Foster TJ. Immune evasion by staphylococci. Nat Rev Microbiol. 2005;3:948–958. - PubMed
    1. de Lencastre H, Oliveira D, Tomasz A. Antibiotic resistant Staphylococcus aureus: a paradigm of adaptive power. Curr Opin Microbiol. 2007;10:428–435. - PMC - PubMed
    1. Pinho MG, Kjos M, Veening JW. How to get (a)round: mechanisms controlling growth and division of coccoid bacteria. Nat Rev Microbiol. 2013;11:601–614. - PubMed

Publication types